www.scielo.br/rbg
ANALYSIS OF SEISMIC ATTRIBUTES TO RECOGNIZE BOTTOM SIMULATING REFLECTORS
IN THE FOZ DO AMAZONAS BASIN, NORTHERN BRAZIL
Laisa da Fonseca Aguiar, Antonio Fernando Menezes Freire, Luiz Alberto Santos,
Ana Carolina Ferreira Dominguez, Eloíse Helena Policarpo Neves,
Cleverson Guizan Silva and Marco Antonio Cetale Santos
ABSTRACT.Foz do Amazonas Basin is located at the northern portion of the Brazilian Equatorial Margin, along the coastal zone of Amapá and Pará states. This basin has been subjected to several studies, and the presence of gas hydrates has been demonstrated locally through sampling, and over broader areas using seismic reflection data. Seismic reflection is one method to identify the occurrence of gas hydrates, as they give rise to well-marked reflectors that simulate the seafloor, known as Bottom Simulating Reflectors (BSR). This study aims to investigate BSRs associated with the presence of methane hydrates in the Foz do Amazonas Basin through the application of seismic attributes. It was compared seismic amplitudes from the seafloor and the BSR to validate the inferred seismic feature. Then, Envelope and Second Derivative were chosen for highlighting the BSR in seismic section. The results showed an inversion of polarities in the signal between the seafloor (positive polarity) and the BSR (negative polarity). The integrated use of these approaches allowed validating the level of the BSR in line 0239-0035 and inferring the presence of gas hydrates, revealing to be a useful tool for interpreting the distribution of the gas hydrates in the Foz do Amazonas Basin.
Keywords: gas hydrates, Envelope, Second Derivative of Envelope, Brazilian Equatorial Margin.
RESUMO.A Bacia da Foz do Amazonas é localizada na porção norte da Margem Equatorial Brasileira, ao longo da zona de costa dos estados do Amapá e do Pará. A presença de hidratos de gás é comprovada localmente através de amostragem, e em áreas mais distantes através de dados de sísmica de reflexão. A sísmica de reflexão é eficaz para identificar hidratos de gás, pois refletores que simulam o fundo do mar, Bottom Simulating Reflectors (BSR), são utilizados para inferir a presença dos hidratos de metano. Este estudo pretende identificar feições sísmicas associadas aos hidratos de metano na Bacia da Foz do Amazonas através da aplicação de atributos sísmicos. Foram comparadas as amplitudes sísmicas do fundo do mar e do BSR para validar a feição sísmica inferida. Então, os atributos Envelope e Segunda Derivada do Envelope foram escolhidos por destacarem o BSR. Os resultados mostraram uma inversão das polaridades no sinal entre o fundo do mar (positivo) e o BSR (negativo). O uso integrado dessas abordagens valida a localização do BSR na linha 0239-0035 e infere a ocorrência de hidratos de gás, revelando ser uma ferramenta útil para a interpretação da distribuição de hidratos de gás na Bacia da Foz do Amazonas.
Palavras-chave: hidratos de metano, Envelope, Segunda Derivada do Envelope, Margem Equatorial Brasileira.
Universidade Federal Fluminense, Instituto de Geociências, Departamento de Geologia e Geofísica. Av Gen. Milton Tavares de Souza, s/n, 24210-346, Boa Viagem, Niterói, RJ, Brazil,Phone: +55 21 2629-5955 – E-mails: [email protected], [email protected], [email protected], [email protected], [email protected], [email protected], [email protected]
INTRODUCTION
The occurrence of natural gas hydrates on continental margins worldwide, including the Foz do Amazonas Basin, is of growing interest due to its energy potential (Kvendolven, 1993; Sloan Jr, 2003; Joshi et al., 2017). Also noteworthy are the environmental aspects related to methane hydrates: their consequences on the planet’s climate, as an enhancer of the greenhouse effect, and in the context of instability of the seafloor (Kvendolven, 1993), which according to several authors can trigger mass movements (Flood & Piper, 1997; Maslin & Mikkelsen, 1997; Piper et al., 1997; Maslin et al., 2005). These aspects stimulate new research strategies in this scientific area.
The presence of methane hydrates can be inferred from Bottom Simulating Reflectors (BSRs) on seismic reflection data. A BSR is a seismic reflector parallel to the seafloor that coincides with the base of the Gas Hydrate Stability Zone (GHSZ), characterized by a negative reflectivity, i.e. polarity opposite to the seafloor (Hyndman & Spence, 1992; Kvendolven, 1993). The BSR is inferred to coincide with the phase boundary, and separate solid hydrates above from free gas below (Kvendolven, 1993). Thus, these well-marked reflection works as a seismic signature to identify and map gas hydrates (Joshi et al., 2017).
Seismic attributes are excellent tools for seismic interpretation and are increasingly important for the exploration of hydrocarbons (Taner et al., 1994). The development of seismic attributes is linked to advances in computational and processors. According to Taner et al. (1994) and Taner (2001), attributes were introduced in the early 1970s, where they were initially used only as a visualization tool. This perspective quickly evolved to their use in the qualitative interpretation of geometry and physical subsurface parameters. More recently, with the calibration of seismic data with well data, the use of attributes has sought a more quantitative approach in order to infer seismic characteristics.
The use of seismic attributes allows the extraction of information concerning subsurface geometry and physical parameters to obtain detailed knowledge about the geological context of a prospect (Taner et al., 1979). The choice of an attribute depends on the specific reservoir environments, the mathematical foundation of the attribute and what is this attribute sensitive to (Chen & Sidney, 1997).
There are several studies that uses the application of seismic attributes in order to examine and investigate the presence of gas hydrates in different regions around the world (Coren et al., 2001; Satyavani et al., 2008; Ojha & Sain, 2009). The use of attributes can allow the identification of BSR and its
continuity (Coren et al., 2001), and help inferring patterns related to the occurrence of gas hydrates and free gas below the Gas Hydrate Stability Zone (Satyavani et al., 2008).
The Foz do Amazonas Basin has been the object of studies concerning its tectono-sedimentary evolution, gravitational tectonics, hydrates mapping and distribution, and the occurrence of hydrocarbons (oil and gas). The evolution of the basin is related to the formation of the North Atlantic Ocean and its sedimentation extends from the continental margin to the deep-sea fan of the Amazonas River (Soares Jr. et al., 2008).
The Foz do Amazonas Basin is located on the Brazilian Equatorial Margin and includes the submarine deposits of the Amazonas River (Soares Jr. et al., 2008), one of the world’s largest deep-sea fans (Damuth & Kumar, 1975). The presence of gas hydrates within the Amazon deep-sea fan has been inferred from BSRs (Sad et al., 1998), and recently confirmed by seafloor sampling of fluid seeps (Ketzer et al., 2018).
This study aims to identify which seismic attributes are more effective to identify the presence of BSRs related to methane hydrates in the Foz do Amazonas Basin. In this work, the software Petrel was used for the interpretation of 2D reflection seismic data obtained from the Exploration and Production Database (BDEP) of the Brazilian National Agency of Petroleum, Natural Gas and Biofuels (ANP – Agência Nacional do Petróleo, Gás Natural e Biocombustíveis).
GEOLOGIC SETTING
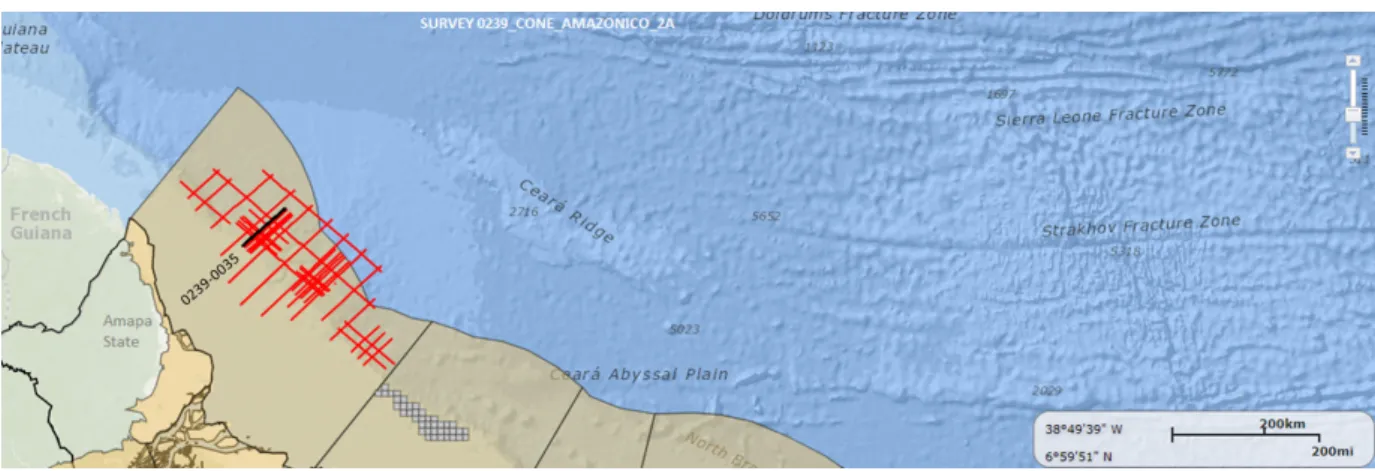
The Foz do Amazonas Basin is in the northern portion of the Brazilian Equatorial Margin and occupies a total area of approximately 268,000 km2, as shown in Figure 1. It includes the
continental shelf, the slope and the deep-water region, also known as the Amazon River Cone (Brandão & Feijó, 1994; Figueiredo et al., 2007).
The tectonic evolution of the Foz do Amazonas Basin is associated with the rupture of the supercontinent Gondwana, during the Aptian, that caused the separation of South American and African tectonic plates and the consequent formation of the Atlantic Ocean (Carvalho, 2008).
The structural framework of the Foz do Amazonas Basin can be explained through three tectonic events: the first event occurred in the Late Triassic and was associated with the formation of the Central Atlantic Ocean; the second tectonic event was in the Early Cretaceous and formed an elongated graben. Finally, the third tectonic event began in the Albian and is linked to the final process of separation of the African and South American
Figure 1 – Location map of the seismic survey provided by the Exploration and Production Database (BDEP) for the Foz do Amazonas Basin (Survey
0239_CONE_AMAZONICO_2A_STK_FIN). Seismic line 0239-0035 is highlighted. Source: http://webmaps.anp.gov.br/mapas/Lists/DSPAppPages/MapasBrasil.aspx (access on: May 26, 2018).
plates, resulting in formation of the passive margin and the onset of transform faulting in an ENE-WSW direction that segmented the margin (Soares Jr. et al., 2008).
The Amazon River Cone (or Submarine Fan of the Amazon River) is the morphological feature of greatest expression in the Foz do Amazonas Basin (Araújo et al., 2009), whose formation is associated to a high rate of siliciclastic sedimentation input to the Atlantic Ocean, since the middle Miocene, as a result of the uplift of the Andes Chain (Pasley et al., 2004; Figueiredo et al., 2007). The Amazon Fan range extends about 700 km from the continental shelf break (Rimington et al., 2000) and reaches bathymetric depths up to 4800 m, with a gradient of 0.4°(Rimington et al., 2000; Da Silva, 2008; Araújo et al., 2009). Cobbold et al. (2004) estimated that the cone has a thickness of approximately 10 km, with an average sedimentation rate of 1m
ka. (Damuth & Kumar, 1975) delimited the Amazon Cone in
three compartments according to changes in its gradient: upper (up to -3000 m of bathymetric level), middle (up to -4200 m) and lower (up to -4800 m). The upper slope concentrates enormous mass-transport deposits (MTDs) that represent the Neogene stratigraphic succession of the fan (Reis et al., 2010, 2016; Silva et al., 2016; Ketzer et al., 2018). Therefore, the focus of this study is concentrated on the Neogene where it hosts the upper slope gas hydrate system.
The Amazon fan is a depocenter in which its loading drives gravitational collapses (Reis et al., 2010, 2016; Ketzer et al., 2018). Several authors point to the existence of MTDs linked to gravitational landslides, and the dissociation of methane hydrates could be a possible trigger for these landslides (Piper et al., 1997; Araújo et al., 2009).
The recent study published by Ketzer et al. (2018) investigates gas seepage from the Gas Hydrate Stability Zone (GHSZ) on the Amazon Fan. They gathered evidence that about 60% of gas vents are located along seafloor faults that register undergoing gravitational collapse of the fan, while 40% are located in water depths of 650–715 m within the upper edge of the GHSZ. This could indicate the role of fluid migration along pathways created by faulting (Ketzer et al., 2018).
RECOGNITION OF GAS HYDRATES
The identification and characterization of methane hydrates can be done through geochemical studies, direct methods (cores and dredges) or indirect (seismic, echosounder, well logs and geoelectric methods) (Freire, 2010; Miller et al., 2015). Other indirect ways of identifying gas hydrates, associated with natural gas seeps or mud volcanoes, are realized through high-resolution imaging of the seafloor using Remoted Operated Vehicle (ROV) (Freire, 2010).
In general, the seismic reflection method is the most indirect method used to infer the presence of methane hydrates, through the identification of BSRs that may be associated with blanking (reduction in reflection amplitude), as well as seafloor mounds or pockmarks (Shipley et al, 1979; Katzman et al., 1994; Gehrmann et al., 2009 apud Miller et al., 2015; Freire et al., 2011).
The presence of gas hydrates is often detected from Bottom Simulating Reflectors, which delineate the maximum depth of the gas hydrate stability zone (Kvendolven, 1993; Lorenson & Kvendolven, 2001). These anomalous reflectors are characterized by reflection polarity opposite to the seafloor (Kvendolven, 1993; Hyndman & Spence, 1992).
SEISMIC ATTRIBUTES DEFINITION
Taner (2001) and Taner et al. (1994) defined seismic attributes as information that can be acquired from seismic data, either by direct/statistical measurements or by the interpreters’ experience. By applying these attributes, it is possible to obtain new notions and a more detailed and precise knowledge of the structural, stratigraphic and lithological characteristics of a given seismic prospect (Taner et al., 1979). The choice of attributes depends on the nature of each and the circumstances in which they may be useful, so that a given attribute may be more sensitive to certain reservoir environments, while some are better at revealing underground anomalies or as indicators of hydrocarbons (Chen & Sidney, 1997).
Taner et al. (1979) have developed a mathematical foundation for attribute computing, where the amplitude of the seismic trait is treated as the real part of a complex analytic signal, while the imaginary part is extracted through the Hilbert Transform (Chopra & Marfurt, 2005). Combination of the incoming seismic trait with the Hilbert Transform results in the so-called Instant Attributes, which are computed sample by sample and represent the instantaneous variation of several parameters. They are: Envelope, instantaneous phase, instantaneous frequency, Envelope derivatives, among others (Taner et al., 1979; Taner, 2001; Russel„ 2004).
Taner et al. (1979) observed that, from the analysis of the seismic signal as an analytical signal (i.e, analysis of the complex seismic trace), it is possible to separate the two components of the seismic trace, amplitude and phase. The amplitude of the seismic data is considered as the main factor for the determination of physical parameters, such as acoustic impedance, reflection coefficients, velocities and absorption. The phase component is the main factor in determining the shapes of the reflectors and their geometric configurations (Taner, 2001).
Seismic attributes classification
Several authors have contributed to the classification of seismic attributes in different groups. This work will follow the classification proposed by Taner in the official publication of the 2001 Canadian Society of Exploration Geophysics (CSEG), the attributes are classified as Pre-Stack or Post-Stack, based on the characteristic domain of each attribute. They can also be classified according to their computational characteristics. In the following topics, there is a briefly explanation of the main attributes classification used in this study.
Post-Stack attributes
During the stacking process, azimuth and offset information are lost. The input data is stacked or migrated CDPs. Migration in time maintains the relations of time and temporal variables as the frequency has its dimension preserved. For sections migrated in depth, the frequency is replaced by the wave number. This type of attribute is best suited for analyzing large volumes of data in initial studies (Taner, 2001).
Attributes related to geology
In this context, attributes can be divided into physical and geometric categories. Physical attributes are commonly used for lithologic classification and reservoir characterization, relating subsurface parameters to lithological characteristics (Taner, 2001), whereas geometric attributes are used for stratigraphic and structural interpretation.
In this work, after several attempts to select the best attributes to emphasize the BSR of the analyzed seismic section, two physical attributes present best results: the Envelope and the Second Derivative of the Envelope. The next topic describes these attributes and their main characteristics.
Envelope and the Second Derivative of the Envelope
The Envelope attribute is also known as ”instantaneous amplitude”, ”Envelope amplitude” or ”reflection strength” (Taner et al., 1979; Chen & Sidney, 1997). The theoretical basis of the instantaneous attributes was developed by (Taner et al., 1979) and it is based on the analysis of the complex seismic trace:
C(t) = s(t) + ih(t) (1)
where s(t) corresponds to the real part of the complex seismic trace; h(t) is the Hilbert Transform of the seismic trace, the imaginary part of the trace (also known as quadrature - Russel, 2004). The imaginary component h(t) is obtained by applying the Hilbert Transform in the seismic trace s(t), under the following conditions for h(t):
1. It is determined from s(t) by a linear convolution operation;
2. Reduce to the phasor representation (in complex numbers) if s(t) is a sinusoid.
If these conditions are met it is possible to determine h(t) for any s(t) that can be represented by a Fourier series or integral
(Taner et al., 1979). The use of the complex seismic trace allows computing instantaneous amplitude, instantaneous phase and instantaneous frequency in simple harmonic oscillation logic extensions. Therefore, the complex seismic trace can be rewritten in polar form:
C(t) = A(t)eiθ(t) (2)
where A(t) is the envelope of the seismic trace (or amplitude/instantaneous energy) and corresponds to the complex function module C(t):
A(t) =ps(t)2+ h(t)2 (3)
The Envelope is phase independent and is sensitive to changes in acoustic impedance, emphasizing changes in amplitude of the original seismic section. This attribute is related to reflectivity because it is proportional to the acoustic impedance contrast. In addition, it can be a good discriminant of numerous geological features, such as bright spots, possible gas accumulations, unconformities, changes in lithology and deposition environments, sequence limits, among others (Taner, 1992, 2001).
The Second Derivative of the Envelope is a seismic attribute that provides a measure of sharpness of the envelope peak. It shows all the peaks of the envelope, thus allowing a good representation of the subsurface, identifying all reflection interfaces, visible within the seismic bandwidth. This attribute also shows sudden changes in lithology and the depositional
environment, even when the corresponding Envelope is low (SEG Wiki, accessed October 16, 2017).
METHODS
Seismic data input and quality control
The first step in this work was the loading of seismic data, provided by the National Agency of Petroleum (ANP) - Exploration and Production Database (BDEP), into the software Petrel. Initially, the coordinates of the study region for the creation of the ”Foz do Amazonas” project were defined. After the establishment area covered by the seismic survey, 74 seismic lines of 2D reflection were imported.
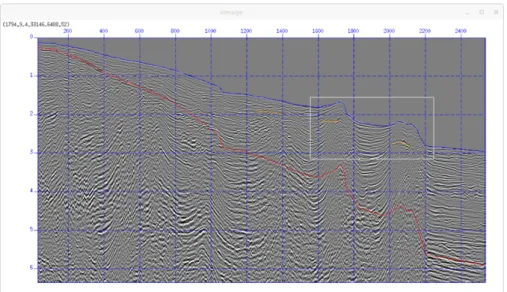
Due to the large number of seismic lines and the time required to map the horizons (seafloor and BSR), a sorting was carried out to choose the most appropriate seismic profile for the execution of this study. Seismic profiles were previously interpreted by the authors to analyze their quality and to extract preliminary knowledge about the main seismic reflectors. Thus, line 0239-0035 (Fig. 2) was selected because it presents interesting features, possibly related to gas hydrates.
Comparing amplitudes and applying seismic attributes
In this step, two spreadsheets were created to analyze the behavior of the possible BSR in comparison to the seafloor, in two distinct sections, in order to assure the BSR sectors location in the seismic.
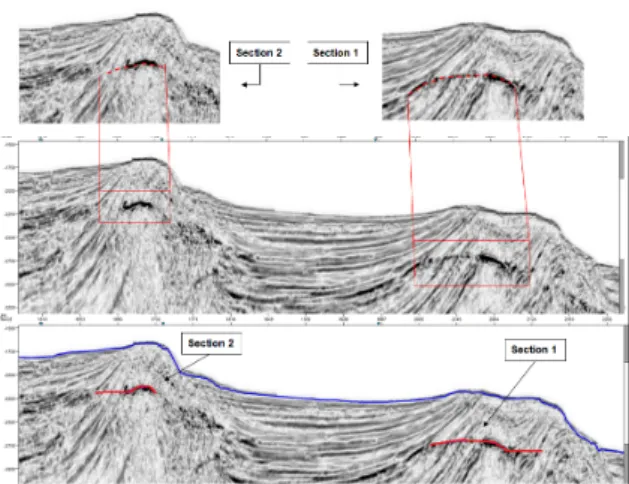
Figure 2 – Seismic line 0239-0035. The highlighted area in white represents the region of interest for this project. The blue
Figure 3 – Seismic line 0239-0035 with no interpretation (top) and with the two sections of BSR (white lines).
Afterwards, several seismic attributes were used to highlight the identified BSR in line 0239-0035 and, consequently, to infer the lower boundary of the gas hydrate stability zone. Two attributes were chosen that best highlighted the BSR: Envelope and Second Derivative of the Envelope.
RESULTS
Seismic interpretation
Through the methodology described above, it was possible to interpret line 0239-0035 and to identify negative amplitude reflections interpreted as BSRs, an indicative of the existence of methane hydrates in the Foz do Amazonas Basin (Fig. 3). When a BSR cross-cuts stratal reflections that are not parallel to the seafloor, it is sharp and easily identified. In sections where the stratification is parallel to the seafloor, BSRs can be harder to identify (Holbrook et al., 2002). The analysis of seismic amplitude and the use of seismic attributes can mitigate these uncertainties in order to infer the presence of gas hydrates. For this project, line 0239-0035 was analyzed in two sections, where possible BSRs are observed to cross-cut strata that are not parallel to the seafloor.
Comparison of seismic amplitudes of the seafloor and the BSR
According to Kvendolven (1993), the seismic reflector that coincides with the lower limit of the gas hydrate stability zone
can be defined by reversed polarity, in comparison to the seafloor coefficients. Theoretically, the amplitudes of well-marked BSRs are expected to be negative and large (Dillon et al., 1996).
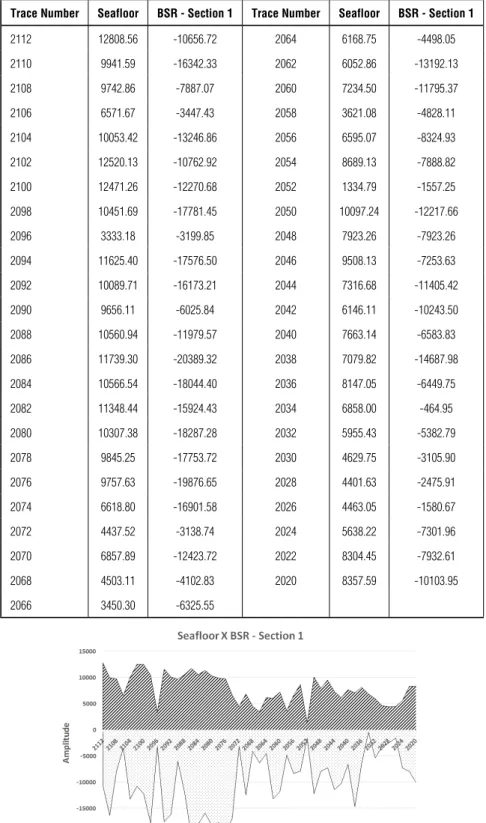
In order to validate the location of the BSRs in seismic and infer the presence of methane hydrates associated to these features, it is compared the seismic amplitudes for the two sections of line 0239-0035, in which these seismic reflectors are observed (Tables 1 and 2).
The amplitude data are plotted in Figures 4 and 5 and the inversion in polarity between the seafloor (positive) and the BSR (negative) is easily recognized. Even if the reversed polarity is not in terms of absolute values, there is clearly an approximation between the values of these amplitudes (except for a few points), which validates the identification and level of the BSR in both sections 1 and 2. BSR amplitude is extremely sensitive to small gas concentrations located below the hydrate stability zone (Holbrook et al., 2002), and some authors suggest that BSRs appear discontinuous at higher frequencies, forming a series of strong reflections that are parallel to the seafloor but laterally discontinuous (Dillon et al., 1996). This could be an explanation for the small intervals in which the absolute values of seismic amplitudes between the seafloor and the BSR are dissimilar. The concentration of gas hydrates, above the BSR, and of free gas below it, vary and cause the intensity of the reflector to vary locally. Thus, the BSR will be stronger the greater the saturations of gas hydrates and free gas, which increases the impedance contrast.
Table 1 – Seismic amplitudes of the seafloor and the BSR on section 1.
Trace Number Seafloor BSR - Section 1 Trace Number Seafloor BSR - Section 1
2112 12808.56 -10656.72 2064 6168.75 -4498.05 2110 9941.59 -16342.33 2062 6052.86 -13192.13 2108 9742.86 -7887.07 2060 7234.50 -11795.37 2106 6571.67 -3447.43 2058 3621.08 -4828.11 2104 10053.42 -13246.86 2056 6595.07 -8324.93 2102 12520.13 -10762.92 2054 8689.13 -7888.82 2100 12471.26 -12270.68 2052 1334.79 -1557.25 2098 10451.69 -17781.45 2050 10097.24 -12217.66 2096 3333.18 -3199.85 2048 7923.26 -7923.26 2094 11625.40 -17576.50 2046 9508.13 -7253.63 2092 10089.71 -16173.21 2044 7316.68 -11405.42 2090 9656.11 -6025.84 2042 6146.11 -10243.50 2088 10560.94 -11979.57 2040 7663.14 -6583.83 2086 11739.30 -20389.32 2038 7079.82 -14687.98 2084 10566.54 -18044.40 2036 8147.05 -6449.75 2082 11348.44 -15924.43 2034 6858.00 -464.95 2080 10307.38 -18287.28 2032 5955.43 -5382.79 2078 9845.25 -17753.72 2030 4629.75 -3105.90 2076 9757.63 -19876.65 2028 4401.63 -2475.91 2074 6618.80 -16901.58 2026 4463.05 -1580.67 2072 4437.52 -3138.74 2024 5638.22 -7301.96 2070 6857.89 -12423.72 2022 8304.45 -7932.61 2068 4503.11 -4102.83 2020 8357.59 -10103.95 2066 3450.30 -6325.55
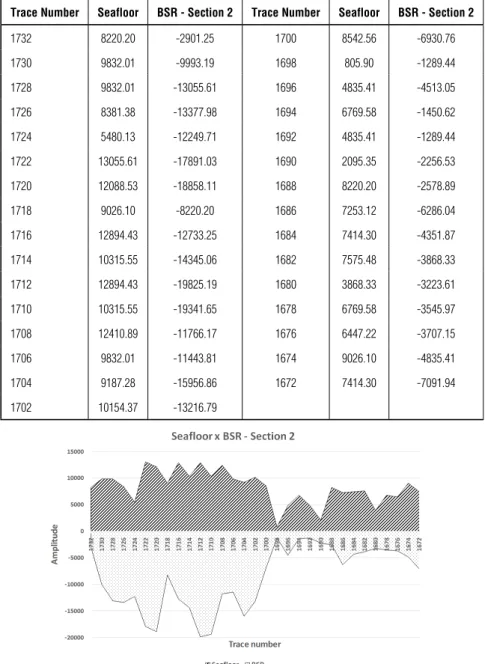
Table 2 – Seismic amplitudes of the seafloor and the BSR on section 2.
Trace Number Seafloor BSR - Section 2 Trace Number Seafloor BSR - Section 2
1732 8220.20 -2901.25 1700 8542.56 -6930.76 1730 9832.01 -9993.19 1698 805.90 -1289.44 1728 9832.01 -13055.61 1696 4835.41 -4513.05 1726 8381.38 -13377.98 1694 6769.58 -1450.62 1724 5480.13 -12249.71 1692 4835.41 -1289.44 1722 13055.61 -17891.03 1690 2095.35 -2256.53 1720 12088.53 -18858.11 1688 8220.20 -2578.89 1718 9026.10 -8220.20 1686 7253.12 -6286.04 1716 12894.43 -12733.25 1684 7414.30 -4351.87 1714 10315.55 -14345.06 1682 7575.48 -3868.33 1712 12894.43 -19825.19 1680 3868.33 -3223.61 1710 10315.55 -19341.65 1678 6769.58 -3545.97 1708 12410.89 -11766.17 1676 6447.22 -3707.15 1706 9832.01 -11443.81 1674 9026.10 -4835.41 1704 9187.28 -15956.86 1672 7414.30 -7091.94 1702 10154.37 -13216.79
Figure 5 – Seismic amplitudes of line 0239-0035 on the seafloor and the BSR - section 2.
Application of seismic attributes
The first seismic attribute applied to the line was the Envelope (or instantaneous amplitude). As this attribute is directly related to the acoustic impedance contrast, its application is significant for the characterization of methane hydrates. Figure 6 shows line 0239-0035 with the Envelope attribute applied. The use of the Envelope attribute enhances the visualization and identification
of BSR, especially in the interval between the numbers of traces 2112-2022 for section 1 and 1732-1676 for section 2, since this attribute works as a good discriminator for lithological and stratigraphic changes in reservoirs and accumulations of gas and fluids (Taner, 1992; Chen & Sidney, 1997), therefore it highlights the presence of free gas trapped beneath the BSR.
The second seismic attribute used to infer the presence of methane hydrates was the Second Derivative of the Envelope.
Figure 6 – Seismic line 0239-0035 with Envelope attribute applied. The two
sections of BSR are highlighted in red.
Figure 7 – Seismic line 0239-0035 with the Second Derivative of Envelope
attribute applied. The two sections of BSR are highlighted in red.
Figure 7 illustrates line 0239-0035 with the Second Derivative of the Envelope applied and possible portions of the BSR not interpreted and interpreted, respectively. Like the Envelope, the use of the Second Derivative of Envelope enhances the visualization of the BSR of both passages in the seismic section. According to Taner (1992), this attribute provides a good subsurface representation and highlights less smooth lithology changes.
DISCUSSION
As Satyavani et al. (2008) pointed out, mapping a BSR in a seismic section is an effective approach in order to find the occurrence of methane hydrates. There are some studies around the world in which the BSRs are not identified, however gas hydrates have been confirmed by drilling (Satyavani et al., 2008). This suggests the importance of looking for other indirect methods to ascertain the presence of gas hydrates and free gas.
Therefore, using seismic attributes as a tool for seismic interpretation of methane hydrates is valid and legitimate. Each seismic attribute has its own advantages, disadvantages and limitations. It is worth noting the importance of applying more than one attribute for reducing uncertainties and avoiding biased interpretations. For instance, Coren et al. (2001) suggested a multi-attribute analysis with well logs correlation that supported delineate some of the characterizing physical properties of the BSR. As Satyavani et al. (2008) indicate, the application of AVO (amplitude versus offset) can also provide information about the presence of free gas beneath the BSR. Besides, in other studies, it was observed that seismic attribute analysis allowed instantaneous amplitude (or Envelope) and
instantaneous frequency sections to validate the level of the BSR and hence infer the presence of gas hydrate layer and free gas (Satyavani et al., 2008; Joshi et al., 2017), which corroborates with what has been proposed in this study.
CONCLUSIONS
The integration of geophysical methods is valuable for a more accurate characterization of the subsurface. In this study, two approaches were proposed: a comparison of seismic amplitudes and the application of seismic attributes, which together addressed the identification of BSRs. These approaches reveal to be a useful tool for interpreting the distribution of the gas hydrates in the Foz do Amazonas Basin.
The results showed that there is an inversion of polarities in the signal between the seafloor (positive polarity) and the BSR (negative polarity), although this inversion is not always in absolute values. In addition, the attributes chosen for this study -Envelope and Second -Envelope Derivative – were able to enhance the visualization of BSR. The integrated use of these methods allowed validating the identification of the BSR in line 0239-0035 and inferring the presence of gas hydrates.
ACKNOWLEDGMENTS
The authors are thankful to the National Agency of Petroleum (ANP) for the permission to use the seismic of the Foz do Amazonas Basin from the database of Exploration and Production (BDEP). The authors are also thankful for the reviewers for the careful revision of this manuscript.
REFERENCES
ARAÚJO EFS, SILVA CG, REIS ATD, PEROVANO R, GORINI C, VENDEVILLE BC & ALBUQUERQUE NCD. 2009. Movimentos de massa multiescala na bacia da Foz do Amazonas-Margem Equatorial Brasileira. Brazilian Journal of Geophysics, 27(3): 485–508.
BRANDÃO JAS & FEIJÓ FJ. 1994. Bacia da Foz do Amazonas. Boletim de Geociências da Petrobras, 8(1): 91–99.
CARVALHO GCRD. 2008. Interpretação sísmica e modelagem física do cone do Amazonas, Bacia da Foz do Amazonas, margem equatorial brasileira. Master’s dissertation. Departamento de Geologia, Escola de Minas, Universidade Federal de Ouro Preto, MG, Brazil. 119 pp. CHEN Q & SIDNEY S. 1997. Seismic attribute technology for reservoir forecasting and monitoring. The Leading Edge, 16(5): 445–448. CHOPRA S & MARFURT KJ. 2005. Seismic attributes - A historical perspective. Geophysics, 70(5): 3SO–28SO.
COBBOLD PR, MOURGUES R & BOYD K. 2004. Mechanism of thin-skinned detachment in the Amazon Fan: assessing the importance of fluid overpressure and hydrocarbon generation. Marine and Petroleum Geology, 21(8): 1013–1025.
COREN F, VOLPI V & TINIVELLA U. 2001. Gas hydrate physical properties imaging by multi-attribute analysis – Blake Ridge BSR case history. Marine Geology, 178(1-4): 197–210.
DA SILVA RJP. 2008. Colapso gravitacional e estruturação da seção marinha da bacia da Foz do Amazonas no contexto de múltiplos níveis de destacamento. Master’s dissertation. Departamento de Geologia, Universidade Federal Fluminense, Niterói, RJ, Brazil. 101 pp. DAMUTH JE & KUMAR N. 1975. Amazon cone: morphology, sediments, age, and growth pattern. Geological Society of America Bulletin, 86(6): 863–878.
DILLON WP, HUTCHINSON DR & DRURY RM. 1996. Seismic reflection profiles on the Blake Ridge near Sites 994, 995, and 997. In: Proceedings of the Ocean Drilling Program. Initial Reports, 164: 47-56.
FIGUEIREDO JJP, ZALÁN PV & SOARES EF. 2007. Bacia da Foz do Amazonas. Boletim de Geociências da Petrobras, 15(2): 299–309. FLOOD RD & PIPER DJ. 1997. Amazon Fan sedimentation: the relationship to Equatorial climate change, continental denudation, and sea-level fluctuations. In: FLOOD RD, PIPER DJW, KLAUS A & PETERSON LC (Eds.). Proceedings of the Ocean Drilling Program. Scientific Results, 155: 653–675.
FREIRE AFM. 2010. An integrated study on the gas hydrate area of Joetsu Basin, eastern margin of Japan Sea, using geophysical, geological and geochemical data. Ph.D. thesis. Graduate School of Frontier Sciences. The University of Tokyo, Japan. 247 pp.
FREIRE AFM, MATSUMOTO R & SANTOS LA. 2011. Structural-stratigraphic control on the Umitaka Spur gas hydrates of Joetsu Basin in the eastern margin of Japan Sea. Marine and Petroleum Geology, 28: 1967–1978.
GEHRMANN R, MÜLLER C, SCHIKOWSKY P, HENKE T, SCHNABEL M & BÖNNEMANN C. 2009. Model-based Identification of the Base of the Gas Hydrate Stability Zone in Multichannel Reflection Seismic Data, Offshore Costa Rica. International Journal of Geophysics, 2009: ID 812713, 12 pp. HOLBROOK WS, GORMAN AR, HOMBACH M, HACKWITH KL, NEALON J, LIZARRALDE D & PECHER IA. 2002. Seismic detection of marine methane hydrate. The Leading Edge, 21(7): 686–689.
HYNDMAN RD & SPENCE GD. 1992. A seismic study of methane hydrate marine bottom simulating reflectors. Journal of Geophysical Research: Solid Earth, 97(B5): 6683–6698.
JOSHI AK, PANDEY L & SAIN K. 2017. Identification of BSR and estimation of gas hydrate from well-log data at NGHP-01-04a and 11A in the Krishna-Godavari Basin, Eastern Indian Margin. In: SEG Technical Program Expanded Abstracts 2017. Society of Exploration Geophysicists. p. 3483–3487.
KATZMAN R, HOLBROOK WS & PAULL CK. 1994. Combined vertical-incidence and wide-angle seismic study of a gas hydrate zone, Blake Ridge. Journal of Geophysical Research: Solid Earth, 99(B9): 17975–17995.
KETZER JM, AUGUSTIN A, RODRIGUES LF, OLIVEIRA R, PRAEG D, PIVEL MAG, DOS REIS AT, SILVA C & LEONEL B. 2018. Gas seeps and gas hydrates in the Amazon deep-sea fan. Geo-Marine Letters, 38(5): 429–438.
KVENDOLVEN KA. 1993. Gas hydrates-geological perspective and global change. Reviews of Geophysics, 31(2): 173–187.
LORENSON TD & KVENDOLVEN KA. 2001. A worldwide Assessment of Coincidental gas hydrate and Petroleum Gas Occurrences. In: AAPG Annual Convention. Program with Abstracts, Tulsa, AAPG, v. 10, A120. MASLIN M & MIKKELSEN N. 1997. Amazon Fan mass-transport deposits and underlying interglacial deposits: age estimates and Fan dynamics. In: FLOOD RD, PIPER DJW, KLAUS A & PETERSON LC (Eds.). Proceedings of the Ocean Drilling Program. Scientific Results, 155: 353–365.
MASLIN M, VILELA C, MIKKELSEN N & GROOTES P. 2005. Causes of catastrophic sediment failures of the Amazon Fan. Quaternary Science Reviews, 20: 2180–2193.
MILLER DJ, KETZER JM, VIANA AR, KOWSMANN RO, FREIRE AFM, OREIRO SG, AUGUSTIN AH, LOUREGA RV, RODRIGUES LF, HEEMAN R & PREISSLER AG. 2015. Natural gas hydrates in the Rio Grande Cone (Brazil): A new province in the western South Atlantic. Marine and Petroleum Geology, 67: 187–196.
OJHA M & SAIN K. 2009. Seismic attributes for identifying gas-hydrates and free-gas zones: application to the Makran accretionary prism. Episodes, 32(4): 264–270.
PASLEY MA, SHEPHERD DB, POCKNALL DT, BOYD KP, ANDRADE V & FIGUEIREDO JP. 2004. Sequence stratigraphy and basin evolution of the Foz do Amazonas Basin, Brazil. In: AAPG International Conference & Exhibition. Cancun, Mexico: American Association of Petroleum Geologists, 10082.
PIPER DJW, PIRMEZ C, MANLEY PL, LONG D, FLOOD RD, NORMARK WR & SHOWERS W. 1997. Mass-transport deposits of the Amazon Fan. In: FLOOD RD, PIPER DJW, KLAUS A & PETERSON LC (Eds.). Proceedings of the Ocean Drilling Program. Scientific Results, 155: 109–146.
REIS AT, ARAÚJO E, SILVA CG, CRUZ AM, GORINI C, DROZ L, MIGEON S, PEROVANO R, KING I & BACHE F. 2016. Effects of a regional décollement level for gravity tectonics on late Neogene to recent large-scale slope instabilities in the Foz do Amazonas Basin, Brazil. Marine and Petroleum Geology, 75: 29–52.
REIS AT, PEROVANO R, SILVA CG, VENDEVILLE BC, ARAÚJO E, GORINI C & OLIVEIRA V. 2010. Two-scale gravitational collapse in the Amazon Fan: a coupled system of gravity tectonics and mass-transport processes. Journal of the Geological Society, 167(3): 593–604. RIMINGTON N, CRAMP A & MORTON A. 2000. Amazon Fan sands: implications for provenance. Marine and Petroleum Geology, 17(2): 267–284.
RUSSEL BH. 2004. The application of multivariate statistics and neural networks to the prediction of reservoir parameters using seismic attributes. Ph.D. thesis. University of Calgary, Canada. 392 pp. SAD ARE, SILVEIRA DP, MACHADO MAP, SILVA SRP & MACIEL RR (Eds.). 1998. Marine gas hydrates evidence along the Brazilian Coast. In: AAPG International Conference and Exhibition. Rio de Janeiro, Brazil: American Association of Petroleum Geologists.
SATYAVANI N, SAIN K, LALL M & KUMAR BJP. 2008. Seismic attribute study for gas hydrates in the Andaman Offshore India. Marine Geophysical Researches, 29(3): 167–175.
SHIPLEY TH, HOUSTON MH, BUFFLER RT, SHAUB FJ, McMILLEN KJ, LADD JW & WORZEL JL. 1979. Seismic reflection evidence for widespread occurrence of possible gas-hydrate horizons on continental slopes and rises. American Association of Petroleum Geologists Bulletin, 63: 2204–2213.
SILVA CC, DOS REIS AT, PEROVANO RJ, GORINI MA, DOS SANTOS MV, JECK IK, TAVARES AAA & GORINI C. 2016. Multiple megaslide complexes and their significance for the Miocene stratigraphic evolution of the offshore Amazon Basin. In: LAMARCHE G, MOUNTJOY J, BULL S, HUBBLE T, KRASTEL S, LANE E, MICALLEF A, MOSCARDELLI L, MUELLER C, PECHER I & WOELZ S (Eds.). Submarine Mass Movements and their Consequences. Springer, 41: 49–60.
SLOAN Jr ED. 2003. Fundamental principles and applications of natural gas hydrates. Nature, 426(6964): 353.
SOARES Jr AV, COSTA JBS & HASUI Y. 2008. Evolução da Margem Atlântica Equatorial do Brasil: Três Fases Distensivas. Geociências (São Paulo), 27: 427–437.
TANER MT. 1992. Attributes Revisited - Rock Solid Images. Houston, Texas. RSI. (Revised Sep. 2000), p. 3-27.
TANER MT. 2001. Seismic Attributes. CSEG Recorder, 26(7): 49–56. TANER MT, KOEHLER F & SHERIFF RE. 1979. Complex seismic trace analysis. Geophysics, 44(6): 1041–1063.
TANER MT, O’DOHERTY R, SCHUELKE JS & BAYSAL E (Eds.). 1994. Seismic attributes revisited. In: 64th SEG Annual Meeting. Expanded Abstracts. Los Angeles, US, Society of Exploration Geophysicists.
ADDITIONAL REFERENCES
BDEP WebMaps – Banco de Dados de Exploração e Produção, ANP. Available on: <http://webmaps.anp.gov.br/mapas/Lists/DSPAppPages/ MapasBrasil.aspx.>. Access on: May 26, 2018.
SEG Wiki – Dictionary: Second Time Derivative of the trace Envelope. Available on: <http://wiki.seg.org/wiki/Dictionary:Second\ _time\_derivative\_of\_the\_trace\_Envelope>. Access on: October 16, 2017.
Recebido em 26 setembro, 2018 / Aceito em 17 dezembro, 2018 Received on September 26, 2018 / accepted on December 17, 2018