BJRS
RADIATION SCIENCES
03-1A (2015) 01-13Improvement and storage of conventional mammography
images using techniques of digital image processing
M. M. A. Silva
a; J. W. Vieira
b,c; L. A. P. Santos
a,d; I. R. Monteiro
a, F. R. A. Lima
a,daDepartamento de Energia Nuclear, Universidade Federal de Pernambuco, 50740-540, Recife-PE, Brasil
[email protected] [email protected]
b Laboratório de Dosimetria Numérica, Instituto Federal de Educação, Ciência e Tecnologia de Pernambuco,
50740-540, Recife-PE, Brasil
c Escola Politecnica de Pernambuco,50720-001, Recife-PE,Brasil,
d Centro Regional de Ciências Nucleares do Nordeste, Comissão Nacional de Energia Nuclear,50740-540,
Recife-PE, Brasil. [email protected]
ABSTRACT
The aim of this work is to show that a computer program, called digital image processing (DIP), can be used as an alternative method for breast diagnosis in hospitals and clinics that have not yet computerized mammography service. The image of mammogram obtained in reference is used to demonstrate the usefulness of some techniques of the DIP computer program involving contrast enhancement, smoothing of noise and segmentation. These techniques were used to calculate the area of soft tissue that is being occupied by certain tumor. To implement the DIP techniques the mammography department needs to have a high-resolution scanner, a computer and the DIP software, which is an application, developed by the Grupo de Dosimetria Numérica (GDN). The images can be organized and stored into stacks of images in the standard format for 3D image on DIP and then processed to obtain an improvement. In this work, we used the nonlinear median filter to remove noise or artifacts of the original image. Linear functions have also been used to improve contrast and sharpest of the image. Using segmentation and logical operations the area where the tumor is located in the image will be treated and correspond to the shades of gray. Then, the pixels are computed aiming to calculate the percentage of soft tissue that is occupied by the tumor
Digital imaging processing, mammography, segmentation
1.
INTRODUCTION
The software of Digital Image Processing (DIP) is a program that brings together specific computational features for computational dosimetry, such as image improvement, among other resources and aims to assist researches involving studies based on radiological images [1]. The noise reduction, improved contrast and image segmentation are demonstrated in this work in order to make the calculation of the percentage of tissue occupied by a tumor on a mammogram image using the DIP software.
Patients who assisted daily by a clinic specializing in mammography have different problems, but all mammograms receive a medical report based on the BI-RADS (Breast Image Reporting and Data System) which is the name of a standardized system established in the United States, used to standardize radiology reports when analyzing the mammogram image.
With digitization, the image will be sent to the computer in .jpeg. After post-processing, the mammography department of the hospital or clinic can store mammograms in stacks of .sgi format images.
The BIRADS classification is one of the several criteria that can be used for the storage of these image stacks, for example, assisting in other diagnoses made by doctor, since the file can be consulted at any time in order to make easer the storage and the little space occupied compared with other file extensions
2.
MATERIALS AND METHODS
2.1. DIP SOFTWARE RESOURCES APPLICATION
demonstrate its utility in everyday life of a mammography department.
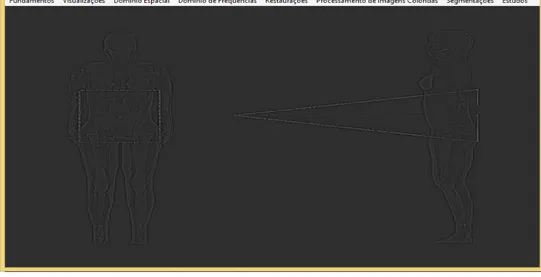
Figure 1: Presentation of Digital Image Processing, DIP software.
Source: DIP Software
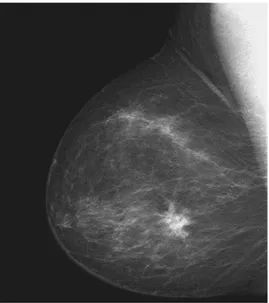
The Mammography presented in the Figure 2 [2] is in .jpeg format, which was converted from .tiff format. In this work it was used only one mammography and its analysis will be made by means of bidimensional form. For this reason, there is no need to convert the image into .sgi format because this is the used to build the images stacks.
Source: R. C. Gonzalez, R. E. Woods,2008
In this work it was used only one mammography and its analysis will be made by means of bidimensional form. For this reason, there is no need to convert the image into .sgi format because this is the used to build the images stacks. Form images stack means select several images and group them in a specific category. These stacks represent an anatomical region of the human body in a 3D form. The DIP software offers tools to improve 2D and 3D images.
3.
RESULTADOS E DISCUSSÕES
3.1. NOISE REDUCTION
The DIP software contains functions of nonlinear filters for imaging treatments. The median filter was used in order to reduce the noise on mammography. Median is a statistical measurement, which characterizes a central tendency for a set of data. In image processing, the data set comes from the image. The main utility of the median filter is to reduce the image noise mainly when it is formed by points known as "salt and pepper," [3]. This filter was applied using the size 5x5 two times. Figure 3 shows the image after DIP software processing.
Source: SILVA,2014.
The DIP software uses arithmetic operations such as Subtraction to show what was filtered in fact, showing the noise subtracted. After apply the Subtraction technique, the noise is minimized, as shown in Figure 4.
Figure 4: Subtraction technique.
Source: SILVA, 2014.
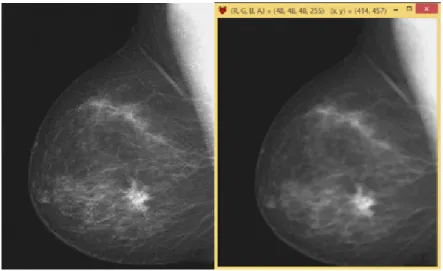
This technique amplifies the grayscale and facilitates visualization. The mammography noise was highlighted to show that the treatment was performed by means of a linear transformation in the spatial domain. Figure 5 presents a comparison between images before and after the application of the linear transformation.
Figure 5: Noise highlighted after applying the linear transformation.
Source: SILVA,2014.
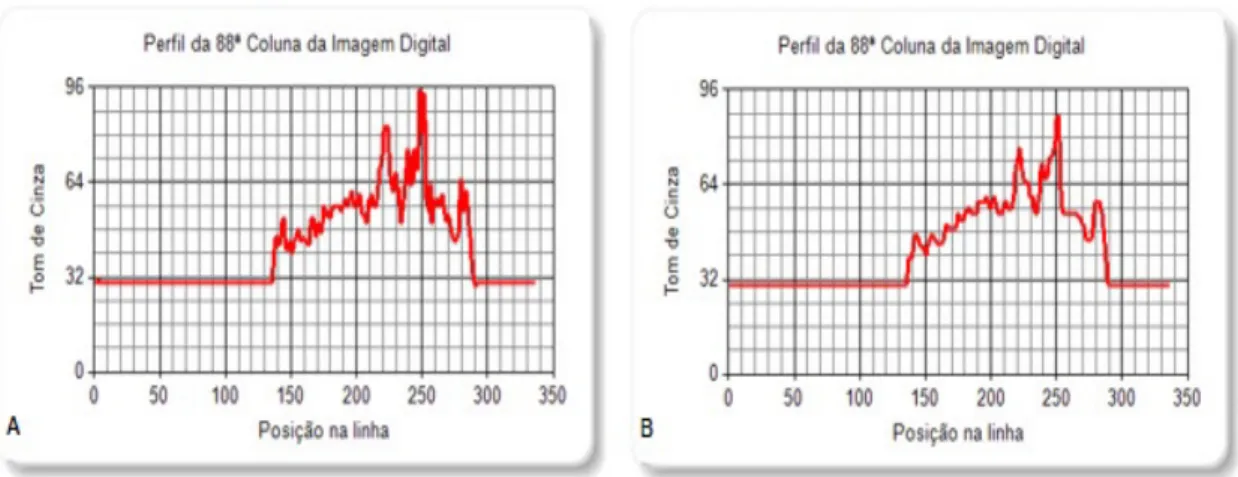
It is possible to observe the noise reduction by analysis of the grayscale images profiles before and after being threated as shown in Figure 6. This profile shows the softening range of the grayscale after noise reduction.
Figure 6: Grayscale image profile untreated (A) and after noise smoothing (B).
3.2. CONTRAST IMPROVEMENT
The main goal of the improvement is to process an image in a manner that the result can be more satisfying than the original image for a specific application [2]. After noise reduction it is possible to show the grayscale graphic using the DIP software.
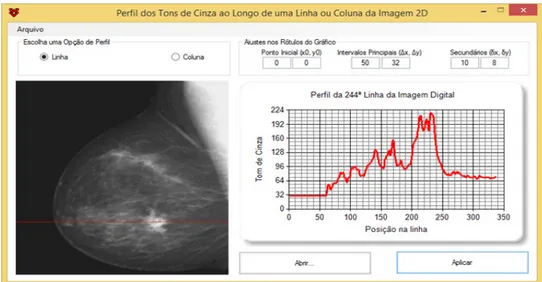
A line was drawn along the image in order to select the tumor region and the distribution of grayscale in different tissues surround the breast is showed in the Figure 7.
Figure 7: Grayscale profile in a 2D image.
Source: SILVA,2014.
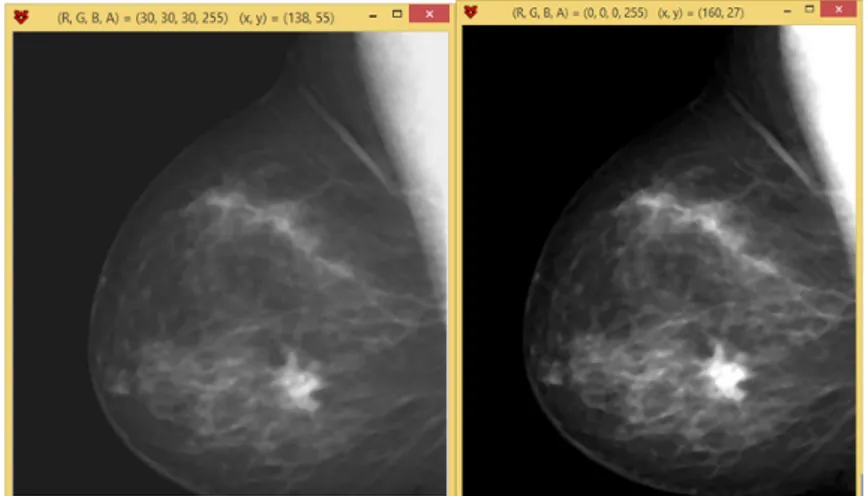
In an 8-bit image, the grayscale levels goes from black (minimum value equal to 0) to white (maximum value, equal to 255). In order to display a high value for all the shades of gray in a range of interest and a low value to other grayscales [2], one range will be reduced to 0 and the other one will be increased to 255. Figure 8 shows the transformation of grayscale caused by the application of contrast improvement using the tool Three linear functions in PID software.
Figure 8: Mammography before and after contrast improvement.
Source: SILVA,2014.
3.3. SEGMENTATION
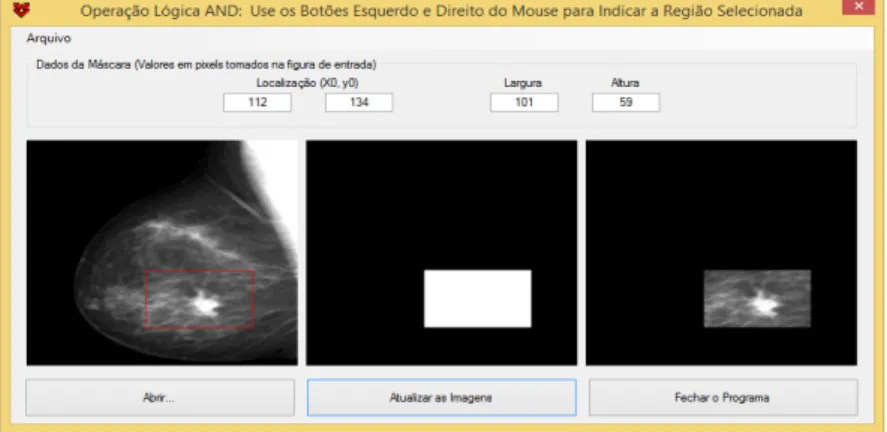
Basically, the segmentation techniques try to subdivide an image in regions based on a specific criteria. [2] The segmentation technique is applied in this mammography because it aims to highlight the region where the tumor is located. This is not a rule for all the kinds of image processing and only should be used for a specific purpose. This technique is made by choosing a threshold gray tone in the image 3. The goal of segmentation is to evidence the breast tumor in the image. Therefore, the gray tone threshold is the maximum gray value found in this region. The first step to make the calculation of percentage of a the soft tissue in a breast lesion occupies the soft tissue, the first step is cutting the image exactly in the region of interest, in this case the tumor. With the use of DIP software, the image can be cropped and remain with the same amount of pixels as the original image, using the logical operation AND in the spatial domain, as shown in Figure 9.
Source: SILVA, 2014.
Therefore, seeing again this grayscale profile is possible to find the threshold gray tone, that is, the number in the grayscale corresponding to the tumor, as can be seeing in the image 10. All dark part of the image is equivalent to zero.
When the column passes over the image, the shades of gray involved are shown in the chart.The peak in the chart exceeds the shade of gray number 225 when the column passes through the tumor; and around the tumor, the peak is not as greater than the number 190.
Figure 10: Shades of gray profile through the tumor.
Thus to make the segmentation, the graph displays that the threshold gray tone is around the number 225. This means that by choosing it value all shades of gray below 225 will be converted to zero and those above 225 are the grayscale that will appear on image.
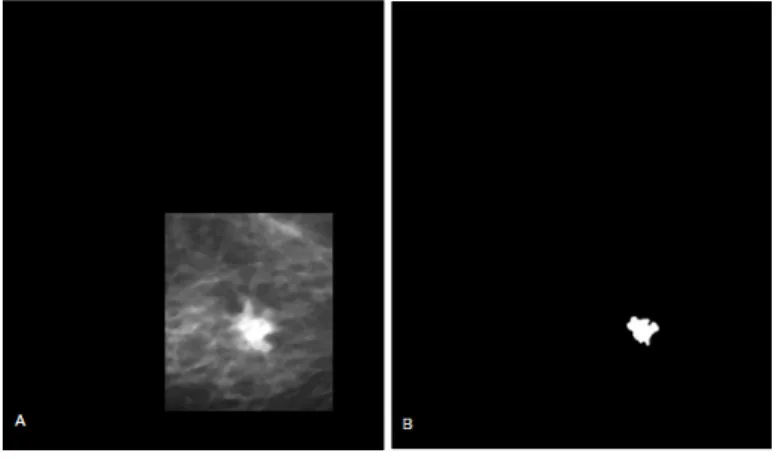
Figure 11: (A) Image cropped using logic operation AND (B) segmented image.
Source: SILVA,2014.
Image 11-B shows only the area corresponding to the tumor and has just two shades of gray. This image has the same dimensions as the original one. The whole region in black color had its gray tone equal to zero, leaving only the isolated area visible, which is the area of interest. Then, it is possible to calculate the percentage of soft tissue that is occupied by the tumor at 2D image by counting the pixels in the images before and after the segmentation.
3.4. RATIO OF SOFT TISSUE TO RADIOLOGICAL FINDING IN PRESENTED MAMMOGRAPHY
PID software does the count of pixels in Figure 8-B, and gives the number 27522. This value represents the total number of pixels in the entire image and here can be present as PT. However,
the goal is to have the sum of the scores not counting the background image, in other words, must be obtained a total of existing pixels only in the image that represents the breast tissue. What is outside is the background image and should not be taken into account to determine the percentage of tumor in mammography.
The image data are saved in a file called Ids.dat. When you open this file, you can find the amount of pixels that correspond to zero, as shown in image 12:
Figure 12: Pixels number per shade of gray.
Source: SILVA,2014.
The number 99070 is the equivalent the sum of all pixels from the background value and (for the purposes of the methodology) is present as PBG. Once again, Ids.dat file is also generated when
we count the pixels in the segmented image, showing only two lines in just two values of grayscale found:
Figure 13: Pixels number per shade of gray in the segmented image.
Source: SILVA,2014.
The color white corresponds to the maximum gray tone 255. This value is equal to 857 pixels, and here can be present as PTR. It means that 857 shades of gray are just in the tumor region.
divide the number of pixels found in the tumor (PTR )by the number of pixels found in the
original image with no background (PT-PBG):
. (1)
In this mammography, approximately 0.5% of the soft tissue is being occupied by the tumor.
4.
CONCLUSIONS
This study was done based on a single two-dimensional image, which gives an idea of the area that the tumor occupies on the image. We can get an idea of the volume of two-dimensional images using mammograms of several incidences that provide more information about depth. If there were more breast images of the same patient with different incidences, it would be also possible to calculate the volume occupied by the tumor in the breast of the patient, because these additional incidences together can provide information about depth. This technique can be extrapolated to obtain volumes of tumors.
These volumes will be inserted in normal phantoms to develop pathological phantoms. This work demonstrates that clinics and small hospitals can have benefit from post-processing techniques of digital images with a low investment; thereby, it is possible to add the benefits of technology ally to the detection of any abnormal findings in mammogram.
5.
ACKNOWLEDGMENTS
Nucleares do Nordeste (CRCN-NE) and the Coordenação de Aperfeiçoamento de Pessoal de Nível Superior (CAPES) for the financial support.
REFERENCES
1. J. W. Vieira, F. R. A. Lima, A. M. Santos, V. L. Neto, V. J. M. Lima, “DIP – Um Software Para Processamento de Imagens Digitais,” II CONNEPI, João Pessoa - PB, (2007).
2. R. C. Gonzalez, R. E. Woods, Digital Image Processing, Prentice – Hall, Upper Saddle River- USA, (2008).
3. “Filtro de Mediana,” http://www.imagesurvey.com.br/2010/03/filtro-de-mediana/(2010). 4. SILVA, M. M. A. ; Vieira, J. W. ; SANTOS, L. A. P. ; SALES, D. O. ; LIMA, F. R. A. ;
MONTEIRO, I. R. . IMPROVEMENT AND STORAGE OF CONVENTIONAL
MAMMOGRAPHY IMAGES USING TECHNIQUES OF DIGITAL IMAGE
PROCESSING. In: Internacional Joint Conference RADIO 2014, 2014, Gramado-RS. Internacional Joint Conference RADIO2014, 2014.