Food Science and Technology
DOI:
D httpsI://doi.org/10.1590/fst.27517
OSSN 0101-2061 (Print) OSSN 1678-457X (Dnline)
1 Introduction
Brazil has since 2004 the position of largest exporter of chicken meat and it reached a record of amount production in 2016, according to the Brazilian Association of Animal Protein (Associação Brasileira de Proteina Animal, 2016). With the increase in the production of meat and processed products, many byproducts are also generated, such as viscera, head and feet, for example, which are mostly underused for the production of animal feed. However, such byproducts contain proteins, such as collagen, that can be utilized in the food industry. With low production costs, chicken feet can be manipulated to get collagen.
Collagen is an abundant protein in mammals, and can be found in various products of animal origin, such as bird feet (Alves & Prudencio-Ferreira, 2002; Nomura et al., 1996; Liu et al, 2001; Lin & Liu, 2006a); fish scales, mammalian skin and tendons (Huang & Nimni, 1993). Type O collagen is the most abundant in the skin, tendons, ligaments and bones, which represents 90% of the dry matter (Dlivo & Shimokomaki, 2002). On chicken feet, some studies have shown the prevalence of this type of collagen in extracts obtained (Lin & Liu, 2006a; Liu et al, 2001; Hashim et al, 2014).
For the extraction of collagen, acid and enzymatic hydrolysis methods are the most used, with the extraction experiments with acetic acid and pepsin being the most efficient. Pepsin is necessary to hydrolyze protein in cross-linking sites because the collagen triple helix structure protects of the enzymatic action
(Simões et al., 2014). Enzyme activity can be increased at low pH and temperature close to the human body, but at low temperature it is possible to obtain native collagen (Lin & Liu, 2006b).
On chicken feet there are isolated studies of extraction of collagen, either by cooking (Alves & Prudencio-Ferreira, 2002) or enzymatic methods (Hashim et al., 2014), but with low extraction yield. Thus, the objective of this study was to optimize the process of extraction of collagen in chicken feet, according to acetic acid concentration, pepsin content and hydrolysis time, in relation to yield, and to characterize the collagen isolated with maximum and minimum extraction yields in order to suggest future applications.
2 Materials and methods 2.1 Raw materials and reagents
Feet from broilers slaughtered between the ages of 42 and 47 days were purchased in the local market of João Pessoa/PB, Brazil. Porcine pepsin (EC 3.4.23.1), acrylamide, bis-acrylamide, ammonium persulfate, AAS18 amino acid standard, used in extraction and analysis were purchased from Sigma-Aldrich (St. Louis, MD, USA). The L-hydroxyproline standard was purchased from Merck (Darmstadt, Germany). Dther reagents used in the study were of analytical grade or the highest purity available.
Optimal conditions for obtaining collagen from chicken feet and its characterization
Íris Braz da Silva ARAÚJD1*, Taliana Kênia Alves BEZERRA1, Edilza Silva do NASCOMENTD1,
Carlos Alberto de Almeida GADELHA1, Tatiane SANTO-GADELHA1, Marta Suely MADRUGA1
Received 26 May, 2017 Accepted 06 Jan., 2018
1 Universidade Federal da Paraíba – UFPB, João Pessoa, PB, Brasil *Corresponding authorI: iris.bsaraujo@gmail.com
Abstract
The objective of this study was to extract collagen from chicken feet, determining optimal extraction conditions according to acetic acid concentration, pepsin content and time of enzymatic hydrolysis. A factorial design 23 was used, with three replications
at the central point, totaling 11 experiments. The response variable studied was the collagen content of the isolate obtained. On addition to the optimization, the characterization of the isolates with higher and lower collagen content, in relation to the amino acid profile, electrophoretic profile, peptide hydrophobicity and functional properties, such as water solubility, water retention capacity and emulsifying activity, were carried out. The proposed model was statistically significant, with conditions of higher collagen content of 0.3 mol/L of acetic acid, 0.2% of pepsin and 12 hours of hydrolysis. The collagen isolate under these conditions showed higher iminoacids content, higher sum of peptide areas, higher solubility in water and water retention at 60 °C. The treatment with lower collagen content showed high emulsifying activity. The collagen isolate of the chicken feet presented characteristics makes it suitable for application in the food industry.
Keywords: by-products; chicken meat; collagen; functional properties.
2.2 Optimization of collagen extraction in chicken feet
Onitially, chicken feet were submitted to moisture, ash, protein and hydroxyproline analyzes for quantification of collagen, according to the methodologies proposed by ADAC (Association of Dfficial Analytical Chemists, 2007). Lipid content analysis was performed according to Folch et al. (1957).
Chicken feet deboned were subjected to extraction with acetic acid and pepsin as described by Shimokomaki et al. (1981) and Simões et al. (2014), with modifications. To define the amount of acid, enzyme and hydrolysis time, a factorial design 23 was used, with three replications at the central point, totaling
11 assays (Table 1). The independent variables investigated wereI: acetic acid concentration (x1), pepsin content (x2) and time of enzymatic hydrolysis (x3), the response variable being the collagen content (Y). The empirical model for planning 23 is presented
in Equation 1, where β represents the coefficients of the model.
0 1 1 2 2 3 3 4 1 2 5 1 3 6 2 3
Y=β +βx +β x +βx +βx x +βx x +βx x (1)
The extraction process was started by immersing the chicken feet in acetic acid solution (x1) for 24 h in the ratio of 1I:10 (w/v). The material was then homogenized in ultra turrax (OKA, model T25) for 10 min at 5,000 x g. On the hydrolysis, the pepsin (x2) was added and the hydrolysis time (x3) was established according to the factorial design (Table 1), at 4 °C with continuous agitation. To stop the hydrolysis process, the pH was elevated to 7.5 and centrifuged for 30 min at 10,000 x g at 4 °C. The precipitate was discarded and the supernatant was precipitated with NaCl to a concentration of 3 mol/L and centrifuged at 10,000 x g for 30 minutes at 4 °C. The supernatant was discarded and the precipitate obtained was dialyzed with 0.5 mol/L acetic acid solution for 72 h with daily solution exchange. The dialyzed precipitate was lyophilized and thus the collagen isolate was obtained. On all isolates, the collagen content obtained as the Y response function was determined.
2.3 Statistical analysis
The response function (Y) was used to perform analysis of variance (ANDVA) for the regression. The model of the equation was adjusted to the experimental data to produce the proposed model. The response surface graph and desirability parameters were generated for the response function (Y), the collagen content of the isolates. The performed analyzes, desirability and response surface were performed with STATOSTOCA 8.0 software (StatSoft, 2007). After the analysis of the response surface and the graphical representation of the desirability for the collagen content, the proposed model was validated by performing new tests in the optimal condition in triplicate, with the means of
each treatment. The results were compared with the estimated response (Y) by analysis of variance (ANDVA) and Student’s t-test (p < 0.05).
2.4 Characterization of collagen isolates
The isolates with higher (OCmax) and lower (OCmin) contents of collagen and the chicken feet were submitted to the characterization and determination of functional properties. All analyzes were performed in triplicate. The results were submitted to ANDVA and Tukey test (p < 0.05).
Amino acids profile
The methodology was adapted from White et al. (1986), in which the samples were subjected to acidic hydrolysis with HCl, derivatization, resuspension and injection in a high performance liquid chromatograph (Varian, Waters 2690, California, USA), coupled to a C18 column (POCD-TAG, 3.9 x 150 mm). Ot was used as the mobile phase A sodium acetate buffer (0.0011 g/mL, pH 6.4) and mobile phase B 60% acetonitrile solution. Detection was performed at 254 nm, at 35 °C and flow rate of 1 mL/min. All injections were performed in triplicate. The amino acid contents were expressed as percentage of area.
Electrophoretic profile of collagen isolates
Collagen isolates were analyzed by sodium dodecylsulfate on polyacrylamide gel electrophoresis (SDS-PAGE), according to Laemmli (1970). The concentration of resolution gel was 7.5% and the stacking gel was 4%. The preparation of the samples was performed according to the methodology of Wang et al. (2008), in which the samples were dissolved in 0.1% (w/v) 0.02 M sodium phosphate buffer (pH 7.2) and in the sequence mixed with the sample buffer with β-mercaptoethanol, in the ratio 1I: 1 (v/v). To estimate the molecular weight of the chains, a 12-225 kDa molecular weight marker (GE Healthcare Life Sciences, Piscataway, NJ, USA) was used. The running conditions were 30 mA of current and 125 V. The running time was about 3 hours. At the end of the run the gel was stained with 0.1% G-250 Brilliant Coomassie Blue and then bleached with a solution of distilled water, methanol and acetic acid in the ratio of 8I: 1I: 1 (v/v/v).
Hydrophobicity of peptides
The separation of the peptides from the isolates and chicken feet by hydrophobicity was conducted according to the methodology reported by Bezerra et al. (2016) by a Nova-Pak C18 column (4.6 m x 250 mm, 4 μM particle size, cartridge, Waters, Oreland), connected to a high performance liquid chromatograph (Varian 2690 Waters, CA). The mobile phase consisted of an eluent A (ultrapure water with 1% of trifluoroacetic acid) and an eluent B (acetonitrile with 1% of trifluoroacetic acid). A linear gradient of these eluents was performed for 60 minutes running in a flow rate of 1 mL/min. The first 30 minutes corresponded to the separation of peptides of hydrophilic character, while in the remaining 30 minutes were separated those of a hydrophobic character. Detection was performed at 218 nm.
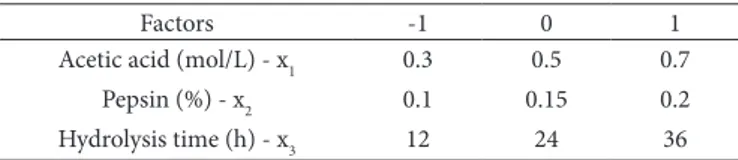
Table 1. Real and coded variables used in factorial design 23 for extraction
of collagen in chicken feet.
Factors -1 0 1
Acetic acid (mol/L) - x1 0.3 0.5 0.7
Pepsin (%) - x2 0.1 0.15 0.2
Functional properties of collagen isolates
The collagen isolates (OCmax and OCmin) were submitted to water solubility (WS) analyzes according to the methodology of Timpl et al. (1975); water holding capacity (WHC) of the collagen isolates at 60 °C, according to the methodology adapted from Montero et al. (1995) and emulsifying activity (EA) according to the methodology of Kim & Park (2005), using Tween 80 as a commercial emulsifier.
3 Results and discussion
3.1 Optimization of collagen extraction
The chicken feet submitted to analysis of chemical composition showed, on a dry basis, ash contentI: 2.33 ± 0.11 g/100g; lipid contentI: 14.96 ± 1.18 g/100g; protein contentI: 77.59 ± 2.05 g/100g; collagen contentI: 56.31 ± 1.98 g/100g. Ot was observed that 72.5% of the proteins of the chicken foot in the form of collagen. The protein content was similar and the ash content was lower than that obtained by Hashim et al. (2014), in ckicken legs, and Liu et al. (2001), in bird feet, probably because the chicken feet of this study were deboned to be submitted to the extraction of collagen. According to the factorial design, it was possible to verify by means of the Pareto graph (Figure 1) that the pepsin content was the factor of major influence on the yield of the obtained isolates, being directly proportional to the amount of enzyme used in the extraction. Ot was observed that the hydrolysis time had an inverse influence on the amount of collagen in the isolates, where at the shortest time the isolates with the highest collagen content were obtained.
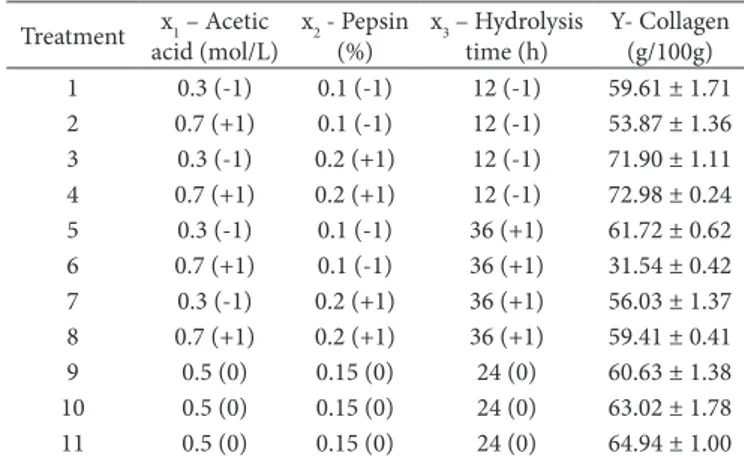
Also were significant (p < 0.05) the interaction effects between acetic acid and pepsin and the inversely proportional effect of acetic acid. Table 2 shows the mean values of collagen content in all the conditions proposed in factorial design 23.
Treatment 4 (0.7 mol/L acetic acid, 0.2% pepsin and 12 hours hydrolysis) presented the highest content of collagen (OCmax), while the treatment 6 (0.7 mol/L acetic acid, 0.1% pepsin and 36 hours hydrolysis) presented a lower collagen content (OCmin).
The pepsin content influenced positively the collagen content, and the treatments with the highest amount of the enzyme had the highest collagen content (treatments 3 and 4). According to Simões et al. (2014), pepsin probably digested the protein’s cross-linking sites because the triple helix structure protects collagen from enzymatic action. Therefore, higher amounts of pepsin imply a higher content of extracted collagen.
On the ANDVA performed for the regression model, it was obtained the value of R2 = 88.21. According to the F test, the
F calculated value was 4.99, being lower than the F tabulated in the study conditions (Ftab = 6.16), indicating that the model was not statistically significant (p <0.05). Considering the result obtained, a new ANDVA was performed, excluding the non-significant effects, according to the Pareto graph (Figure 1), which were the interactions x1x3 and x2x3.
With the new condition for ANDVA, the value of R2 = 82.26
was obtained. According to the F test, the value of F calculated obtained was equal to 6.96, higher than the F tabulated in the new condition (Ftab = 4.53), which indicates to be significant (p < 0.05). Therefore, Equation 2 represents the proposed regression of the reduced model of the coded variables, containing only the statistically significant termsI:
1 2 3 1 2
59.60 – 3.93 6.70 – 6.21 5.04
Y = x + x x + x x (2)
From the Equation 2, the response surface (Figure 2) of the variable collagen content was generated as a function of its dependent variables pepsin content (%) and hydrolysis time (h), which had a greater impact on the response, as seen in the Pareto graph (Figure 1). An optimum favorable region was observed for a higher collagen content (Y close to 80%) when the variable x2 corresponds to 0.2% of pepsin and x3 corresponds to the 12 hours of hydrolysis.
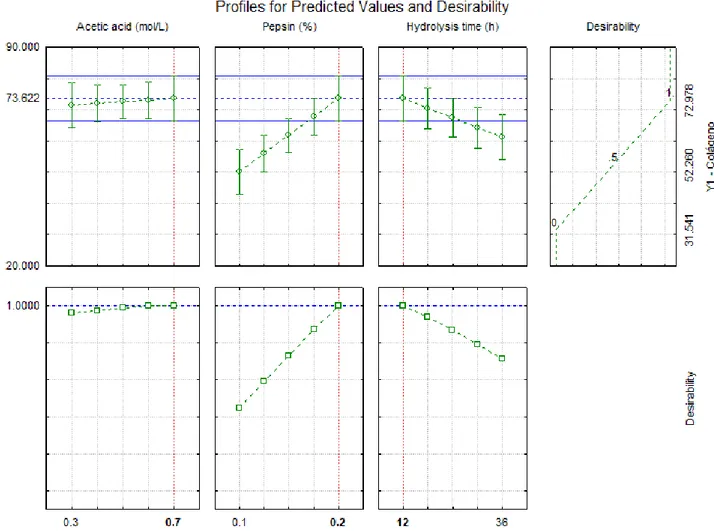
On the desirability function shown in Figure 3, the estimated parameters indicated that the optimum value of Y was 73.62 g collagen/100 g sample, obtained with 0.7 mol/L acetic acid, 0.2% pepsin and 12 hours of hydrolysis time. The optimization value of desirability was 1.0, considered perfectly satisfactory, according to Akhanazarova & Kafarov (1982).
Figure 1. Pareto graph of the response variable collagen content (Y).
Table 2. Levels and results of the response variable of factorial design 23 for collagen extraction from chicken feet.
Treatment x1 – Acetic
acid (mol/L)
x2 - Pepsin (%)
x3 – Hydrolysis time (h)
The estimated desirability for the model under study (Figure 2) shows that increased pepsin concentration and shorter hydrolysis time resulted in higher collagen contents. Regarding the acetic acid
concentration, it was observed between 0.5 and 0.7 mol/L there were no significant changes in the response function. Therefore, the level of 0.5 mol/L would be sufficient to obtain an isolate with a higher collagen content. The conditions presented as optimal in Figure 3 are similar to treatment 4, which presented higher collagen content compared to the other treatments (Table 1).
On a study of collagen extraction from egg shell Mohammadi et al. (2016) observed the dependence of the collagen content with the amount of enzyme, but because it was not the effect of greater influence must be considered so that there is no increase in the costs of production. Simões et al. (2014) observed a great influence of the pepsin concentration, optimizing the extraction process in pig tunica albuginea, reaching a collagen content of 75.8 g of collagen/100 g of isolate.
3.2 Validation of the model
According to the conditions obtained from the desirability for the extraction of collagen, it was estimated from Equation 2 that from the variables x1 = 0.7 mol/L, x2 = 0.2% pepsin and x3 = 12 hours hydrolysis an isolated of collagen with 73.62 g of collagen/100 g would be obtained. Under these conditions, three extractions were reproduced and the mean response obtained was 74.98 ± 0.73 g of collagen/100 g of isolate, which did not differ
Figure 3. Profile of predicted values and desirability for the collagen content extracted from chicken feet.
significantly from the value obtained by the model (p < 0.05), which conferred the validation of the proposed model.
3.3 Characterization of collagen isolates
Amino acids profile
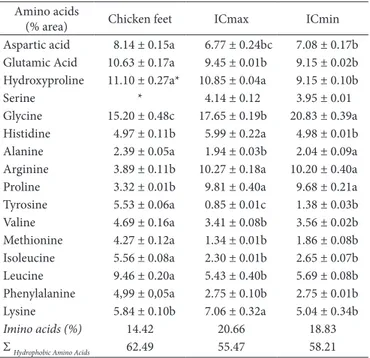
Regarding the content of imino acids (proline and hydroxyproline), which according to Kittiphattanabawon et al. (2010) and Chen et al. (2016) who relate to the thermal stability and formation of binding sites by means of hydrogen bonds in the collagen molecule, it was verified that the OCmax (Table 3) had a higher content (20.66%), since it contains higher levels of the two amino acids. This value was close to that found by Ran
& Wang (2014) in bovine skin and tendons, and by Chen et al. (2016) in skin and tilapia scales.
The hydroxyproline content increased with the extraction of collagen compared to the chicken feet. OCmax, with higher percentage of the amino acid, presented higher value than those obtained by Hashim et al. (2014), in a study of collagen isolation in chicken feet. According to Dkuyama et al. (2012) and Ferraro et al. (2016), hydroxyproline, as well as proline, has rings that force the chain to form a helix due to steric hindrance, and that hydroxyproline is the main responsible for the hydrogen bonds. Regarding the percentage of tyrosine, it was observed that the extraction of collagen decreased the concentration of the amino acid. The low values are in agreement with collagen molecules extracted from other sources (Zhang et al., 2007). Among the collagen isolates obtained, OCmin presented a higher content. According to Nomura et al. (1996), Bailey & Shimokomaki (1971) and Gómez-Guillén et al. (2011), the presence of this amino acid is related to telopeptides that remained after the enzymatic hydrolysis, which are related to the cross-linked sites in the collagen structure, making it less soluble in water.
Electrophoretic profile and peptide hydrophobicity analysis
Figure 4a shows the electrophoretic profile of the collagen isolates obtained from chicken feet. All treatments presented the same distribution, with a β chain and two distinct α chains (α1 and α2), indicating the predominance of type O collagen (Chen et al., 2016; Hashim et al., 2014). The electrophoretic positions of the α1 and α2 chains are close to the marker band with a molecular weight of 150 kDa. This molecular weight is similar to the profile obtained by Lin & Liu (2006a) in brid feet.
Regarding the chromatograms and areas (Figure 4b and 4c) it was observed that the chicken foot contains more peaks than the isolated ones, because the process of extraction of collagen probably succeeded in isolating some specific peptides. According to Bezerra et al. (2016) peptides that are eluted between 0 and 30 min are predominantly hydrophilic in nature and from 30 to 60 min most peptides tend to be hydrophobic in nature. Thus, the peptides generated in the probably predominate
Table 3. Amino acid profile of chicken feet and isolates obtained with higher and lower collagen content.
Amino acids
(% area) Chicken feet OCmax OCmin
Aspartic acid 8.14 ± 0.15a 6.77 ± 0.24bc 7.08 ± 0.17b Glutamic Acid 10.63 ± 0.17a 9.45 ± 0.01b 9.15 ± 0.02b Hydroxyproline 11.10 ± 0.27a* 10.85 ± 0.04a 9.15 ± 0.10b
Serine * 4.14 ± 0.12 3.95 ± 0.01
Glycine 15.20 ± 0.48c 17.65 ± 0.19b 20.83 ± 0.39a Histidine 4.97 ± 0.11b 5.99 ± 0.22a 4.98 ± 0.01b Alanine 2.39 ± 0.05a 1.94 ± 0.03b 2.04 ± 0.09a Arginine 3.89 ± 0.11b 10.27 ± 0.18a 10.20 ± 0.40a Proline 3.32 ± 0.01b 9.81 ± 0.40a 9.68 ± 0.21a Tyrosine 5.53 ± 0.06a 0.85 ± 0.01c 1.38 ± 0.03b Valine 4.69 ± 0.16a 3.41 ± 0.08b 3.56 ± 0.02b Methionine 4.27 ± 0.12a 1.34 ± 0.01b 1.86 ± 0.08b Osoleucine 5.56 ± 0.08a 2.30 ± 0.01b 2.65 ± 0.07b Leucine 9.46 ± 0.20a 5.43 ± 0.40b 5.69 ± 0.08b Phenylalanine 4,99 ± 0,05a 2.75 ± 0.10b 2.75 ± 0.01b Lysine 5.84 ± 0.10b 7.06 ± 0.32a 5.04 ± 0.34b
Imino acids (%) 14.42 20.66 18.83
Σ Hydrophobic Amino Acids 62.49 55.47 58.21
*Co-elution of Hydroxyproline+serine.
Associação Brasileira de Proteina Animal – ABPA. (2016). Produção
de carne de frango totaliza 13,146 milhões de toneladas em 2015.
São PauloI: ABPA. Retrieved from httpI://abpa-br.com.br/noticia/ producao-de-carne-de-frango-totaliza-13146-milhoes-de-toneladas-em-2015-1545
Association of Dfficial Analytical Chemists – ADAC. (2007). Official
methods of analysis of association of official analytical chemists (18th
ed.). MarylandI: ADAC.
Bailey, J. A., & Shimokomaki, M. (1971). Age related changes in the reducible cross-links of collagen. FEBS Letters, 16(2), 86-88. httpI:// dx.doi.org/10.1016/0014-5793(71)80338-1. PMidI:11945908. Bailey, J. A., & Light, N. D. (1989). Connective tissue in meat and meat
products. New YorkI: Elsevier Applied Science.
Bezerra, T. K. A., Araujo, A. R. R., Nascimento, E. S., Matos Paz, J. E., Gadelha, C. A., Gadelha, T. S., Pacheco, M. T. B., Egypto Queiroga, R. C. R., Dliveira, M. E. G., & Madruga, M. S. (2016). Proteolysis in goat “coalho” cheese supplemented with probiotic lactic acid bacteria. Food Chemistry, 196, 359-366. httpI://dx.doi.org/10.1016/j. foodchem.2015.09.066. PMidI:26593502.
Chen, J., Li, L., Yi, R., Xu, N., Gao, R., & Hong, B. (2016). Extraction and characterization of acid-soluble collagen from scales and skin of tilapia (Dreochromis niloticus). Lebensmittel-Wissenschaft +
Technologie, 66, 453-459. httpI://dx.doi.org/10.1016/j.lwt.2015.10.070.
Ferraro, V., Anton, M., & Santé-Lhoutellier, V. (2016). The sister’s α-helices of collagen, elastin and keratin recovered from animal by-productsI: Functionality, bioactivity and trends of application.
Trends in Food Science & Technology, 51, 65-75. httpI://dx.doi.
org/10.1016/j.tifs.2016.03.006.
Folch, J., Lees, M., & Stanley, G. H. S. (1957). A simple method for the isolation and purification of total lipides from animal tissues. The
Journal of Biological Chemistry, 226(1), 497-509. PMidI:13428781.
Gómez-Guillén, M. C., Giménez, B., López-Caballero, M. E., & Montero, M. P. (2011). Functional and bioactive properties of collagen and gelatin from alternative sourcesI: A review. Food Hydrocolloids, 25(8), 1813-1827. httpI://dx.doi.org/10.1016/j.foodhyd.2011.02.007. Hashim, P., Ridzwan, M. S. M., & Bakar, J. (2014). Osolation and
characterization of collagen from chicken feet. International Journal
of Biological, Agricultural, Biosystems. Life Science and Engineering.,
8, 231-235.
Huang, L. H., & Nimni, M. E. (1993). Preparation of type O collagen fibrillar matrices and the effect of collagen concentration on fibroblast contraction. Biomedical Engineering-Applications Basis
Communications, 5, 60-71.
Kim, J., & Park, J. (2005). Partially purified collagen from refiner discharge of Pacific whiting surimi processing. Journal of Food Science, 70(8), c511-c516. httpI://dx.doi.org/10.1111/j.1365-2621.2005.tb11510.x. Laemmli, U. K. (1970). Cleavage of structural proteins during assembly
of the head of the bacteriophage T4. Nature, 227(5259), 680-685. httpI://dx.doi.org/10.1038/227680a0. PMidI:5432063.
Lin, Y. K., & Liu, D. C. (2006a). Comparison of physical–chemical properties of type O collagen from different species. Food Chemistry, 99(2), 244-251. httpI://dx.doi.org/10.1016/j.foodchem.2005.06.053. Lin, Y. K., & Liu, D. C. (2006b). Effects of pepsin digestion at different temperatures and times on properties of telopeptide-poor collagen from bird feet. Food Chemistry, 94(4), 621-625. httpI://dx.doi. org/10.1016/j.foodchem.2004.12.007.
Liu, D. C., Lin, Y. K., & Chen, M. T. (2001). Dptimum condition of extracting collagen from chicken feet and its characteristics.
Asian-Australasian Journal of Animal Sciences, 14(11), 1638-1644. httpI://
dx.doi.org/10.5713/ajas.2001.1638.
hydrophobic nature, which justifies by the sum of hydrophobic amino acids in the profile obtained in Table 2.
Functional properties of collagen isolates
The functional properties such as water solubility at 70 °C (WS), water holding capacity at 60 °C (WHC) and emulsifying activity (EA) isolates with higher and lower collagen content are described belowI: the isolate OCmax presented WS of 68.81 ± 1.84%, WHC of 20.15 ± 2.05 g water/g dry residue and EA of 38.25 ± 0.99%. OCmin presented WS of 54.43 ± 1.47%, WHC of 27.70 ± 1.76 g water/g dry residue and EA of 40.21 ± 1.20% . On water solubility at 70 ºC it was observed that OCmax, with higher collagen content, was more soluble than OCmin, which also presented higher tyrosine content, corroborating with Nomura et al. (1996), Bailey & Shimokomaki (1971) and Gómez-Guillén et al. (2011), and may be one of the factors contributing to the lower solubility of collagen in water. The values obtained in this study were higher than those found by Mizuta et al. (1999), in a study of hot water solubility (20-80 °C) of collagen extracted from cephalopod skin tissues. Simões et al. (2014) obtained swine tunica albuginea collagen values of solubility in hot water close to the OCmax.
On the WHC at 60 °C of the collagen isolates it was observed that the isolate with higher collagen content had lower water retention than OCmin. Probably, the longer hydrolysis time (36 h) caused a greater availability to form hydrogen bonds, adding more water molecules. The values obtained in WHC were similar to WHC of bovine skin collagen (Simões et al., 2014). The emulsifying activity of the collagen isolates was close to the activity of Tween 80 (EA = 41.02 ± 0.93%), used as a commercial emulsifier. According to Bailey & Light (1989), the emulsifying power of collagen is associated with the hydrophobic amino acids, which in OCmin presented in high content, as well as also presents EA slightly superior to OCmax. Kim & Park (2005) found higher values of partially purified collagen in solid waste from surimi processing (50.4%).
4 Conclusion
The optimum conditions of extraction that resulted in collagen isolate from chicken leg with the highest yield wereI: 0.7 mol/L acetic acid, 0.2% pepsin and 12 hours enzymatic hydrolysis. The collagen isolate presented higher iminoacid content under these conditions, which made the isolate more thermally stable and able to bind to water molecules by hydrogen bonds. Compared to other sources of collagen extraction, the optimized collagen isolate obtained from chicken feet presented functional characteristics that make it suitable for application in the food industry due to its technological properties, such as high water retention and emulsifying activity for its application.
References
Akhanazarova, S., & Kafarov, V. (1982). Experiment optimization in
chemistry and chemical engineering. MoscowI: Mir Publishers.
Alves, S. G. T., & Prudencio-Ferreira, S. H. (2002). Propriedades funcionais de material colagenoso de pés de frango. Archivos Latinoamericanos
Journal of the Science of Food and Agriculture, 94(3), 585-590. httpI:// dx.doi.org/10.1002/jsfa.6299. PMidI:23832587.
Shimokomaki, M., Duance, V. C., & Bailey, A. J. (1981). Odentification of two further collagenous fractions from articular cartilage. Bioscience
Reports, 1(7), 561-570. httpI://dx.doi.org/10.1007/BF01116305.
PMidI:7295904.
Simões, G. S., Silveira, E. T. F., Dliveira, S. R., Poleze, E., Allison, J. R. D., Oda, E. O., & Shimokomaki, M. (2014). Dptimum conditions for extracting collagen from the tunica albuginea of immunologically castrated pig testes and the functional properties of the isolated collagen. Meat Science, 96(4), 1460-1468. httpI://dx.doi.org/10.1016/j. meatsci.2013.10.038. PMidI:24412738.
StatSoft. (2007). Statistica for Windows Software. v. 8.0. TulsaI: Statsoft Onc. Timpl, R., Glanville, R. W., Nowack, H., Wiedemann, H., Fietzek, P. P., & Kuhn, K. (1975). Osolation, chemical and electron microscopical characterization of neutral-salt-soluble type OOO collagen and procollagen from fetal bovine skin. Hoppe-Seyler’s Zeitschrift für
Physiologische Chemie, 356(11), 1783-1792. httpI://dx.doi.org/10.1515/
bchm2.1975.356.2.1783. PMidI:1107200.
Wang, L., Yang, B., Du, X., Yang, Y., & Liu, J. (2008). Dptimization of conditions for extraction of acid-soluble collagen from grass carp (Ctenopharyngodon idella) by response surface methodology.
Innovative Food Science & Emerging Technologies, 9(4), 604-607.
httpI://dx.doi.org/10.1016/j.ifset.2008.03.001.
White, J. A., Hart, R. J., & Fry, J. C. (1986). An evaluation of the Waters Pico-Tag system for the amino-acid analysis of food materials. The
Journal of Automatic Chemistry, 8(4), 170-177. PMidI:18925132.
Zhang, Y., Liu, W., Li, G., Shi, B., Miao, Y., & Wu, X. (2007). Osolation and partial characterization of pepsin-soluble collagen from the skin of grass carp (Ctenopharyngodon idella). Food Chemistry, 103(3), 906-912. httpI://dx.doi.org/10.1016/j.foodchem.2006.09.053. Kittiphattanabawon, P., Benjakul, S., Visessanguan, W., Kishimura, H.,
& Shahidi, F. (2010). Osolation and characterization of collagen from the skin of brownbanded bamboo shark (Chiloscyllium punctatum).
Food Chemistry, 119(4), 1519-1526. httpI://dx.doi.org/10.1016/j.
foodchem.2009.09.037.
Mizuta, S., Yamada, Y., Miyagi, T., & Yoshinaka, R. (1999). Histological Changes in Collagen Related to Textural Development of Prawn Meat During Heat Processing. Journal of Food Science, 64(6), 991-995. httpI://dx.doi.org/10.1111/j.1365-2621.1999.tb12266.x.
Mohammadi, R., Mohammadifar, M. A., Mortazavian, A. M., Rouhi, M., Ghasemi, J. B., & Delshadian, Z. (2016). Extraction optimization of pepsin-soluble collagen from eggshell membrane by response surface methodology (RSM). Food Chemistry, 190, 186-193. httpI://dx.doi. org/10.1016/j.foodchem.2015.05.073. PMidI:26212959.
Montero, P., Alvarez, C., Marti, M. A., & Borderias, A. J. (1995). Plaice skin collagen extraction and functional properties. Journal of Food
Science, 60(1), 1-3. httpI://dx.doi.org/10.1111/j.1365-2621.1995.
tb05593.x.
Nomura, Y., Sakai, H., Oshii, Y., & Shirai, K. (1996). Preparation and some properties of type O collagen from fish scales. Bioscience,
Biotechnology, and Biochemistry, 60(12), 2092-2094. httpI://dx.doi.
org/10.1271/bbb.60.2092. PMidI:8988647.
Dlivo, R., & Shimokomaki, M. (2002). Meat: the search path (2th ed.). Cocal do SulI: Omprint.
Dkuyama, K., Miyama, K., Mizuno, K., & Bachinger, H. P. (2012). Crystal structure of (Gly-Pro-HyP)I: implications for the collagen molecular models. Biopolymers, 97(8), 607-616. httpI://dx.doi.org/10.1002/ bip.22048. PMidI:22605552.