http://dx.doi.org/10.1590/s2175-97902018000217484
Article
*Correspondence: H. Z. Huri. Department of Pharmacy, Faculty of Medicine, University of Malaya, 50603 Kuala Lumpur, Malaysia. Tel: +603 79676659. Fax: +603 7967 4964. E-mail: hasnizazh@um.edu.my
Association of glycemic control with progression of diabetic
retinopathy in type 2 diabetes mellitus patients in Malaysia
Hasniza Zaman Huri
1,2*, Chua Chew Huey
1, Norasyikin Mustafa
3, Nor Fadhilah Mohamad
4,
Tengku Ain Kamalden
41Department of Pharmacy, Faculty of Medicine, University of Malaya, Kuala Lumpur, Malaysia, 2Clinical Investigation Centre, University Malaya Medical Centre, Lembah Pantai Kuala Lumpur, 3Department of Ophthalmology, UiTM, UiTM Sungai Buloh Campus, Jalan Hospital, Sungai Buloh, Selangor Darul Ehsan, 4University of Malaya Eye Research Centre,
Department of Ophthalmology, Faculty of Medicine, University of Malaya, Kuala Lumpur, Malaysia
The risk of having microvascular complication is high among Type 2 Diabetes Mellitus (T2DM) patients. However, factors associated with the glycemic control and progression of diabetic retinopathy (DR) in T2DM patients is limited. This study aims to determine association between anti-diabetic agents, glycemic control and progression of diabetic retinopathy in a Malaysian population. A retrospective study conducted in a tertiary teaching hospital in Malaysia, from January 2009 until March 2014.This study enrolled 104 patients aged 40-84 years, with a mean age 63.12 ± 9.18 years. patients had non-proliferative diabetic retinopathy (NPDR, 77%) and 35% had proliferative diabetic retinopathy (PDR). Diabetic macula edema (DME) was present in 20% of NPDR patients, compared with 7% in PDR. Alpha-glucosidase inhibitor (p=0.012), age (p=0.014) and number of antidiabetic agents used (p=0.015) were significantly associated with stages of diabetic retinopathy. Family history of T2DM (p=0.039) was associated with DME. Identifying factors influencing the progression of diabetic retinopathy may aid in optimizing the therapeutic effects of anti-diabetic agents in T2DM patients.
Keywords: Type 2 Diabetes Mellitus. Anti-diabetic agents. Microvascular complication. Diabetic macula edema. Diabetic retinopathy. Malaysia.
INTRODUCTION
Diabetes mellitus is a chronic disorder that may cause acute or chronic long-term complications if it is not well controlled. One of the most common chronic microvascular complications is diabetic retinopathy (DR) (Priya, SrinivasaRao, Sharma, 2013).Diabetic retinopathy is classified into four stages, which are mild non-proliferative (NPDR), moderate NPDR, severe NPDR, and proliferative diabetic retinopathy (PDR). Most of Type 1 Diabetes Mellitus (T1DM) and Type 2 Diabetes Mellitus (T2DM) patients will develop DR after 20 years (Fong et al., 2004).The Malaysian Diabetes Eye Registry in 2007 reported 37% prevalence of DR in Malaysia (Goh, Ismail, Hussein, 2008; Ministry of Health
Malaysia, 2008). Factors associated with the progression of diabetic retinopathy in T2DM patients includes A1C level, co-morbidities, duration of DM diagnosed, age and gender (Chatziralli et al., 2010). In another study involving Chinese patients with DR and T2DM, positive correlations were found between DR and duration of diabetes, systolic blood pressure (SBP), diastolic blood pressure, glycated hemoglobin, glycated albumin, 24 hurinary albumin excretion, peripheral atherosclerosis (PA), diabetes nephropathy (DN), diabetic peripheral neuropathy and anemia (Bin-Bin et al, 2012).
Good glycemic control is associated in risk reduction in the progression of diabetic retinopathy. A1C is a useful monitoring tool to evaluate the effectiveness of a therapeutic management plan for diabetes patients (Kahlon, Pathak, 2011). Study showed intensive glycemic
control with A1C value <6.5% has significantly (p<0.003)
retinal photocoagulation or vitrectomy (OR 0.86; 95 % CI 0.75-0.98), macular edema (OR 0.65; 95 % CI 0.43-0.99) and progression of retinopathy (OR 0.69; 95 % CI 0.55-0.87) (Zhang et al., 2015). Thus, good glycemic control has proven to retard the progression of diabetic retinopathy in T2DM patients.
Although numerous studies have been found to assess the factors associated to DR in diabetes patients, none have addressed the potential association of the use of antidiabetics on DR progression in T2DM patients. In
short, studies on association between different antidiabetic
agents in T2DM patients with diabetic retinopathy and glycemic control are sparse and limited. Nevertheless, antidiabetic agents such as thiazolidinedione with good glycemic control have been proven to reduce the onset and risk of progression of retinopathy by 31% in a study (Ministry of Health Malaysia, 2008; Tschope et al., 2013). A study by Chung et al. (2016) reported that treatment with DPP4 inhibitors was the independent protective factor against the progression of DR, aside from improving glycemic control. Besides,, the intensive diabetes management of using three or more daily insulin injections or a continuous subcutaneous insulin infusion for minimal to moderate NPDR has shown to reduce the risk of progression by 54% (95% CI 39-66) by three years compare to conventional treatment with one or two injections of insulin (Fong et al., 2004).
The association between glycemic control, antidiabetic agents and severity of diabetic retinopathy has not been well investigated (Stratton et al., 2000). Therefore, the aims of this study are (i) to investigate the association between glycemic control in T2DM patient at different stages of DR, (ii) to investigate the factors that may be associated with glycemic control and DR in T2DM patients.
MATERIAL AND METHODS
Study population and sampling frame
The study population involved was Type 2 Diabetes Mellitus (T2DM) patients with diabetic retinopathy at University of Malaya Medical Center (UMMC). This observational, retrospective study was conducted from 1st January 2009 until 1 April 2014. Based on the calculation of Epi Info Program Version 7.0 (CDC, Clifton Rd. Atlanta, USA), the expected sample size for this study was 97 patients. If, the expected proportion of T2DM patients
with DR was 60% and the confidence limit was 5%. To obtain this sample size, the significant, α, was set as 0.05 and the desired power of the study, 1-β, was 80%.
Study design and procedures
This study was conducted in University of Malaya Medical Centre (UMMC), which is one of the largest teaching hospitals in Malaysia with 1200 beds. This study was conducted in accordance with the Declaration of Helsinki and was approved by the UMMC Medical Ethics Committee (reference number 1031.5). The sample populations, which fulfilled the requirement of E11.0 until E11.8 in International Classification of Disease
Tenth Revision (ICD-10), were identified via Hospital
Information System (HIS). Subsequently, the medical records of patients were retrieved from Medical Records Office based on the inclusion and exclusion criteria. Convenient sampling technique was carried out to select the sample of population.
Inclusion criteria:
(1) Age 18 years and older. (2) T2DM with DR.
(3) Patients that had A1C value.
Exclusion criteria:
(1) T2DM patients with diabetic retinopathy (DR) who were not prescribed with any antidiabetic agents.
A data collection form was used to record patients’ information such as (1) demographics data i.e. age, gender, family history, stages of diabetic retinopathy, (2) history on the use of antidiabetic agents and concurrent medications for chronic illnesses (medications that are being used for more than 6 months) (3) co-morbidities (4) glycemic control (A1C and fasting blood glucose) – taken at least 3 months from the commencement of antidiabetic agents (5) laboratory results such as low density lipoprotein (LDL), triglyceride (TG), total cholesterol (TC), high density lipoprotein (HDL) and serum creatinine levels (Table I).
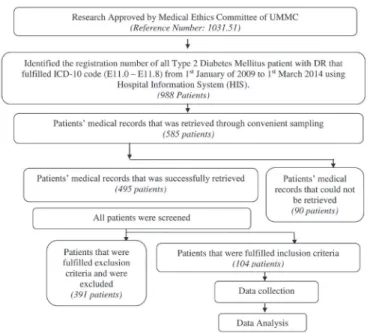
The flowchart of methodology is shown in Figure 1.
Statistical technique
All the data collected were pooled and analyzed using IBM SPSS Statistics Version 22.0 (Armonk, New York, USA). Continuous data were expressed as mean ± standard deviation while categorical data were expressed in term of percentage. Associations between independent categorical variables were examined using Pearson Chi-square test with Continuity Correction or Fisher Exact’s test. The
independent t-test was used to evaluate the different in mean
The normality of data was assessed using the Shapiro-Wilk and Kolmogorov-Smirnov test. The data was normally
distributed if both tests was not significant, p>0.05.
RESULTS
104 T2DM patients with diabetic retinopathy were included in this study (Table II). The mean age of the patients was 63.12 ± 9.18 years, ranging from 40 to 84 years. The data on duration of T2DM was known in 96 patients (92.3%), of which most were longer than 20 years. The median duration of T2DM was in the range of 16-20 years.
Clinical characteristics
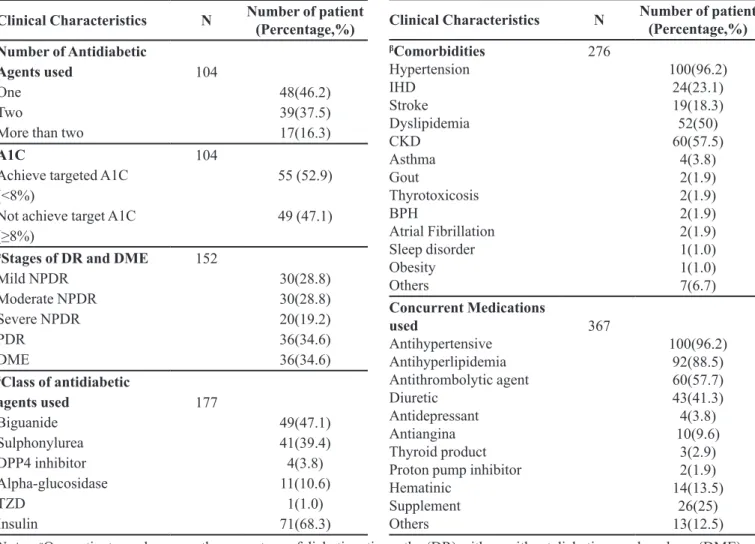
Patients’ clinical characteristics are detailed in Table III. There were only four patients with DME alone while most coexisted with other stages of diabetic retinopathy (DR). The mean of A1C was 8.09 ± 1.78% and Fasting
FIGURE 1 - Overview of methodology.
TABLE I - Definitions used in the study
Terms Definition
Targeted
Glycemic Control
Patients with advanced micovascular complications and extensive comorbid conditions who achieved targeted goal of glycated haemoglobin, HbA1C < 8%.
Comorbidities
Chronic co-existing medical conditions as listed in (Chronic Disease List) and common medical conditions that may present along with the T2DM patients with DR
Diabetic retinopathy, DR
Microvascular complication of diabetes mellitus, which is a progressive disease that will cause blindness and visual disability due to vessel damage at the retina. In this study, the diagnosis of DR was obtained from patient medical record.
Non-proliferative diabetic
retinopathy, NPDR
A less severe stage in DR that shown in fundoscopy of the presence of micro-aneurysms with or without intraretinal
haemorrhages or definite venous beading
or intraretinal microvascular abnormalities (Australian Diabetes Society, 2008)
Proliferative diabetic retinopathy, PDR
A severe stage in DR that shown in fundoscopy the presence of neovascu-larization with or without vitreous and/ or preretinal haemorrhage (Australian Diabetes Society, 2008)
Diabetic Macula Edema, DME
Presence of retinal thickening or hard exudates in posterior pole, near to center or distant from macula (Australian Diabetes Society, 2008)
TABLE II - Demographic characteristics of patient (N=104)
Demographic Characteristics
Number of patient (Percentage %)
Gender
Male 52(50.0)
Age (years)
18-64
>64 56(53.8) 48(46.2)
Ethnicity
Malay Chinese Indian Others
52(50.0) 27(26.0) 24(23.1) 1(1.0)
Duration of T2DM (years)
<1 1-5 6-10 11-15 16-20
>20
Unknown
0(0.0) 4(3.8) 12(11.5) 24(23.1) 23(22.1) 33(31.7) 8(7.7)
Family History of T2DM
Yes No Unknown
21(20.2) 28(26.9) 55(52.9)
BMI*
Underweight(<18.5) Normal (18.5-24.9) Overweight (25-29.9) Obese (≥30)
Unknown
1(1.0) 8(7.7) 8(7.7) 2(1.9) 85(81.7)
Blood Glucose (FBG) was 7.52 ± 4.17 mmol/L. The range of A1C value was 4.8% - 13.4%. Majority of the patients achieved the targeted A1C below 8% (52.9%). Uncommon comorbidities reported were hearing impairment, breast cancer, bipolar disorder, major depressive disorder, erectile dysfunction, and osteoporosis; whereas other concurrent medications listed were ketosteril, alendronate, tacrolimus, mycophenolate sodium, allopurinol and valproic acid.
Profile of antidiabetic agents used in T2DM patients with DR
Class of antidiabetic agents
Figure 2 shows the combination of antidiabetic agents and the common classes of antidiabetic used in the patients.
Insulin preparation and oral antidiabetic agents
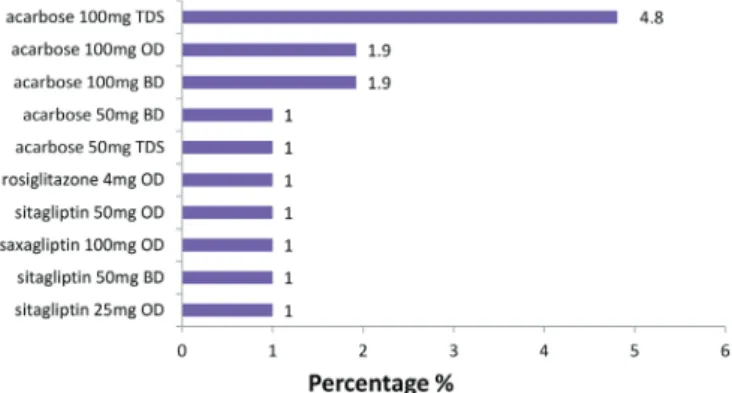
Figure 3-6 illustrated the types of insulin agents used and the dosing agents of antidiabetics.
Association of glycemic control with stages of DR and DME in T2DM patients
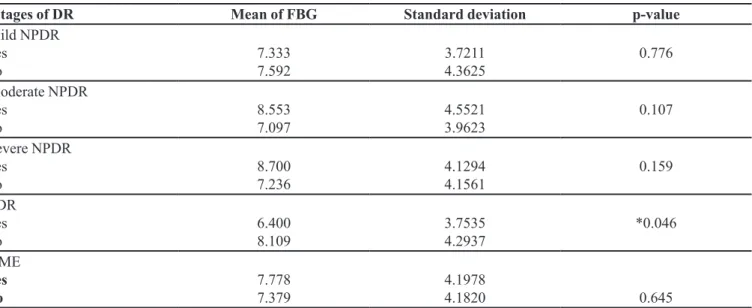
The FBG mean was found to be statistically
significant lower in T2DM patients with PDR (t=2.017,
df=102, p=0.046). On the other hand, the other stages
of DR and DME did not show any significant different
in mean FBG levels (Table IV). Table V showed no
statistically significant association between A1C and the
severity of DR as well as DME.
TABLE III - Clinical characteristic of patient (N=104)
Clinical Characteristics N Number of patient (Percentage,%)
Number of Antidiabetic Agents used
One Two
More than two
104
48(46.2) 39(37.5) 17(16.3)
A1C
Achieve targeted A1C (<8%)
Not achieve target A1C
(≥8%)
104
55 (52.9)
49 (47.1)
αStages of DR and DME
Mild NPDR Moderate NPDR Severe NPDR PDR DME 152 30(28.8) 30(28.8) 20(19.2) 36(34.6) 36(34.6)
βClass of antidiabetic
agents used Biguanide Sulphonylurea DPP4 inhibitor Alpha-glucosidase TZD Insulin 177 49(47.1) 41(39.4) 4(3.8) 11(10.6) 1(1.0) 71(68.3)
Clinical Characteristics N Number of patient (Percentage,%) βComorbidities Hypertension IHD Stroke Dyslipidemia CKD Asthma Gout Thyrotoxicosis BPH Atrial Fibrillation Sleep disorder Obesity Others 276 100(96.2) 24(23.1) 19(18.3) 52(50) 60(57.5) 4(3.8) 2(1.9) 2(1.9) 2(1.9) 2(1.9) 1(1.0) 1(1.0) 7(6.7) Concurrent Medications used Antihypertensive Antihyperlipidemia Antithrombolytic agent Diuretic Antidepressant Antiangina Thyroid product Proton pump inhibitor Hematinic Supplement Others 367 100(96.2) 92(88.5) 60(57.7) 43(41.3) 4(3.8) 10(9.6) 3(2.9) 2(1.9) 14(13.5) 26(25) 13(12.5)
Notes: αOne patient may has more than one stage of diabetic retinopathy (DR) with or without diabetic macular edema (DME), or may have DME alone; βOne patient may has more than one comorbidities and antidiabetic agents.
associated with moderate NPDR, p=0.012.
Association of patients’ demographic and clinical characteristics with glycemic control, stages of DR and DME
Factors Associated with Glycemic Control
Referring to Table VII, ethnicity was statistically
significant associated with glycemic control (χ2 =14.419,
df=3, p=0.002).
Factors associated with stages of DR and DME
Table VIII showed all the demographic and clinical characteristic factors that had statistically significant association with severity of DR and diabetic macular edema. As shown in table 8, there was only one factor associated with each stage of DR and DME. Test
revealed that, age was statistically significant associated
with mild NPDR, (χ2 =6.026, df=1, p=0.014), number
of antidiabetic agents used by patient was statistically
significant associated with moderate NPDR, (χ2 =7.572,
df=2, p=0.023) and lastly family history of T2DM was
FIGURE 2 - Antidiabetic agents used in T2DM patient with DR (N=104); Alpha, alpha glucosidase; BG – biguanide; DPP4, Dipeptidyl peptidase-4 enzyme inhibitors; SU, sulphonylurea. peptidase-4 enzyme inhibitors; TZD, Thiazolidinediones.
FIGURE 6 - Dosing agents for alpha-glucosidase, DPP4 and Thiazolidinediones; BD, twice daily; OD, once daily; TDS, three times daily.
FIGURE 5 - Sulphonylurea dosing agents for T2DM patient with DR; BD, twice daily; OD, once daily; TDS, three times daily.
FIGURE 4 - Biguanide dosing agents for T2DM patient with DR (N=104); BD, twice daily; OD, once daily; TDS, three times daily.
FIGURE 3 - Insulin preparation used for T2DM patient with DR (N=104).
Antidiabetic agents
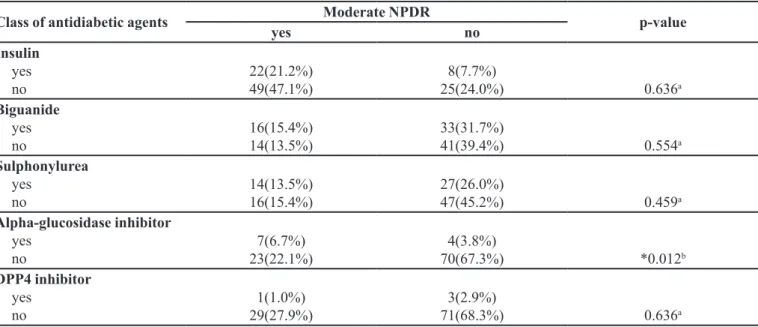
Association of stages of DR and class of antidiabetic agents
significantly associated with diabetic macular edema, (χ2
=6.477, df=2, p=0.039).
DISCUSSION
Association of glycemic control with stages of DR and DME
Poor glycemic control is one of the important risk
factors causing the onset and progression of diabetic retinopathy (DR). Severity of diabetic retinopathy was
found to be significantly associated with A1C levels with
p=0.001 (Chatziralli et al., 2010). A decrease in A1C is associated with a 25% lower risk of DR progression of DR in Type 2 Diabetic Mellitus (T2DM) patient (Mohamed, Gillies, Wong, 2007).A landmark study looking at complications of T2DM (UKPDS) showed that the risk of onset and progression of any stages of diabetic retinopathy
TABLE IV - Association of FBG with severity of diabetic retinopathy (DR) and diabetic macular edema (DME) (N=104)
αStages of DR Mean of FBG Standard deviation p-value
Mild NPDR yes
no
7.333 7.592
3.7211 4.3625
0.776
Moderate NPDR yes
no
8.553 7.097
4.5521 3.9623
0.107
Severe NPDR yes
no
8.700 7.236
4.1294 4.1561
0.159
PDR yes no
6.400 8.109
3.7535 4.2937
*0.046
DME
yes no
7.778 7.379
4.1978
4.1820 0.645
Notes: α One patient may has more than one stage of DR with or without DME, or may have DME alone. Mild NPDR (n=30),
moderate NPDR (n=30), severe NPDR (n=20), PDR (n=36), DME (n=36), *Statistically significant level set at p<0.05.
TABLE V - Association of A1C with severity of diabetic retinopathy (DR) and diabetic macular edema (DME)
βStages of DR A1C % p=value
< 8 ≥ 8
Mild NPDR yes no
18 (17.3%) 37(53.6%)
12(11.5%)
37(35.6%) 0.478a
Moderate NPDR yes
no
13(12.5%) 42(40.4%)
17(16.3%)
32(30.8%) 0.305a
Severe NPDR yes no
7(6.7%) 48(46.2%)
13(12.5%)
36(34.6%) 0.125a
PDR yes no
22(21.2%) 33(31.7%)
36(34.6%)
68(65.4%) 0.309a
DME yes no
19(18.3%) 36(34.6%)
17(16.3%)
32(30.8%) 1.000a
was strongly and significantly associated with glycemic
control of A1C more than 7.5% (Stratton et al., 2001).There is a study which showed that a mean of targeted glycemic
control <8.5% was significantly associated with reduction
of risk of progression in DR (Brinchmann-Hansen et al., 1992),although there was no significantly association between glycemic control, A1C with the severity of DR and DME shown in this study. However, the result of this study shows that, majority of T2DM patients with DR did not achieved targeted glycemic control except for mild NPDR.
Thus, there might be some benefits of good glycemic control
in reducing the risk of onset and progression of DR. The mean fasting blood glucose was lower in the PDR compared to others stages of diabetic retinopathy and DME. This result contradicts a previous study by Teuscher et al which showed that the incidence of PDR was higher in patients with FBG of more than 14.5mmol/L, as well as NPDR (Teuscher, Schnell, Wilson, 1988).Besides that, a study conducted in United Kingdom reported that, mean fasting blood glucose, 8.51mmol/L with intensive therapy that decreased the mean of FBG around 1.2mmol/L was associated with reduction in the progression of DR (Patel
et al., 2008).Fasting blood glucose is different from glycated haemoglobin concentration as it can be varied, affected by diet taken and fasting state before the test done. Therefore, the discrepancy might be because there was variation in the way of data collection. Moreover, the data for study conducted by Teuscher, Schnell and Wilson (1998) and Patel et al. (2008) was based on the baseline
FBG before and after the onset or progression of diabetic retinopathy.
Antidiabetic agents
Association of stages of DR and class of antidiabetic agents
Class of antidiabetic agents alpha-glucosidase
inhibitor, acarbose was significantly associated with the
moderate non-proliferative diabetic retinopathy (NPDR).
Acarbose used was strongly and significantly associated
with presence of moderate NPDR as shown in study. Animal study showed that, acarbose use might lessen
the effect on the development of retinopathy in Zucker
Diabetic Fatty rats (Yang et al., 2000).On the other hand, a study showed, acarbose was associated with positive
effect of postprandial hyperglycemia (Derosa, Maffioli,
2012). Moreover, two cohort studies agreed that, increase in postprandial plasma glucose was associated with increasing risk of progression of diabetic retinopathy (DR) (Mannucci et al., 2012). Therefore, acarbose might possibly indirectly cause reduction in the risk of
progression of DR due to its efficacy proven in reduction
of postprandial plasma glucose. However, the result of
this study was varied from the finding in those studies.
This was probably due to small sample size and the results cannot be generalized as there was only 10.6% of patients took alpha-glucosidase inhibitor antidiabetic agents as combination therapy.
TABLE VI - Association of stages of diabetic retinopathy (DR) with class of antidiabetic agents
Class of antidiabetic agents Moderate NPDR p-value
yes no
Insulin yes no
22(21.2%) 49(47.1%)
8(7.7%)
25(24.0%) 0.636a
Biguanide yes no
16(15.4%) 14(13.5%)
33(31.7%)
41(39.4%) 0.554a
Sulphonylurea yes
no
14(13.5%) 16(15.4%)
27(26.0%)
47(45.2%) 0.459a
Alpha-glucosidase inhibitor yes
no
7(6.7%) 23(22.1%)
4(3.8%)
70(67.3%) *0.012b
DPP4 inhibitor yes
no
1(1.0%) 29(27.9%)
3(2.9%)
71(68.3%) 0.636a
Notes: a Computed using Continuity Correction; b Computed using Fisher’s Exact Test.
Association of demographic and clinical characteristics factors with glycemic control, stages of DR and DME
Factors associated with glycemic control
Ethnicity was the only demographic characteristics
that resulted in significantly associated with the glycemic
control. Moreover, it was found that the Indian ethnic
group was strongly and significantly associated with not
achieved the targeted glycemic control compared with other ethnic groups. This concurs with a study done by Sazlina et al. (2015) that found Malay (OR 1.53, 95% CI 1.41–1.66) and Indian (OR 1.32, 95% CI 1.19–1.46)
ethnicities were predictors of poor glycemic control owing to their greater insulin resistance state (Khoo et al., 2011). Higher state of insulin resistance poses the risk of patients getting chronic complications of T2DM as shown in this study in which all patients had DR. Thus, a more comprehensive approach targeting the lifestyle intervention such as diet and exercise should be focused to achieve a better glycemic control.
Factors associated with stages of diabetic retinopathy and diabetic macular edema
This study found out that, age was the factors
that significantly associated with mild non-proliferative TABLE VII - Association between A1C with demographic and clinical characteristics
Demographic and Clinical Characteristic
A1C %
p-value
<8 ≥8
Age
elderly (>64) non-elderly (18-64)
28(26.9%) 27(26%)
20(19.2%)
29(27.9%) 0.405a
Gender Male
Female
31(29.8%) 24(23.1%)
21(20.2%)
28(26.9%) 0.239a
Ethnicity Malay
Chinese
Indian
Others
24(23.1%) 22(21.2%) 9(8.7%) 0(0.0%)
28(26.9%) 5(4.8%) 15(14.4%)
1(1.0%) *0.002b
BMI
underweight
normal
overweight
obese
unknown
1(1.0%) 3(2.9%) 6(5.8%) 2(1.9%) 43(41.3%)
0(0.0%0 5(4.8%) 2(1.9%) 0(0.0%)
42(40.4%) 0.170b
Duration of T2DM 1-5
6-10
11-15
16-20
>20
1(1.0%) 5(5.2%) 10(10.4%) 12(12.5%) 23(24.0%)
3(3.1%) 7(7.3%) 14(14.6%) 11(11.5%)
10(10.4%) 0.137b
Family History of T2DM yes
no
unknown
10(9.6%) 12(11.5%) 33(31.7%)
11(10.6%) 16(15.4%)
22(21.2%) 0.289c
Number of antidiabetic agents
1
2
>2
31(29.8%) 17(16.3%) 7(6.7%)
17(16.3%) 22(21.2%)
10(9.6%) 0.085c
Notes: a Computed by using Continuity Correction; b Likelihood Ratio; c Pearson Chi-square; *Statistically significant (p<0.05)
DR (NPDR). More specifically, elderly was found to
be strongly significant associated with the presence of mild NPDR. This finding was agreed by an India study
conducted at urban which showed that, the risk of having diabetic retinopathy was significantly associated with group of patients aged more than 50 years compared with aged 30-49, with odd ratio of 7.78, (95% Cl 2.92-20.73) (Dandona et al., 1999). A large study from UKPDS 50 also
suggested that older age was significantly associated with
progression of DR (Stratton et al., 2001). Therefore, the risk of onset of DR in elderly would be high might also due to the long duration since diagnosed Diabetes Mellitus (DM) compared with those with shorter duration of DM (Leske et al., 2005).
The number of antidiabetic agents taken appeared
to be another factor that was significantly associated with
stages of DR, which was moderate non-proliferative Diabetic Retinopathy (NPDR). The finding showed that, more than two antidiabetic agents taken was strongly and
significantly associated with the presence of moderate
NPDR. To date, medication adherence is always the concern for diabetes mellitus patients (Hutchins et al.,
2011). Thus, studies reported that, fixed dose combinations
antidiabetic agents had better medication adherence
and glycemic control compared with co-administered dual therapy of antidiabetic agents (Han et al., 2012). Furthermore, there were no studies that specifically discuss about the number of antidiabetic agents with onset and progression of NPDR. But, the explanation for
the finding in this study might be due to the uncontrolled
glycemic control caused by medication non-compliance. A study showed that, number of antidiabetic agents was significantly associated with glycemic control (Guillausseau, 2005). Then, it might indirectly cause the deterioration of DR. Moreover, there was no data recorded regarding the medication compliance condition for the patients.
Apart from that, family history of T2DM was found
to be significantly associated with diabetic macular edema
(DME). In addition, the presence of family history of T2DM was strongly and significantly associated with the presence of DME. This finding was aligned with a multicenter prospective descriptive study which reported that, there was as high as 86% of study subjects with family history of diabetes mellitus diagnosed with macular pattern dystrophy while only 8% of the patients being diagnosed with diabetic retinopathy (Guillausseau et al., 2001). Therefore, genetic disposition might cause the
TABLE VIII - Factors of demographic and clinical characteristic that significantly associated with stages of diabetic retinopathy (DR) and diabetic macular edema (DME)
Demographic and Clinical Characteristic
βStages of DR and DME
p-value Mild NPDR
yes no
Age Elderly
Non-elderly
20(19.2%) 10(9.6%)
28(26.9%)
46(44.2%) *0.014a
Moderate NPDR
yes no
Number of antidiabetic agents 1
2
>2
12(11.5%) 8(7.7%) 10(9.6%)
36(34.6%) 31(29.8%)
7(6.7%) *0.015c
DME
yes no
Family History of T2DM yes
no
unknown
11(10.6%) 5(4.8%) 20(19.2%)
10(9.6%) 23(22.1%)
35(33.7%) *0.039b
Notes: a Computed by using Continuity Correction; b Pearson Chi Square; c Likelihood Ratio; *Statistically significant (p<0.05); βOne patients may have more than one stages of DR and DME.
development of macular dystrophy. However, the results could not be generalized as there were more than half of the patients who did not have their family history illness recorded.
CONCLUSION
Most of the patients with diabetic retinopathy did not achieved targeted glycemic control, A1C <8% except for mild non-proliferative Diabetic Retinopathy (NPDR).
No significant association was found between glycemic
control and stages of Diabetic retinopathy. Acarbose was found to be associated with moderate NPDR.
Elderly and number of antidiabetic agents taken
were being identified as factors associated with the stages of DR. Identifying factors influencing the progression of
diabetic retinopathy may aid in optimizing the therapeutic
effects of anti-diabetic agents in T2DM patients.
ACKNOWLEDGMENTS
The authors would like to thank the University of Malaya, Malaysia (RP024A-14HTM, RP006B-13HTM
and RP033-14HTM) for financial and technical support.
DISCLOSURE
The author reports no conflicts of interest in this work.
REFERENCES
Bin-Bin H, Li W, Yun-Juan G, Jun-Feng H, Ming L, Yu-Xiang L, et al. Factors associated with diabetic retinopathy in chinese patients with Type 2 Diabetes Mellitus. Int J Endocr. 2012;2012:157940.
Brinchmann-Hansen O, Dahl-Jørgensen K, Sandvik L, Hanssen KF. Blood glucose concentrations and progression of DR: the seven year results of the Oslo study. BMJ. 1992;304(6818):19-22.
Chatziralli IP, Sergentanis TN, Keryttopoulos P, Vatkalis N, Agorastos A, Papazisis L. Risk factors associated with DR in patients with diabetes mellitus type 2. BMC Res Notes. 2010;3(1):1-4.
Chung YR, Park SW, Kim JW, Kim JH, Lee K. Protective
effects of Dipeptidyl Peptidase-4 inhibitors on progression of
diabetic retinopathy in patients with Type 2 Diabetes. Retina. 2016;36(12):2357-2363.
Dandona L, Dandona R, Naduvilath TJ, McCarty CA, Rao GN. Population-based assessment of DR in an urban population in southern India. Br J Ophthalmol. 1999;83(8):937-940.
Derosa G, Maffioli P. Efficacy and safety profile evaluation of
acarbose alone and in association with other antidiabetic agents: a systematic review. Clin Ther. 2012;34(6):1221-1236.
Fong DS, Aiello L, Gardner TW, King GL, Blankenship G, Cavallerano JD, et al. Retinopathy in Diabetes. Diabetes Care. 2004;27(1):s84-s87.
Goh PP, Ismail M, Hussein E. Status of DR among diabetics registered to the Diabetic Eye Registry, National Eye Database, 2007. Med J Malaysia. 2008;63(Suppl C):24-28.
Guillausseau PJ, Massin P, Dubois-LaForgue Dl, Timsit J, Virally M, Gin H, et al. Maternally inherited diabetes and deafness: a multicenter study. Ann Intern Med. 2001;134(9):721-728.
G u i l l a u s s e a u P J . I m p a c t o f c o m p l i a n c e w i t h o r a l antihyperglycemic agents on health outcomes in Type 2 Diabetes Mellitus. Treat Endocrinol. 2005;4(3):167-175.
H a n S , I g l a y K , D a v i e s M J , Z h a n g Q , R a d i c a n L . Glycemic effectiveness and medication adherence with fixed-dose combination or coadministered dual therapy of
antihyperglycemic agents: a meta-analysis. Curr Med Res Opin.
2012;28(6):969-977.
Hutchins V, Zhang B, Fleurence RL, Krishnarajah G, Graham J. A systematic review of adherence, treatment satisfaction and
costs, in fixed-dose combination agents in type 2 diabetes. Curr
Med Res Opin. 2011;27(6):1157-1168.
Kahlon AS, Pathak R. Patterns of glycemic control using glycosylated hemoglobin in diabetics. J Pharm Bioall Sci. 2011;3(3):324-328.
Khoo CM, Sairazi S, Taslim S, Gardner D, Wu Y, Lee J, van
Dam RM, Shyong Tai E. Ethnicity modifies the relationships of insulin resistance, inflammation, and adiponectin with obesity in
a multiethnic Asian population. Diabetes Care. 2011;34(5):1120-6.
Association of glycemic control with progression of diabetic retinopathy in type 2 diabetes mellitus patients in Malaysia
Mannuci E, Monami M, Lamanna C, Adalsteinsson J. Post-prandial glucose and diabetic complications: systematic review of observational studies. Acta Diabetol. 2012;49(4):307-314.
Ministry of Health Malaysia. Clinical Practice guideline: Screening of DR. 2008. Available from: www.moh.gov.my/ attachments/6601.pdf.
Mohamed Q, Gillies MC, Wong TY. Management of diabetic retinopathy a systematic review. JAMA. 2007;298(8):902-916.
Patel A, MacMahon S, Chalmers J, Neal B, Billot L, Woodward M, et al. Intensive blood glucose control and vascular outcomes in patients with type 2 diabetes. N Engl J Med. 2008;358:2560-2572.
Priya PV, SrinivasaRao A, Sharma JVC. DR can lead to complete blindness. 2013. Available from: https://www.researchgate.net/ publication/282609747_Diabetic_Retinopathy_-_Can_Lead_ to_Complete_Blindness.
Sazlina SG, Mastura I, Cheong AT, Bujang Mohamad A, Jamaiyah H, et al. Predictors of poor glycaemic control in older patients with type 2 diabetes mellitus. Singapore Med J. 2015;56(5):284-90.
Stratton IM, Adler AI, Neil HAW, Matthews DR, Manley SE, Cull CA, et al. Association of glycaemia with macrovascular and microvascular complications of type 2 diabetes (UKPDS 35): prospective observational study. BMJ. 2000;321(7258):405-412.
Stratton IM, Kohner EM, Aldington SJ, Turner RC, Holman RR, Manley SE, et al. UKPDS 50: Risk Factors for incidence and progression of retinopathy in Type 2 Diabetes over 6 years from diagnosis. Diabetologia. 2001;44(2):156-163.
Teuscher A, Schnell H, Wilson PW. Incidence of DR and relationship to baseline plasma glucose and blood pressure. Diabetes Care. 1988;11(3):246-251.
Tschope D, Hanefeld M, Meier JJ, Gitt AK, Halle M, Braniage P, Schumm Draeger P. The role of co-morbidity in the selection of antidiabetic pharmacotherapy in type 2 diabetes. Cardiovasc Diabetol. 2013;12(1):62.
Yang YS, Danis RP, Peterson RG, Dolan PL, Wu YQ. Acarbose Partially Inhibits Microvascular Retinopathy in the Zucker Diabetic Fatty Rat (ZDF/GmiTM-fa). J Ocul Pharmacol Ther. 2000;16(5):471-479.
Zhang X, Zhao J, Zhao T, Liu H. Effects of intensive glycemic
control in ocular complications in patients with type 2 diabetes: a meta-analysis of randomized clinical trials. Endocrine. 2015;49(1):78-79.