FOREST FRAGMENTATION AND IMPACTS ON THE BIRD COMMUNITY
1Veridiana Possati Vieira de Matos2, Tatiana Possati Vieira de Matos2, Mauricio Cetra3, Thiago Philipe de Carmargo e Timo4 and Roberta Averna Valente3*
1 Received on 12.12.2016 accepted for publication on 06.08.2018.
2 Universidade Federal de São Carlos, Programa de Pós-Graduação em Diversidade Biológica e Conservação, Sorocaba,SP
- Brasil. E-mail: <veri_gemeas_@hotmail.com> and <tati_gemeas_@hotmail.com>.
3 Universidade Federal de São Carlos, Departamento de Ciências Ambientais, Sorocaba,SP - Brasil. E-mail: <mcetra@ufscar.br>
and <roavalen@ufscar.br>.
4 Universidade Federal de São Carlos, Programa de Pós-Graduação em Ecologia, Sorocaba,SP - Brasil. E-mail: <thiago.timo@gmail.com>.
*Corresponding author.
ABSTRACT – The study aimed at verifying the patterns of bird community related to different land-use/ land-cover. The study area was a Conservation Unit and its buffer area. We used the fixed-point method, visiting 80 points in five times, through one year. The points were plotted in lands agriculture (AGR) and planted forest (FP) and, in areas covered by native forest (NF). The diversity index (H’), abundance (IPA), richness (X²) and categories of species-trophic were calculated, as well as the difference between H’ and X² according to land-use/land-cover was verified by an ANOVA. We also evaluated the taxonomic and functional similarity of the bird community, based in IPA and bird presence/absence. There were significant differences for both X² and H´, comparing NF and FP; NF and AGRP and; AGRP and FP. Concerning the trophic categories, the significant differences were between NF and AGRP and; FP and AGRP, because AGRP is a homogeneous environment with less diversity of resources. Conversely, NF and FP presented similarities as a consequence of the heterogeneity of its structures that subsidize greater avifauna stability than other land-use/land-cover. We conclude that the bird diversity and richness is related to the complexity of the landscape structure. Keywords: Forest Conservation, Connectivity, Birds diversity.
A FRAGMENTAÇÃO FLORESTAL E OS IMPACTOS NA COMUNIDADE DE
AVES
RESUMO – O estudo teve por objetivo verificar os padrões da comunidade de aves associados a diferentes usos e cobertura do solo. A área de estudo foi uma unidade de conservação e faixa de entorno, utilizando-se o método dos pontos fixos para detecção das espécies de aves em 80 pontos visitados cinco vezes, durante o período de um ano. As observações foram realizadas em áreas utilizadas por usos classificados como agricultura (AGR) e floresta plantada (FP) e, também, cobertos por mata nativa (MNA) da região. Calculou-se os índices diversidade (H’), pontual de abundância (IPA), riqueza (X²) e as categorias tróficas das espécies, verificando-se a diferença entre H´e X², em função dos usos e cobertura do solo, por meio de uma ANOVA. A partir dos dados de IPA e presença/ausência de espécies nas categorias tróficas avaliou-se, ainda, a similaridade taxonômica e funcional da comunidade de aves. MNA e FP apresentaram diferenças significativas tanto para X² como para H´, assim como entre MNA e AGRP e, entre AGRP e FP. Já para às categorias tróficas, obteve-se diferenças significativas entre MNA e AGRP e, entre FP e AGRP, em função de AGRP ser um ambiente homogêneo e, assim, com menor diversidade de recursos. Houve, portanto, similaridade entre MNA e FP, como consequência da heterogeneidade de suas estruturas que permite maior estabilidade da avifauna, em relação aos demais usos do solo. Conclui-se que a diversidade e riqueza de espécies de aves está relacionada à complexidade da estrutura da paisagem.
1.INTRODUCTION
The natural forest has been converted into modified landscapes due to the accelerated population growth and increasing demands for agricultural activity and forest products (Laurance et al., 2014). As the main consequences, we have the area reduction of affected habitats with edge increasing and clearings presence (Brummelhaus et al., 2012; Scolozzi and Geneletti, 2012). Characterizing by a high heterogeneity level, the altered landscape presents composition and spatial configuration which are different from their original (Tscharntke et al., 2012; Newbold et al., 2014). In this context, forest patch size, its proximity to others and, therefore, the natural vegetation structure and composition influence into species persistence as well as, in different ways, into biodiversity (Pardini et al., 2010; Vogel et al., 2011).
Related biodiversity depreciation with species, Norris et al. (2010) highlights the problems of fauna movement, while Cushman et al., (2012) the permanence of populations in the landscape.
Thus, the landscape heterogeneity and land use influence in the biodiversity of the agricultural landscapes (Fischer et al., 2011; Chiron et al., 2014). Agricultural plantations can serve as a barrier to the passage and dispersal of fauna (Villard and Haché, 2012) especially, considering that some animal species only cross these areas without using their available resources (Azevedo et al., 2010).
Antongiovanni and Metzger (2005) and Neuschulz et al. (2013) indicated the bird communities in the evaluation of forest patches connectivity, especially in the studies that investigated the matrices influence into species diversity. The birds support the knowledge about fragmentation process scale. According to Vandewalle et al. (2010) because there is a great deal knowledge about bird species biology and ecology, which have already been scientifically cataloged and compiled by forest formation.
The birds also perform functions in the forest systems, highlighting the processes of pollination and dispersion of seeds, i.e. promoting the genetic flow of plant species among forest remnants (Sethi and Howe, 2009; Anderson et al., 2011). This way, they act as connectors of landscape units, influencing the resilience of the forest under anthropic alterations (Lundberg and Moore, 2003).
In this context, the study aimed at verifying the patterns of bird community related to different land-use/land-covers. An agricultural and anthropic landscape, originally covered by Atlantic Forest, was used as the study area, showing several current vegetative types.
2MATERIAL AND METHODS 2.1. Study area
The study area was the Capão Bonito National Forest (CBNF) and its surrounding area (Figure 1), comprising a total area of 74,575 ha, wherein the CBNF represents 4,773.83 ha and the surrounding area comprises 69,790.65 ha. Considering that the CBMF Management Plan is in elaboration because it will be supported by this work among others, we considered a surrounding area of 10 km from the perimeter protected area as a primary study.
This landscape has been studied by several groups of researchers, which consider its relevance for the biodiversity conservation, taking into account its potential for connectivity with other parks. CBNF is approximately 65 km from other relevant to conservation areas as the Intervales State Park, Carlos Botelho State Par and Ecological Station of Angatuba, which are, respectively, in South, Southeast, and Northwest from its limits. Relating to the landscape land-use/land-cover, we produced a map by supervised digital classification (Maximum Likelihood algorithm) of SPOT satellite images (2,5m-spatial; 2009-year), having a global accuracy of 99.14% (Figure 1).
According to this map, the study area is predominantly agricultural, where cultures as corn, soy and wheat crops occupy 40% of its area, mainly out of the NF.
Native forest represents 24.45% of the landscape with remaining of Ombrophilous Dense and Seasonal Semideciduous forest formations. So, the landscape has remnants of the Atlantic Forest biome - already classified by Myers et al., (2000) as one of the five hotspots for preservation.
The planted forest occupies 20.62% of the area, which is distributed into Araucaria (2.85%), Eucalyptus (11.06%), and Pinus (6.71%) plantations. Inside the NF, however, Araucaria and Pinus plantations are predominant.
2.2. Sampling Design
Concerning landscape structure, similar land uses were grouped (relative to bird species diversity and distribution), resulting in the following categorical levels: Native Forests (MNA): native forest vegetation remnants; Planted Forests (FP): areas occupied with pine, eucalyptus and Araucaria planted forests; and Agriculture (AGRP): croplands like corn, soybean and wheat, and pastures.
Trails for bird survey were placed to begin and finish at the same land use level to represent the study
area. For that reason, the landscape was subdivided in four sectors (quadrants) that received the same number of trails (Figure 1).
Sample sufficiency was defined through simulation (in GENPRES software) considering the study area extension and relative densities of bird species with knowledge occurrence obtained from literature (MMA/ ICMBio, 2018). Then, 80 points distributed in 16 trails were obtained, one kilometer of length each, in pairs where each trail was allocated at 500 m from the other. Each single trail had a total of five sample points 250m
Figure 1 – Capão Bonito National Forest (CBNF) and its surrounding location (Sao Paulo state, Brazil) and land-use/land-cover with a division into quadrants, according to previous connectivity level evaluation of forest patches (low, medium-low, medium-high and high).
distant from each other. The number of points at each land use level was 35 at MNA, 27 at FP and 18 at AGRP.
2.3. Bird Survey
Bird species detections were obtained from fixed points (Robbins, 1978), considered by Reynolds et al. (1980) as a method that permits higher uniformity in the study area evaluation.
Monthly surveys took place at the first week every month during a year (December 2013 to December 2014). Data collecting started at the first 30 minutes after sunrise and lasted for about three hours. Observation time length was stipulated to be of ten minutes (Lynch, 1995; Ralph et al., 1995).
2.4. Data Analysis
The bird species survey subsidized the calculation of Point Abundance Index (IPA) for each species, which is obtained from the ratio of number of contacts with a given species and total number of surveyed points (Donatelli et al., 2007; Vielliard et al., 2010).
Detected bird species were assigned to trophic categories as follows: carnivores (CAR), scavengers (DET), fruit-feeders (FRU), seed-feeders (GRA), insectivores (INS), nectar-feeders (NEC), omnivores (ONI) and fish-feeders (PIS) (Motta-Júnior, 1990; Donatelli et al., 2007). Taxonomic nomenclature agrees with the ninth edition of “List of Birds from Brazil” (CBRO, 2014).
Aiming to assess differences among avian community patterns of diversity (H’) and richness (X²) associated to different land-uses/land-cover, an analysis of variance (ANOVA) was performed, followed by a Tukey’s post-hoc test. In order to verify the similarity amongst taxonomic and functional composition at distinct land uses and covers non-metric multidimensional scaling (NMDS) was used, with significance checked by permutational analysis of variance (PERMANOVA) (Legendre and Legendre, 2012).
Point Abundance Indexes (IPA) were evaluated through Bray-Curtis distance (Clarke and Gorley, 2006) for taxonomic component and Jaccard distance for trophic categories, computed as presence-absence matrix (Dorazio et al., 2011).
3.RESULTS
Avian community in the landscape, composed by the Capão Bonito National Forest (CBNF) and its surrounding varied in function of land-use/land-cover.
A total number of 109 species was sighted, distributed in 44 families and 17 orders (Table 1).
Species listed as Near threatened in IUCN are
Eleoscytalopus indigoticus (Wied, 1831)
(White-Breasted Tapaculo), Leptasthenura setaria (Temminck, 1824) (Araucaria Tit-Spinetail) and Hemitriccus orbitatus
(Wied, 1831) (Eye-Ringed Tody-Tyrant). Procnias nudicollis (Vieillot, 1817) (Bare-Throated Bellbird) is listed as Vulnerable. The first three species were detected exclusively in native forest areas, with an IPA value of 0.0057 in MNA, whereas the former species was detected in land uses and covers, with a global IPA of 0.0045 and 0.0743 in MNA, 0.0593 in AGRP and, 0.0333 in FP.
Species with higher IPA were Patagioenas picazuro
(Temminck, 1813) (Picazuro Pigeon) (0.1075), Leptotila
verreauxi (Bonaparte, 1855) (White-Tipped Dove)
(0.0850), Basileuterus culicivorus (Deppe, 1830) (Golden-Crowned Warbler) (0.0850) (Table 1).
Although, not in the same order, same species had higher IPA in MNA when the index was considered separately for each land use and cover. At AGRP, the species with higher global rank, Picazuro Pigeon, did not appear among the highest IPAs, at FP there were three species distinct from those with higher IPA, one of which Zonotrichia capensis, Rufous-Collared Sparrow was common to AGRP.
Therefore, species ranked for MNA were: Leptotila verreauxi (0.2629), Patagioenas picazuro (0.1943) and
Basileuterus culicivorus (0.1200). For AGRP species
there were Basileuterus culicivorus (0.1481), a Leptotila verreauxi (0.0889) e Zonotrichia capensis (0.0741), which were not ranked before and had the higher IPA at FP (0.2), followed by Serpophaga subcristata (Vieillot, 1817) (White-Crested Tyrannulet) (0.1667) and Caracara
plancus (Southern Caracara) (Miller, 1777) (0.1111).
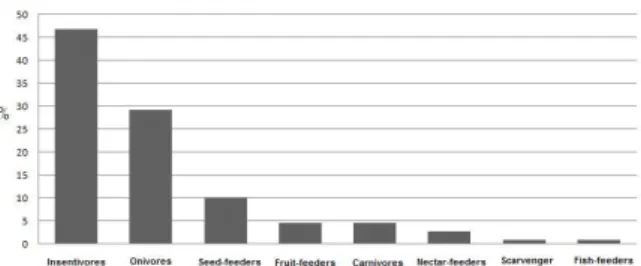
Concerning to the distribution of species in trophic category levels, 86% belonged to one of three main levels: insectivores (47%), omnivores (29%) and seed-feeders (10%) (Figure 2).
Família Espécie CT IPA
Global MNA AGRP FP
TINAMIDAE Rhynchotus rufescens ONI 0,0300 0,0286 0,0074 0,0666
(Temminck, 1815)
Crypturellus obsoletus ONI 0,0025 0 0,0074 0
(Temminck, 1815)
CRACIDAE Penelope superciliaris FRU 0,0050 0,0114 0,0074 0
(Temminck, 1815)
THRESKIORNITHIDAE Theristicus caudatus ONI 0,0050 0 0 0,0333
(Boddaert, 1783)
ARDEIDAE Egretta thula PIS 0,0025 0 0 0,0222
(Molina, 1782)
CATHARTIDAE Coragyps atratus DET 0,0175 0,0343 0,0074 0,0333
(Bechstein, 1793)
ACCIPITRIDAE Elanus leucurus CAR 0,0025 0,0057 0 0
(Vieillot, 1818)
Rupornis magnirostris CAR 0,0150 0,0171 0,0074 0,0333 (Gmelin, 1788)
FALCONIDAE Caracara plancus CAR 0,0225 0,0114 0,0074 0,1111
(Miller, 1777)
Milvago chimachima CAR 0,0300 0,0229 0,037 0,0444 (Vieillot, 1816)
RALLIDAE Aramides saracura ONI 0,0075 0 0 0
(Spix, 1825)
Pardirallus nigricans ONI 0,0050 0 0 0,0222 (Vieillot, 1819)
CARIAMIDAE Cariama cristata INS 0,0175 0,0057 0 0,0777
(Linnaeus, 1766)
CHARADRIIDAE Vanellus chilensis ONI 0,0375 0,0286 0,0074 0,0233
(Molina, 1782)
COLUMBIDAE Columbina talpacoti GRA 0,0150 0,0343 0 0,0222 (Temminck, 1810)
Patagioenas picazuro FRU 0,1075 0,1943 0,2000 0,0155 (Temminck, 1813)
Patagioenas cayennensis GRA 0,0100 0,0171 0 0,0111 (Bonnaterre, 1792)
Zenaida auriculata GRA 0,0500 0,0286 0,0222 0,0266 (Des Murs, 1847)
Leptotila rufaxilla GRA 0,0275 0,0343 0,0296 0,0111 (Richard; Bernard, 1792)
Leptotila verreauxi FRU 0,0850 0,2629 0,0889 0,0222 (Bonaparte, 1855)
PSITTACIDAE Pionus maximiliani FRU 0,0200 0,0171 0,0148 0,0333
(Kuhl, 1820)
CUCULIDAE Tapera naevia INS 0,0075 0,0057 0,0148 0
(Linnaeus, 1766)
Piaya cayana INS 0,0100 0,0114 0,0074 0,0111 (Linnaeus, 1766)
Guira guira INS 0,0025 0 0 0,0111
(Gmelin, 1788)
STRIGIDAE (Molina, 1782)
Athene cunicularia CAR 0,0050 0 0 0,0222
Table 1 – Bird species, trophic categories (CT) and Punctual Index of Abundance (IPA) obtained in CBNF and its surrounding (SP, Brazil).
Table 1 –Espécies de aves, categorias tróficas (CT) e Índice Pontual de Abundância (IPA) obtidos na CBNF e seus arredores (SP, Brasil).
Continue...
TROCHILIDAE Thalurania glaucopis NEC 0,0150 0,0229 0,0148 0 (Gmelin, 1788)
Leucochloris albicollis NEC 0,0125 0,0343 0 0,0111 (Vieillot, 1818)
Amazilia láctea NEC 0,0275 0,0571 0,0222 0,0111 (Lesson, 1832)
RAMPHASTIDAE Ramphastos toco ONI 0,0025 0 0 0,0222
(Statius Muller, 1776)
PICIDAE Picumnus temminckii INS 0,0100 0,0114 0,0074 0,0111
(Lafresnaye, 1845)
Melanerpes candidus INS 0,0075 0,0057 0,0074 0,0111 (Otto, 1796)
Veniliornis spilogaster INS 0,0025 0,0057 0 0 (Wagler, 1827)
Colaptes campestris INS 0,0250 0,0229 0,0074 0,1000 (Vieillot, 1818)
Colaptes melanochloros INS 0,0025 0 0,0074 0 (Gmelin, 1788)
Celeus flavescens INS 0,0075 0,0114 0 0,0111 (Gmelin, 1788)
XENOPIDAE Xenops rutilans INS 0,0025 0,0057 0 0
(Temminck, 1821)
RHINOCRYPTIDAE Eleoscytalopus indigoticus INS 0,0025 0,0057 0 0
(Wied, 1831)
THAMNOPHILIDAE Mackenziaena severa INS 0,0050 0,0114 0 0,0111
(Lichtenstein, 1823)
Dysithamnus mentalis INS 0,0075 0,0114 0,0074 0 (Temminck, 1823)
Thamnophilus caerulescens INS 0,0450 0,1086 0,0296 0 (Vieillot, 1816)
Pyriglena leucoptera INS 0,0175 0,0343 0,0148 0 (Vieillot, 1818)
Drymophila malura INS 0, 0125 0,0114 0,0222 0 (Temminck, 1825)
CONOPOPHAGIDAE Conopophaga lineata INS 0,0050 0,0114 0 0
(Wied, 1831)
SCLERURIDAE Sclerurus scansor INS 0,0025 0,0057 0 0
(Ménétriès, 1835)
DENDROCOLAPTIDAE Sittasomus griseicapillus INS 0,0100 0,0229 0 0
(Vieillot, 1818)
Xiphorhynchus fuscus INS 0,0075 0,0057 0,0074 0,0111 (Vieillot, 1818)
FURNARIIDAE Furnarius rufus INS 0,0125 0,0057 0 0,0444
(Gmelin, 1788)
Automolus leucophthalmus INS 0,0075 0,0171 0 0 (Wied, 1821)
Syndactyla rufosuperciliata INS 0,0025 0,0057 0 0 (Lafresnaye, 1832)
Leptasthenura setaria INS 0,0025 0,0057 0 0 (Temminck, 1824)
Synallaxis ruficapilla INS 0,0050 0,0057 0,0074 0 (Vieillot, 1819)
Synallaxis spixi INS 0,0050 0,0057 0 0,0111
Table 1...
Tabela 1...
Continue...
TYRANNOIDEA Platyrinchus mystaceus INS 0,0050 0,0057 0,0074 0 (Vieillot, 1818)
RYNCHOCYCLIDAE Corythopis delalandi INS 0,0050 0,0114 0 0
(Lesson, 1830)
Tolmomyias sulphurescens INS 0,0125 0,0171 0,0296 0 (Spix, 1825)
Hemitriccus orbitatus INS 0,0025 0,0057 0 0 (Wied, 1831)
Todirostrum poliocephalum INS 0,0050 0,0114 0,0074 0 (Wied, 1831)
Todirostrum cinereum INS 0,0025 0,0057 0 0
(Linnaeus, 1766)
Poecilotriccus plumbeiceps INS 0,0025 0,0057 0 0 (Lafresnaye, 1846)
TYRANNIDAE Myiarchus tyrannulus INS 0,0075 0,0057 0 0,0222
(Statius Muller, 1776)
Camptostoma obsoletum INS 0,0100 0,0343 0 0 (Temminck, 1824)
Elaenia flavogaster ONI 0,0125 0,0286 0 0,0111 (Thunberg, 1822)
Elaenia mesoleuca ONI 0,0075 0,0286 0 0
(Deppe, 1830)
Serpophaga subcristata INS 0,0150 0,0171 0 0,1667 (Vieillot, 1817)
Myiodynastes maculatus ONI 0,0150 0,0400 0,0074 0 (Statius Muller, 1776)
Pitangus sulphuratus INS 0,0375 0,0629 0,0074 0,0778 (Linnaeus, 1766)
Machetornis rixosa ONI 0,0075 0,0171 0 0
(Vieillot, 1819)
Megarynchus pitanguá ONI 0,0075 0,0229 0 0
(Linnaeus, 1766)
Tyrannus melancholicus INS 0,0050 0,0057 0,0222 0 (Vieillot, 1819)
Myiophobus fasciatus INS 0,0050 0,0114 0 0
(Statius Muller, 1776)
Myiarchus swainsoni INS 0,0025 0,0057 0 0
(Cabanis; Heine, 1859)
Lathrotriccus euleri INS 0,0050 0 0,0074 0
(Cabanis, 1868)
VIREONIDAE Cyclarhis gujanensis INS 0,0475 0,0857 0,0593 0,0111
(Gmelin, 1789)
Vireo chivi INS 0,0475 0,1143 0,0444 0,0222 (Vieillot, 1817)
Hylophilus poicilotis INS 0,0050 0,0057 0,0222 0 (Temminck, 1822)
CORVIDAE Cyanocorax cristatellus ONI 0,0025 0 0 0,0111
(Temminck, 1823)
Cyanocorax chrysops ONI 0,0025 0 0 0,0111
(Vieillot, 1818)
Table 1...
Tabela 1...
Continue...
Continua...
(Sclater, 1856)
PIPRIDAE Chiroxiphia caudata ONI 0,0525 0,0857 0,0667 0,0111
(Shaw; Nodder, 1793)
TITYRIDAE Schiffornis virescens ONI 0,0175 0,0229 0,0148 0,0111
(Lafresnaye, 1838)
COTINGIDAE Procnias nudicollis FRU 0,0450 0,0743 0,0593 0,0333
Turdus leucomelas ONI 0,0225 0,0286 0,0370 0,0111 (Vieillot, 1818)
Turdus albicollis ONI 0,0150 0,0229 0,0296 0 (Vieillot, 1818)
MOTACILLIDAE Anthus lutescens INS 0,0075 0 0 0,0333
(Pucheran, 1855)
THRAUPIDAE Coereba flaveola ONI 0,0075 0,0114 0,0074 0
(Linnaeus, 1758)
Tachyphonus coronatus ONI 0,0275 0,0457 0,0222 0,0111 (Vieillot, 1822)
Lanio melanops GRA 0,0025 0 0,0074 0
(Vieillot, 1818)
Tangara sayaca ONI 0,0150 0,0229 0,0148 0 (Linnaeus, 1766)
Tangara cayana ONI 0,0150 0,0171 0 0,0444
(Linnaeus, 1766)
Saltator similis ONI 0,0200 0,0286 0,0370 0 (d’Orbigny; Lafresnaye, 1837)
EMBERIZIDAE Ammodramus humeralis GRA 0,0200 0,0171 0,0074 0,0667
(Bosc, 1792)
Zonotrichia capensis GRA 0,0575 0,0800 0,0741 0,2000 (Statius Muller, 1776)
Sicalis citrina GRA 0,0100 0,0114 0 0,0555 (Pelzeln, 1870)
Sicalis flaveola GRA 0,0025 0 0 0,0111
(Linnaeus, 1766)
Volatinia jacarina GRA 0,0375 0,0400 0,0370 0,1000 (Linnaeus, 1766)
Sporophila caerulescens GRA 0,0075 0 0,0074 0,0222 (Vieillot, 1823)
CARDINALIDAE Habia rubica ONI 0,0050 0,0057 0 0,0222
(Vieillot, 1817)
PARULIDAE Setophaga pitiayumi INS 0,0125 0,0229 0 0,0111
(Vieillot, 1817)
Geothlypis aequinoctialis INS 0,0050 0,0114 0 0 (Gmelin, 1789)
Basileuterus culicivorus INS 0,0850 0,1200 0,1481 0,0222 (Deppe, 1830)
Myiothlypis leucoblephara INS 0,0350 0,1029 0,0222 0 (Vieillot, 1817)
ICTERIDAE Gnorimopsar chopi ONI 0,0025 0 0 0,0111
(Vieillot, 1819)
Pseudoleistes guirahuro ONI 0,0025 0 0 0,0111 (Vieillot, 1819)
Molothrus bonariensis ONI 0,0025 0 0 0,0111 (Gmelin, 1789)
Psarocolius decumanus ONI 0,0050 0,0057 0 0,0111 (Pallas, 1769)
Where: CAR: carnivores; DET: scavenger; FRU: fruit-feeders; GRA: seed-feeders; INS: insectivores; NEC: nectar-feeders; ONI: omnivores e PIS: fish-feeders. MNA: native; AGR: agriculture; PAS: pasture; FPP: Pinus planted forest; FPE: Eucalyptus planted forest e FPA: Araucária planted forest.
TROGLODYTIDAE Troglodytes musculus INS 0,0125 0,0114 0 0,0222
(Naumann, 1823)
TURDIDAE Turdus amaurochalinus ONI 0,0250 0,0286 0,0296 0,0111
(Cabanis, 1850)
Turdus subalaris ONI 0,0025 0,0057 0 0
(Seebohm, 1887)
Turdus rufiventris ONI 0,0275 0,0343 0,0296 0,0222
Table 1...
In contrast with patterns observed for H’ and X², values of IPA at MNA and FP were highly similar (p=0.0124), as for MNA and AGRP (p= 0.0001) and, AGRP and FP (p= 0.0001) (Figure 3A). In opposition, trophic categories were significantly different between MNA and AGRP (p=0.0001) as for AGRP and PF (p= 0.0043) (Figure 3B).
4.DISCUSSION
The agricultural landscape matrix influenced the bird community, with MNA, FP, and AGRP showing species with several IPA values, considering their different ability to provide resources. Therefore, the patterns of bird abundance were influenced by the landscape heterogeneity (Mcgarigal and Cushman, 2002). The MNA, which has the greatest ability to provide resources, presents three species, having intrinsic characteristics and, classified as “Near Threatened” of extinction. They have the forest, especially Atlantic Forest, as the natural habitat. Among them, the Eleoscytalopus indigoticus (White-Breasted Tapaculo) and the Leptasthenura setariave (Araucaria Tit-Spinetail) can also be associated with the Araucaria forest (Sigrist, 2013; Antunes et al., 2013).
The third species (i.e. Procnias nudicollis; Bare-Throated Bellbird) show the highest IPA value for MNA (among the three species), belong to “Vulnerable” category, and has the Atlantic Forest as habitat. Although, we also registered its presence in FP and AGRP, having IPA value higher than the two first species and, occupying the seventh highest IPA value, when we evaluated the three categories together (MNA, FP, and AGRP).
On the other side, the highest IPA value obtained for MNA as well as the FP, and the AGR is related to species with general habits, that adapt to environments with different conditions.
Amongst them, are the Leptotila verreauxi (White-Tipped Dove) and the Basileuterus culicivorus (Golden-Crowned Warbler), which are registered in MNA and AGRP. Normally, the first occurs in open and shrubby areas, preferring the edge of the forests, open forests, and forests surrounded by agriculture (Sigrist, 2013). The second species inhabits several environments, from forest areas, Restinga, to areas suffering from anthropic actions, but its population has been suffering a decline due to the destruction of forest habitats (Sigrist, 2013).
In turn, the Patagioenas picazuro (Picazuro Pigeon) was observed only in MNA. According to Del Hoyo et al., (1997), the species have increased its population due to the expansion of the forest degradation, that provides a favorable environment for this species. Associated with the AGRP and FP, we obtained the Zonotrichia capensis (Rufous-Collared Sparrow), which have been found in several habitats, from forest to pastures, rural, and urban areas. In the case of forest, although, the species prefers the clearings and the edge areas (Class and Moore, 2010; Class et al., 2011). In FP, we highlight the species (Vulnerable; with the highest IPA value) Serpophaga subcristata and
Caracara plancus. The first requires areas with shrub, favoring its presence in several environmental (Vogel et al., 2011). This requirement is in accordance with the study area, where the most part of FP has understory of native species. The same way, the Caracara plancus
can occur in several habitats, from open fields, forest
Figure 2 – Bird species per trophic categories in Capão Bonito National Forest and its surrounding (SP, Brazil).
Figura 2 – Espécies de aves por categorias tróficas e Floresta Nacional de Capão Bonito e seus arredores (SP,
Brasil).
Figure 3 – Similarity among native forest (NF), planted forest (FP) and, agriculture and pasture (AGRP) relates to: (A) the Abundance Index (IPA); and categories of species-trophic, for bird species in Capão Bonito National Forest and its surrounding (SP, Brazil).
edges, savannahs, river banks, to urban areas (Sick, 1997; Antunes et al., 2013).
In this context, landscape patches that have a similar structure, as MNA and FP, present similar species abundance (Figure 3), that are superior to homogeneous patches, as AGR. Therefore, they contribute to increscent of avifauna stability in the landscape (Jiang and Pu, 2009; Downing et al., 2014), supporting better conditions of species surviving and, being adequate places for nesting, resources stabilization, and refugee for environmental stressors (Brown, 2007). Considering the patches structure, MNA and FP also present similarity for their trophic categories, that are dissimilar of AGR (Figure 3B). So, differences in structure, availability of food resources, and land-uses/ land-covers were responsible for the differences, in the species occurrence and trophic categories.
The insectivorous and the omnivorous are the trophic categories present in MNA, which were also predominant at small remains forest (Southeastern São Paulo), wherein frugivores decreased (Willis, 1979). Similarly, Ruiz-Gutierrez et al., (2008) obtained the smaller abundance for frugivores, in landscapes tropical, fragmented, and anthropized. According to Sodhi et al. (2014) because there are not fruits during the year and, because these species present a specialized diet, being more vulnerable to anthropic alterations and food availability (Donatelli et al., 2007).
The insectivorous also were the most representative trophic category in the FP and AGR (Figure 2), which is a characteristic pattern of tropical regions (Telino-Júnior et al., 2005; Donatelli et al., 2007).
Conversely, the carnivorous species showed the lesser representativeness (Figure 2) in the landscape, because they are larger than others, have a population with lower density, have lower survival rate, and need larger area (extension) to survive (Sieving and Karr, 1997). The bird richness and diversity were also influenced by the environment structure and availability of resources, having MNA the greatest richness of species (total of 90). This cover has availability of trees, which usually increases the resources availability (nesting and foraging) and, consequently, increasing the bird wealth and abundance. On the other hand, FP showed richness and abundance values lower than MNA, reflecting a general pattern associated to monoculture plantations, independently of the tree species
(Barlow et al., 2007). Consequently, we observed a significant difference, in terms of bird diversity, between MNA and FP. So, the fragmentation process, that causes land-use/land-cover alterations modify the bird community (in terms of species composition) and alters the trophic categories of habitats. According to Ries et al., (2004) during this process, a habitat as the native forest has the reduction of its quality. The study area species, associated with MNA, have usually searched for other land-uses to resources compensation, characterizing several changes in the bird community.
5.CONCLUSION
In the study area, the forest fragmentation process influences directly the bird community in term of their abundance, richness, and diversity. These three variables are intrinsically related to landscape structure and composition, in terms of land-use/land-cover.
So, the species diversity is related to the land-use/land-cover complexity, which presents the pattern of trophic categories that is typical of tropical and fragmented regions.
In this context, we conclude that the native forest (i.e. MNA category), despite its high level of fragmentation, is the category that preserves greater biodiversity, in terms of species richness and diversity.
6.ACKNOWLEDGEMENTS
We thank the Fundação de Amparo à Pesquisa do Estado de São Paulo/FAPESP for the scholarship (proc. 2013/16303-2) granted to the first author.
7.REFERENCES
Anderson MJ, Crist TO, Chase JM, Vellend M, Inouye BD, Freestone AL, et al. Navigating the multiple meanings of â diversity: a roadmap for the practicing ecologist. Ecology
Letters. 2011;14(1):19-28.
Antongiovanni M, Metzger JP. Influence of matrix habitats on the occurrence of
insectivorous bird species in Amazonian forest fragments. Biological
Conservation. 2005;122:441-51.
Park state of Sao Paulo southeastern Brazil. Biota Neotropica. 2013;13(2):124-40.
Azevedo CS, Ferraz JB, Tinoco H P, Young R J, Rodrigues M. Time–activity budget of greater rheas (Rhea americana, Aves) on a human-disturbed area: the role of habitat, time of the day, season and group size. Acta ethologica. 2010; 13(2): 109-117.
Barlow J, Mestre LA, Gardner TA, Peres CA. The value of primary, secondary and plantation forests for Amazonian birds. Biological Conservation. 2007;136(2):212-31.
Brown BL. Habitat heterogeneity and disturbance influence patterns of community temporal
variability in a small temperate stream. Hydrobiologia. 2007;586(1):93-106.
Brummelhaus J, Weber J, Petry MV. The influence of riparian forest fragmentation on birds in the River Hydrographic Basin, Rio Grande do Sul State. Neotropical Biology and Conservation. 2012;7(1):57-66.
Chiron F, Chargé R, Julliard R, Jiguet F, Muratet A. Pesticide doses, landscape structure and their relative effects on farmland birds. Agriculture, Ecosystems Environment. 2014;185:153-60.
Clarke KR, Gorley RN. Primer v6: user manual/ tutorial. Plymouth: Primer-E; 2006.
Class AM, Moore IT. Is there a trade-off between caring for offspring and territorial aggression in tropical male rufous-collared sparrows
(Zonotrichia capensis)?. Behaviour. 2010;13(147):1819-39.
Class AM, Wada H, Lynn SE, Moore IT. The timing of life-history stages across latitudes in Zonotrichia sparrows. The Condor.
2011;113(2):438-48.
Comitê Brasileiro de Registros Ornitológicos (CBRO). Lista das aves do Brasil. 11ª ed. São Paulo: 2014. [acessado em: maio 2015]. Disponível em: http://www.cbro.org.br/CBRO/listabr.htm.
Cushman SA, Shirk A, Landguth EL. Separating the effects of habitat area, fragmentation and matrix resistance on genetic differentiation in
complex landscapes. Landscape Ecology. 2012;27(3):369-80.
Del Hoyo J, Elliott A, Sargatal J. Handbook of the birds of the world. Sandgrouse to Cuckoos. Barcelona: Lynx Edicions; 1997. v. 4. p.60-243..
Dorazio, SJ, Tsitovich, PB, Siters, K E, Spernyak, JA, Morrow, JR. Iron (II) paraCEST MRI contrast agents. Journal of the American Chemical Society. 2011; 133(36), 14154-14156.
Donatelli RJ, Ferreira CD, Dalbeto AC, Posso SR. Comparative analysis of birds community in two forested fragments in the State of São Paulo, Brazil. Revista Brasileira de Zoologia.
2007;24(2):362-75.
Downing AL, Brown BL, Leibold MA. Multiple diversity-stability mechanisms enhance population and community stability in aquatic food webs. Ecology.2014;95(1):173-84.
Fischer C, Flohre A, Clement LW, Batáry P, Weisser WW, Tscharntke T, et al. Mixed effects of landscape structure and farming practice on bird diversity. Agriculture, Ecosystems Environment. 2011;141(1):119-25.
Jiang L, Pu ZC. Different effects of species diversity on temporal stability in single-trophic and multi-trophic communities. American Naturalist. 2009;174(5):651-9.
Laurance WF, Sayer J, Cassman KG. Agricultural expansion and its impacts on tropical nature. Trends in Ecology Evolution. 2014;29(2):107-16.
Legendre, P, Legendre, L. Complex ecological data sets. In Developments in environmental modelling. 2012; 24: 1-57.
Lundberg J, Moberg F. Mobile link organism and ecosystem functioning - implications for
ecosystem resilience and management. Ecosystems. 2003;6(1):87-98.
Lynch JF. Effects of point count duration, time-of-day, and aural stimuli on detectability of
migratory and resident bird species in Quintana Roo, Mexico, 1995.
evaluation of experimental approaches to the study of habitat fragmentation effects. Ecological Applications. 2002;12(2):335-45.
Myers N, Mittermeier R A, Mittermeier CG, Da Fonseca G A, Kent J. Biodiversity hotspots for conservation priorities. Nature. 2000; 403(6772): 853.
Motta-Júnior JC. Estrutura trófica e composição das avifaunas de três habitas terrestres na região central do Estado de São Paulo. Ararajuba. 1990;1:65-71.
MMA/ICMBio. Plano de manejo da Floresta Nacional de Capão Bonito.2018. Disponivel em: <http:// www.icmbio.gov.br/portal/unidadesdeconservacao/ biomas-brasileiros/cerrado/unidades-de-conservacao-cerrado/2074-flona-de-capao-bonito>. Acesso em 25 de abril de 2018.
Neuschulz EL, Brown M, Farwig N. Frequent bird movements across a highly fragmented landscape: the role of species traits and forest matrix. Animal Conservation. 2013;16(2):170-9.
Newbold T, Hudson LN, Phillips HR, Hill SL, Contu S, Lysenko I, et al. A global model of the response of tropical and sub-tropical forest biodiversity to anthropogenic
pressures. Proceedings of the Royal Society of London B: Biological
Sciences. 2014;281(1792):1371.
Norris K, Asase A, Collen B, Gockowksi J, Mason J, Phalan B, et al. Biodiversity in a
forest-agriculture mosaic–The changing face of West African rainforests. Biological Conservation. 2010;143(10):2341-50.
Pardini R, Bueno AA, Gardner TA, Prado PI, Metzger JP. Beyond the fragmentation threshold hypothesis: regime shifts in biodiversity across fragmented landscapes. PLoS One.
2010;5(10):e13666
Ralph CJ, Droege S, Sauer J. Managing and monitoring birds using points counts: Standards and applications. In: Ralph CJ, Sauer JR.
Monitoring bird populations by point counts. Albany, CA: U.S. Department of Agriculture, Forest Service, Pacific Southwest Research Station; 1995. p.161-8. (General Technical Report, PSW-GTR-149.)
Reynolds RT, Scott JM, Nussbaum RA. A variable circular-plot method for estimating bird numbers. The Condor. 1980;82:309-13.
Ries L, Fletcher Jr RJ, Battin J, Sisk TD. Ecological responses to habitat edges: mechanisms, models, and variability
explained. Annual Review of Ecology, Evolution, and Systematics. 2004:491-522.
Robbins CS. Census techniques for forest birds. In: Anais of the 14th.Workshop Management of Southern Forests for Nongame Birds. Atlanta: 1978. Atlanta: Forest Service; 1978. p.142-63.
Ruiz-Gutierrez V, Gavin TA, Dhondt AA. Habitat fragmentation lowers survival of a tropical forest bird. Ecological Applications. 2008;18(4):838-46.
Scolozzi R, Geneletti D. A multi-scale qualitative approach to assess the impact of urbanization on natural habitats and their connectivity. Environmental Impact Assessment Review. 2012;36:9-22.
Sethi P, Howe HF. Recruitment of hornbill-dispersed trees in hunted and logged forest of the Indian Eastern Himalaya. Conservation Biology. 2009;23(3):710-18.
Sick H. Ornitologia brasileira. Rio de Janeiro: Nova Fronteira; 1997. 912p
Sieving KE, Karr JR. Avian extinction and persistence mechanisms in lowland Panama. In: Laurance WF, Bierregaard RO. Tropical forest remnants. Chicago: University of Chicago Press; 1997. p.156-70.
Sigrist T. Guia de campo Avis Brasilis - Avifauna Brasileira. São Paulo: Avis Brasilis; 2013. 592p.
Sodhi NS, Koh LP, Brook BW, Ng PK. Southeast Asian biodiversity: an impending disaster. Trends in Ecology Evolution. 2004;19(12):654-60.
Telino-Júnior WR, Dias MM, Azevedo Júnior SMD, Lyra-Neves RMD, Larrazábal ME. Estrutura trófica da avifauna na Reserva Estadual de Gurjaú, Zona da Mata Sul, Pernambuco, Brasil. Revista Brasileira de Zoologia. 2005;22(4):962-73.
security, biodiversity conservation and the future of agricultural intensification. Biological
Conservation. 2012;151(1):53-9.
Vandewalle M, De Bello F, Berg MP, Bolger T, Dolédec S, Dubs F, Da Silva PM. Functional traits as indicators of biodiversity response to land use changes across ecosystems and
organisms. Biodiversity and Conservation. 2010;19(10):2921-47.
Vielliard J M E, Almeida M D C, Anjos L, Silva W R. Levantamento quantitativo por pontos de escuta e o Índice Pontual de Abundância (IPA). Ornitologia e Conservação: Ciência Aplicada, Técnicas de Pesquisa e
Levantamento; Rio de Janeiro: Technical Books; 2010.P. 47-60.
Villard MA, Haché S. Conifer plantations consistently act as barriers to movement in a deciduous forest songbird: a translocation experiment. Biological Conservation. 2012;155:33-7.
Vogel HF, Zawadzki CH, Metri R. Partilha
ecológica entre Turdus leucomelas Vieillot, 1818 e Turdus rufiventris Vieillot, 1818 (Aves:
Passeriformes) em um fragmento urbano de floresta com araucárias, sul do Brasil. Biota Neotropical. 2011;11(3):35-45.