Printed version ISSN 0001-3765 / Online version ISSN 1678-2690 http://dx.doi.org/10.1590/0001-3765201720160048
www.scielo.br/aabc | www.fb.com/aabcjournal
Avian Communities in the Amazonian Cangas Vegetation: Biogeographic
Affinities, Components of Beta-Diversity and Conservation
SÉRGIO H. BORGES1,*, MARCOS P.D. SANTOS2, LEONARDO M.S. SOARES3and ANTONITA S. DA SILVA3
1
Instituto Nacional de Pesquisas da Amazônia/INPA, Av. André Araújo, 2936, 69060-001 Manaus, AM, Brazil 2
Universidade Federal do Pará, Laboratório de Ecologia e Zoologia de Vertebrados, Av. Augusto Correia, 1, 66075-110 Belém, PA, Brazil
3
Departamento de Zoologia, Museu Paraense Emílio Goeldi, Av. Perimetral, 1901, 66077-530 Belém, PA, Brazil
Manuscript received on February 4, 2016; accepted for publication on August 4, 2016
ABSTRACT
The Amazonian cangas is a vegetation type distributed as patches of open vegetation embedded in a matrix of tropical forest and that grows over iron-rich soils in the Serra dos Carajás region. To characterize cangas avifauna, we surveyed birds in eight patches varying from 43 to 1,366 hectares. Cangas avifauna has compositional affinities with savannas widespread throughout the Amazon and other biomes, and we estimate that more than 200 bird species occurs in this habitat. Species composition was relatively homogeneous, and the similarity among cangas patches was the dominant component of the beta-diversity. Bird communities in cangas patches exhibited statistically significant nested structure in respect to species richness and patch size. In contrast, the nested site arrangement was not affected by the isolation of patches. Number of species and composition are moderately affected by the area of cangas patches but not by its degree of isolation. To conserve this unique habitat are necessary a strict protection of carefully chosen patches of cangas and an investigation of the conservation value of secondary vegetation recovered by the mining companies.
Key words:Amazonian habitats, insular habitats, iron mines, Neotropical birds, rock outcrops.
Correspondence to: Sérgio Henrique Borges E-mail: [email protected]
*Present address: Departamento de Biologia, Instituto de Ciências Biológicas, Universidade Federal do Amazonas, Av. General Rodrigo O. Jordão Ramos, 3000, 69077-000 Manaus, AM, Brazil
INTRODUCTION
Beta-diversity is the change in species composition along ecological gradients or variation in species composition between sampling units and these changes are generated by substitution, loss or gain of species (Anderson et al. 2011, Carvalho et al.
2012). Species similarity, species replacement and differences in species richness are components of beta-diversity derived from loss, gain and substitution of species in biological assemblages (Baselga 2010, Podani and Schmera 2011,
Carvalho et al. 2012). A special case of differences
in species richness occurs when species of a smaller assemblage comprises a subset of a larger one in an ordered way, a biogeographic pattern called nestedness (Ulrich et al. 2009).
underlying processes (e.g. dispersal limitation, differential habitat use) which are responsible for assembling a particular set of species in the ecological system under study (Ulrich et al. 2009,
Podani and Schmera 2011). Difference in species
richness, for example, could result from loss of species driven by variation in dispersal abilities of the community members (e.g. Carvalho and Cardoso 2014). In addition, insular habitats or true islands with distinct size and degree of isolation generally show a nested arrangement in its biological assemblages, which is interpreted as an outcome of selective colonization, selective
extinction, passive sampling or differential habitat
use (e.g. Ulrich et al. 2009). Therefore, investigating
the contribution of different components of
beta-diversity is fundamental to understand processes involved in the community organization and is especially relevant in regions with high levels of biological diversity such as tropical forests.
Tropical biodiversity reaches its major expression in the Amazon basin whose outstanding species diversity is partially explained by heterogeneity in the vegetation types (Pires and Prance 1985). Although the Amazonian landscape is mostly covered by “terra firme” and flooded forests, small patches of distinctive vegetation makes an important contribution to regional beta-diversity and deserve special attention for research and conservation (Prance 1996, Borges 2013). Indeed, habitats with insular distribution in the Amazon basin generally have distinct biotas and are potentially more threatened by human activity than widespread habitats (Silva et al. 1996, Ferreira 2009, Ferreira et al. 2013, Borges et al. 2015).
A unique and rare vegetation type in the Amazon basin is the cangas or ironstone vegetation, a habitat with savanna aspect growing on rocky soils rich in hematite and other minerals (Silva et al. 1996, Jacobi et al. 2007). Within the Amazon basin, cangas are almost entirely restricted to the Serra dos Carajás in the southeastern Brazilian
Amazon where they are found in patches isolated
each other by a matrix of tropical forest. Cangas vegetation is especially suited to investigate
the ecological adaptation of organisms and its
relationships with environment owing its peculiar
soil conditions. Also the distribution of cangas in
patches of variable sizes and degree of isolation
permits to test for influence of these variables in
the species diversity and nested arrangement in the
species composition.
The avifauna that occupies the cangas and other
habitats in the Carajás region has been intensively
inventoried in the last decades providing an excellent
regional assessment of bird species composition
(Oren 1987a, b, Pacheco et al. 2007). However,
no previous study describes the bird communities
associated with cangas nor its relationships with
environment variables associated with its insular
nature. In addition, the biogeographic affinities of
cangas avifauna are not well understood.
Here we describe patterns of species diversity,
compositional variability and the biogeography
affinities of the bird communities that use
Amazonian cangas vegetation. We are especially
interested in determining the relative contribution
of different components of beta-diversity to the
species distribution. The study was designed to
answer the following questions: i) what are the
biogeographic affinities of cangas avifauna?; ii)
how many bird species are found in the cangas
vegetation at Carajás?; iii) what components of beta-diversity have the most influence on the organization of cangas bird communities?; iv) do
cangas bird assemblages show particular nested
arrangements related with the patches attributes?;
v) are bird species diversity and composition
MATERIALS AND METHODS
STUDY AREA
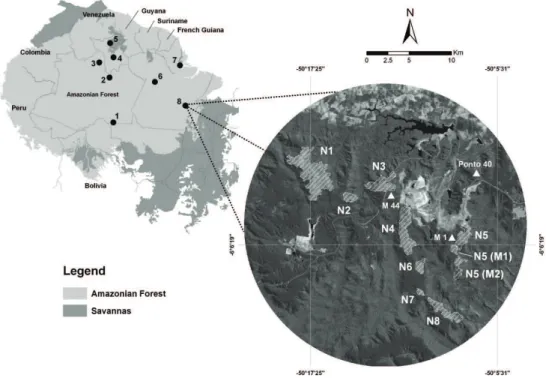
Birds were sampled in the Carajás National Forest, a federal protected area covering 411,494 hectares located in the southeastern Brazilian Amazon (Fig. 1). The rainfall in Carajás is highly seasonal with a rainy season extending from November to April, and a dry season from June to September
(Gumier-Costa and Sperber 2009). Different types of clay
soils serve as substrate for the humid tropical forest in the region (Silva et al. 1996). In contrast, the cangas vegetation grows in a shallow soil layer rich in iron and other minerals (Morellato and Rosa 1991, Silva et al.1996).
Cangas is a complex mosaic of vegetation with physiognomies varying from grasslands with scattered shrubs to patches of low stature forest (Morelato and Rosa 1991). Distribution of soil nutrients and micro-variation in the relief are the main factors responsible for heterogeneity in the cangas vegetation structure (Morelato and Rosa 1991, Silva et al. 1996). Generally, cangas patches occupy hilltops while forests are found on the slopes and valleys. Mining companies exploit iron and other minerals in the region and there are several active mines close to the study sites.
Cangas in the Serra dos Carajás are distributed in sectors denominated south, north and east hills (Silva et al. 1996). We sampled birds on the north hill, selecting eight patches of distinct sizes, shapes and distances between them (Fig. 1). The sites names following the local designation used by mining companies (Table I, Fig. 1). The cangas patches ranged from less than 50 to more than 1,300 ha and were located at altitudes varying from 500 to 800 meters. The closer cangas patches were separated by only 22 m and the most distant ones by more than 16 km (Table I). The study sites present a heterogeneous vegetation structure. Sites N5 (M1) and N5 (M2) were dominated by very dense shrubs with small patches of forest, while N6 and N7 was
dominated by open grassy fields. Seasonal lakes
were found in N1, N4-N7. The largest cangas patch (N1) was excluded from the quantitative analysis
due the low field effort applied to sampling birds
(Table I).
We also sampled birds from three areas of tropical forest adjacent to the cangas patches to understand the contribution of the regional pool of bird species to cangas avifauna (Fig. 1). The forest sites had a tall canopy (> 40 meters) with high density of lianas. Treefall gaps invaded by bamboo shrubs were common in several places. One forest site (M 44) was located in hilly terrain, while the other two (M1 and Ponto 40) were situated on a
flatter plateau area.
BIRD SAMPLING
Sites were studied in September (20-24), November/ December (26-06) 2009, and January (07-24) 2010. We used the standard-size list or Mackinnon list method, which consists of compiling sequential
species lists standardized by a predefined number
of species (Poulsen et al. 1997, Herzog et al.
2002). The size of lists was standardized at five
species which is adequate for sampling relatively species-poor habitats (S.H. Borges, pers. obs.). The species lists were compiled while the observers (SHB and MPD) slowly moved along the trails and roads found in the studied sites. Only birds
promptly identified were numbered in the standard
lists. Observers used tape recorders (Marantz PMD 660 and Sony TCM 5000, Sennheiser ME
66 microphones) to document unidentified birds for later identification. We also performed
play-back trails of selected species listed in Pacheco et al. (2007) to increase their detectability, making the species inventory as complete as possible.
Trails and unpaved roads that cross the cangas provide good coverage of the study sites and the same site was sampling on simultaneous days by
TABLE I
Sampling effort, characteristics of studied sites and diversity of birds in Amazonian cangas (C) and tropical forest (M) sites at Carajás National Forest.
Sites
names Sampling effort
1 Area
(ha)
Isolation Metric 12
Isolation
metric 23 Number of
species4 Number of species5
N1 – C 1 – 33 1,366.94 1,301.03 1 62 55
N3 – C 2 – 62 419.56 1,515.46 0.94 89 70
N4 – C 6 – 151 625.73 1,120.21 0.82 111 86
N5 – C 4 – 80 292.32 21.94 0.75 107 77
N5 (M1) – C 3 – 30 66.01 21.94 0.79 69 50
N5 (M2) – C 3 – 51 165.66 124.85 0.96 86 65
N6 – C 3 – 50 128.04 1,120.21 1 103 75
N7 – C 2 – 17 43.77 485.71 0.97 67 59
M1 – M 2 – 37 NA6
NA NA 105 15
M44 – M 8 – 84 NA NA NA 161 31
Ponto 40 – M 4 – 62 NA NA NA 140 19
1measured in number of census days (left numbers) and standard-lists compiled (right numbers); 2
distance in meters to the closer
cangas patch; 3proportion of forest in a 1000 m. buffer area around focal patch, 4
all species including forest and non-forest/edge
species; 5only non-forest/edge species; 6
not applicable.
effort as proportional possible to patch size, but this
strategy was not possible to implement at the sites
N1 and N3 due the limited time for fieldwork. We
sampled 2-4 trails at each study site and recorded a total of 657 standard-size lists varying from 17 to 151 lists per site (Table I).
We also sampled birds with ten mist-nets (12 x 2.5 m, 36 mm mesh size) arranged in continuous lines and operated for two consecutive days. Ten
capture sites were sampled (five sites in the forest and five in cangas) resulting in the capture of 284
individuals in 2,840 net/hours. The field efforts
with mist-nets, however, were insufficient to collect
fully representative samples and capture data was used only in the qualitative analysis (see below).
BIOGEOGRAPHIC AND ECOLOGICAL ANALYSIS
Biogeographic analyses were based in the check-list of bird species of Carajás National Forest provided by Pacheco et al. (2007). The geographic distribution of birds was classified into three general categories – i) widespread species whose distribution covered several biomes including the
Amazonia, Atlantic Forest and Cerrado; ii) species
whose distributions are primarily restricted to the Amazonian region; and iii) species recorded in the Amazonia, but with a geographical distribution centered in other biomes. Recent monographs and
field guides were consulted for this categorization
(del Hoyo et al. 1992-2004, Ridgely and Tudor
2009). We also classified birds by their preferred
habitat as forest or non-forest/edge species based on more detailed habitat association categories proposed byPacheco et al. (2007). The association between geographic categories and habitat preference was tested through a chi-squaretest.
In addition to this general analysis, the bird checklist of Carajás was compared with other lists compiled from white sand campinas and savannas, the two principal types of open vegetation in the Amazon region (Pires and Prance 1985). The
bird lists were compiled from (Fig. 1): Maracá Ecological Station savanna (Silva 1998), Alter do Chão savanna (Sanaiotti and Cintra 2001), Manicoré savanna in the South of Amazonas State (Aleixo and Poletto 2007), Macapá savanna (Silva et al. 1997), Carajás cangas (Pacheco et al. 2007), Jaú National Park white sand campinas (Borges 2004), Aracá river white sand campinas (Borges et al. 2014), and Viruá National Park white sand campinas (Naka et al. 2006). We compiled a master list of 339 non-forest/edge species distributed in the eight regions and for comparative analysis only the species that were recorded in at least two regions were selected. The bird lists were integrated in a matrix of species by regions which was analyzed through a cluster analysis using the Jaccard index as a resemble measure and group average as a linkage strategy.
Comparisons between species lists had inherent
problems such as different sampling efforts, habitat
types sampled and methods used in the inventories, among other factors (Remsen 1994). Even so, we believe that this exercise is useful for understanding
the affinities of cangas avifauna in the context of
Amazonian open vegetation.
The analyses of data collected during our own fieldwork were based on matrices of presence/ absence because the standard-list method is not designed to generate quantitative data. Bird species captured were also included in these matrices to generate species lists as complete as possible for each site. It is almost certain, however, that species lists for each sampling site are incomplete due short time period for sampling, seasonality in species occupancy among other reasons. Therefore, we used analysis which are robust to undersampling and that permits to compare sites with incomplete species lists (Cardoso et al. 2009, Carvalho et al. 2012).
2012). Each standard list was considered a sample
and we multiplied the sampling efforts by two and
four factors to building curves of number of species
by sampling effort. The iNEXT online resource was
used for extrapolation analyses based on incidence data (Hsieh et al. 2013).
The cluster analyses with same parameters mentioned above were applied to investigate the variation in species compositions among studied sites. Two different data sets were used: one including all species recorded on the sites and another dataset which includes only non-forest/ edge species. The cluster analyses were performed in the PRIMER software (Clark and Gorley 2006). For evaluation of beta-diversity between samples we used the SDR Simplex method (Podani and Schmera 2011), which decomposes the beta-diversity into three components: shared species
similarity (S), differences in species richness (D)
and species replacement (R). In this analysis are
calculated three coefficients (SJac, Drel and Rrel) whose values are presented as proportions permitting to evaluate the relative contribution of each beta-diversity component (Podani and Schmera 2011).
The values of coefficients calculated for all pairs of
sites are simultaneously displayed in ternary plots for a better visualization (Podani and Schmera 2011). Coefficient formulas and description of the method are found in Podani and Schmera (2011). The SDR Simplex was run in the computer program SDRSimplex and the ternary plots were
generated in the SYN-TAX 2000 software (both
softwares can be downloaded from http://ramet. elte.hu/~podani).
We tested the hypothesis that cangas patches (= columns in the matrix) are nested within each other through the nestedness metric based on overlap
and decreasing fill (NODF) (Almeida-Neto et al.
2008). NODF allows for quantify the nestedness among sites or species independently and its values range from 0 to 100, with larger numbers indicating increased nestedness (Almeida-Neto et al. 2008,
Ulrich et al. 2009). The presence/absence matrices were ordered by number of species, area and two isolation measures of cangas patches (see below)
to investigate the influence of these variables in the
nested arrangements of sites. Each of these ordering in the matrices assumes a different underlying process. For example, directional losses of species from the larger patch to the smaller are presumed to be caused by selective extinction (Ulrich et al. 2009).
The statistical significance of the NODF
indices was assessed through null model shuffled
columns (SC) that randomize the order of columns in the matrix and test if a particular ordering of the columns leads to a higher degree of nestedness than expected by chance. NODF analysis were performed using the free web application Nestedness for Dummies (NeD) developed by Strona et al. (2014) (available in http://purl.oclc. org/ned.). In addition to the NODF analysis, we also calculated the percentage of relativized nestedness (PRN), a recent metric proposed by (Podani and Schmera 2012) using the SDRSimplex software.
We tested the influence of size and isolation
as a proxy of variation in species composition. All variables were log (10) transformed before running the analyses with exception of proportion of forest in the buffer zone. Areas and distance between cangas patches were measured through a Geographical Information System (GIS).
RESULTS
BIOGEOGRAPHIC AFFINITIES
Biogeographic and habitat use categories were
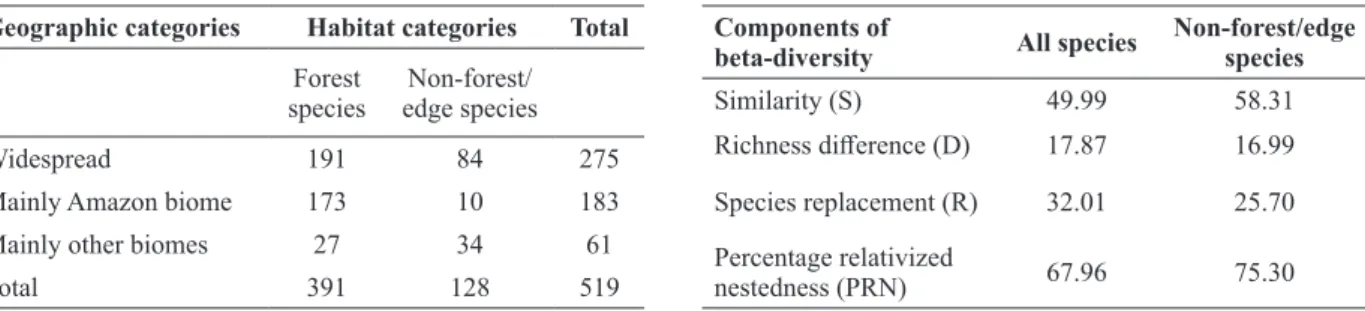
significantly associated with each other (χ2 = 73.12, p < 0.001). Forest birds in Carajás were near equally distributed between widespread or mainly the Amazon biome categories (Table II). By contrast, most of the non-forest/edge species had wide distribution (Table II). Also, a moderate proportion (26.5%) of non-forest/edge species had most part of its distributional range on extra-Amazonian biomes, especially the Cerrado.
Two major groups formed by white sand
campinas and savanna sites were identified in the
cluster analysis of bird inventories in the Amazonian open vegetation (Fig. 2). A further subdivision was observed between the savannas sites with cangas of Carajás joined to Alter do Chão to constitute a distinct group (Fig. 2).
From a total of 339 species distributed in the eight regions of Amazonian open vegetation only 20 (6%) were recorded exclusively in the Carajás cangas. Most of these “exclusive” species (e.g.
Coccycua minuta and Dromococcyx phasianellus) were not recorded in other sites, likely due to sampling artifacts. However, a small number of species only recorded in Carajás has genuinely restricted distribution within the Amazon lowlands such as Colibri serrirostris, Thamnophilus torquatus and Thamnophilus palliatus.
CANGAS BIRD COMMUNITIES
We recorded 318 bird species in Carajás: 210 species from forest habitat and 181 from cangas (bird list
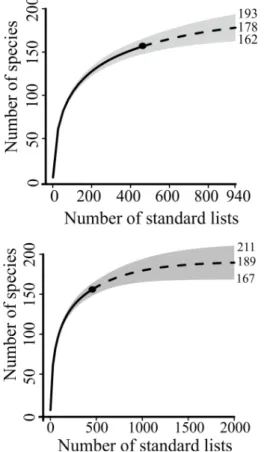
available from the authors). The average numbers of bird species were 86.8 and 135.3 in cangas patches and adjacent forests sites, respectively (Table I). Sampling effort was insufficient for an exhaustive bird inventory of cangas (Fig. 3). Even extrapolation with double effort still was not enough to obtain an asymptotic curve and the
species richness average was 178 with confidence
intervals (ci) varying from 162 to 193 (Fig. 3). Four
times extrapolation of the applied sampling effort
resulting in an asymptotic curve with 189 species in average (ci 167-211). However, with such extreme
extrapolation, the confidence intervals were larger
compromising the precision of the estimate (Fig. 3).
Cangas and the adjacent forest shared only 23% of total avifauna (n = 73 species), and the patterns of sites similarity show that the two habitats are very distinct in species composition (Fig. 4). As expected, the distinction in species composition of cangas and forests sites is more evident among the non-forest/edge species. In contrast, species compositions within cangas sites are more homogenous, especially among the non-forest/edge species (Fig. 4).
Species similarity (S), followed by species replacement (R) were the more influential components of beta-diversity in the cangas bird communities whereas differences in species richness (D) made a smaller contribution to communities organization (Fig. 5, Table III). The importance of species similarity between sites is more evident when considering non-forest/ edge species, reinforcing the pattern of species composition shown in the cluster analyses (Table III).
The values of NODF indices ranged from 47.23 to 82.68 (Table IV). The highest values of NODF were obtained in the matrix ordered by number of species and the smaller ones in the matrix ordered by isolation (Table IV). The nested structure of bird
TABLE II
Number of bird species in the Carajás National Forest distributed by geographical and habitat association
categories.
Geographic categories Habitat categories Total
Forest species
Non-forest/ edge species
Widespread 191 84 275
Mainly Amazon biome 173 10 183
Mainly other biomes 27 34 61
Total 391 128 519
TABLE III
Percentage contribution of each component of beta-diversity for two groups of birds recorded in cangas
vegetation in the Carajás National Forest. Components of
beta-diversity All species Non-forest/edge species
Similarity (S) 49.99 58.31
Richness difference (D) 17.87 16.99
Species replacement (R) 32.01 25.70 Percentage relativized
nestedness (PRN) 67.96 75.30
TABLE IV
Results of nestedness analysis using nestedness metric based on overlap and decreasing fill (NODF) indices in matrices ordered by different criteria. The statistical significance of the NODF was accessed by 100 randomization of columns.
Matriz ordered by NODF index Z_score Nested?
Number of species
all species 76.01 2.85 Yes (p < 0.001)
Non-forest/edge species 82.68 3.54 Yes (p < 0.001)
Patch size
all species 65.68 2.22 Yes (p < 0.05)
Non-forest/edge species 68.43 2.06 Yes (p < 0.05)
Patch isolation 1
all species 47.23 0.82 No (p > 0.05)
Non-forest/edge species 55.54 1.16 No (p > 0.05)
Patch isolation 2
all species 28.63 - 0.75 No (p > 0.05)
Non-forest/edge species 35.14 - 0.61 No (p > 0.05)
richness and cangas patch size, but not by isolation
between patches (Table IV). The highest degrees of nested were observed among the non-forest/edge
species both in NODF and PRN indices (Tables III
and IV).
GEOGRAPHICAL CORRELATES
Larger cangas patches housed greater number of
species in the two groups of birds, although the
coefficients of determination were not particularly high (Table V). The influence of area on species
composition represented by axis 1 of NMDS was
only marginally significant for all species. Patch isolation measured by distance and buffer-based metrics does not affect neither species richness nor
species composition (Table V).
DISCUSSION
DIVERSITY AND BIOGEOGRAPHY OF CANGAS AVIFAUNA
curves suggesting that more than 200 species could be integral part of cangas avifauna. Unfortunately, our study consists of short surveys which do not permit distinguished sporadic or transient birds from the core avifauna limiting a more accurate estimative of the bird species richness. We suspect, however, that previous studies underestimate the bird species richness of cangas. This vegetation type attracts birds from disturbed vegetation, natural open vegetation and nearby tropical forests which likely contribute to its high species diversity. Cangas are occupied by an avifauna with
compositional affinity to the savanna patches in
Amazonia and other biomes. This result could be related to the proximity of the Carajás region to the border between Amazonia and Cerrado, which facilitates the biotic interchange between
Figure 2 - Cluster analysis of bird inventories in open vegetation through the Brazilian Amazon including sites in white sand campinas (C), savanna vegetation (S) and Carajás cangas.
Figure 3 - Curves of incidence-based extrapolation for reference samples (black circles) with two and four times the efforts applied in the bird inventories in the cangas vegetation. Gray shaded represent the 95%
unconditional confidence intervals.
TABLE V
Results of simple regression analysis testing the relationships between area and isolation metrics of cangas
and bird species diversity and composition. Sample size for all analysis was seven sites.
Species group
Explanatory variables
Response variables
R2 adjusted
P values
All species
Area Number of species
0.61 0.02 NMDS
(axis 1)
0.47 0.05 Isolation
measure 1*
Number of species
- 0.13 0.60 NMDS
(axis 1)
0.32 0.11 Isolation
measure 2**
Number of species
- 0.15 0.66 NMDS
(axis 1)
- 0.18 0.80
Non-forest/ edge species
Area Number of species
0.59 0.03
NMDS (axis 1)
0.43 0.07 Isolation
measure 1
Number of species
0.06 0.29 NMDS
(axis 1)
0.08 0.27 Isolation
measure 2
Number of species
- 0.19 0.91 NMDS
(axis 1)
- 0.20 0.98 * Distance from the nearest canga patch, ** proportion of
forest in a 1000 m. buffer area around focal patch.
these biomes. In fact, the low levels of genetic
differentiation in birds occupying savanna patches
in Amazonia suggests contemporaneous population
continuity (Bates et al. 2003). Also, enclaves of
savanna in Amazonia (including cangas in Carajás)
could be connected through the expansion of open vegetation during the Quaternary (Absy et al. 1991,
Werneck et al. 2012). The avifauna of cangas,
therefore, could be influenced by the dispersal of
species facilitated by current ecological conditions
or recent past climate changes.
Most species recorded in cangas that have widespread distribution in the Neotropics occupying natural savannas, dry forests and open anthropogenic vegetation. However, the cangas is also notable for the occurrence of endemic species of plants and vertebrates (Silva et al. 1996, Giaretta and Kokubum 2003), with two bird taxa described as subspecies from Carajás (Oren 1985, but see Teixeira and Luigi 1993). Further studies on genetic and morphological variation of individual bird species are necessary for a better assessment of the taxonomic distinctiveness of the cangas
Figure 5 - Ternary plots shows the relative contributions of
species similarity (S), species replacement (R) and difference
avifauna. Based on the suggestions provided by Pacheco et al. (2007), the best candidate species for such studies are: Crypturellus parvirostris,
Laterallus viridis, Caprimulgus maculicaudus,
Colibri serrirostris, Thamnophilus torquatus,
Thamnophilus palliatus, Formicivora grisea,
Hemmitriccus margaritaceiventer, Euscarthmus meloryphus, Sublegatus obscurior, Rhytipterna immunda and Euphonia cyanocephala.
BIRD COMMUNITIES OF CANGAS
Bird species composition varied little between cangas patches. Several birds characteristic of this habitat were austral or Neotropical migrants, and even the resident species are well distributed among the sites. Apparently, the high dispersal abilities of
birds, combined with low habitat specificity, act to
homogenize the bird species composition. In fact,
the similarity among sites was the most influential
component of beta-diversity in the cangas bird communities.
Size of cangas patches had a significant, but not a particularly large, influence on the bird species
richness and composition. In contrast, isolation measured by two different and complementary
metrics does not affect bird species distribution.
This is surprising given the insular nature of cangas. However, it is possible that the range of sizes and degree of isolation between sites might
have been insufficient to detect substantial effects
of these variables in the bird species distribution. Additional sampling of birds in the cangas of south and east hills of Serra dos Carajás would improve
evaluation of the effects of landscape variables on
bird species composition of this habitat.
Nestedness also is an important characteristic of bird communities that occupies the cangas patches as show by the NODF and PRN indices. Several processes have been proposed to explain the nested structure in biological communities including selective extinction, differential colonization
abilities of species, passive sampling and habitat nestedness (Ulrich et al. 2009). Disentangle the contribution of these processes to nested pattern,
however, is a difficult task.
The nested structure in bird distribution is related to size of cangas patches and some authors could interpret this as an indication of selective extinction (Lomolino 1996). Alternatively, it is possible that some bird species are more space demanding or have preferences for specific microhabitats (Calmé and Desrochers 1999). For instance, we recorded Thamnohilus torquatus
only in the larger patch of cangas (N1 site > than 1,000 ha) which suggests that some species need larger areas for successful colonization or have requirements for microhabitats not found in the small patches of cangas. Unfortunately, basic natural history information of cangas birds is not available limiting the evaluation of alternative explanations for the nested structure in this habitat.
CONSERVATION
The environmental and biodiversity uniqueness of ironstone outcrops (including Amazonian cangas), and their association with economically important minerals represent a significant conservation challenge in Brazil (Jacobi et al. 2007). Mining operations result in almost complete suppression of cangas vegetation, causing damage to the avian communities, especially those species unable to use anthropogenic open vegetation (Oren 1987a). However, it is possible to link mineral exploration with biodiversity conservation, if appropriate management strategies are adopted (Oren 1987a).
patches of natural cangas receive strict protection. How can such patches be identified in order to maximize the bird species diversity and the ability of these patches to maintain viable populations of
bird species?
Our preliminary analyses show a significant effect of area in the nested patterns of sites suggesting
that protection of larger cangas patches could be a good option for conservation. However, as noted
by Fischer and Lindenmayer (2005), significant
nestedness can not be interpreted as perfect nestedness, which implies that some small patches could be also relevant for individual species. The choice of cangas patches that will receive special protection must be supported by detailed studies on the relationships between communities of birds (and other organisms) with landscape properties of cangas. Also it is relevant to map and estimate the population sizes of bird species with restrict distribution in the Amazon recorded in the Carajás cangas (see list in Pacheco et al. 2007).
We also recommend investigations of the conservation value of the cangas secondary vegetation recovered by mining companies. It is possible that the plant communities covering mining
spoils, despite being highly modified, reproduce
some of the environmental characteristics of the original cangas, and so meets the breeding and food needs for some bird species. This possibility needs to be investigated with carefully designed field studies. All these recommended studies must be integrated in a monitoring program designed to investigate the biological dynamics of bird communities and populations in the cangas ecosystem.
ACKOWLEDGMENTS
This study is a part of an environmental impact assessment of mining activities on the bird communities in the Carajás cangas. We acknowledge the technicians of Amplo Consultoria
e Treinamento for financial and technical support
for this study. The Brazilian environmental agencies, Instituto Brasileiro do Meio Ambiente e dos Recursos Naturais Renováveis (IBAMA) and Instituto Chico Mendes de Conservação da Biodiversidade (ICMBIO), gave the formal permits to work in the Carajás National Forest. We acknowledge Frederico Drumond Martins, ICMBIO technician responsible for management of Carajás National Forest, who encourage us to publish this study. Vale do Rio Doce Company provided several logistic facilities to access the study sites. Marcelo Moreira kindly prepared the
figure 1 and calculated the landscape metrics. We
appreciate the help provided by Adrian Barnett,
Anne Cooper and Jeff Stratford with the English.
Giovanni Strona provided guidance to nested analysis. Two anonymous reviewers make valuable
comments and corrections in the first versions of the
article. Finally, we would especially like to thank Selvino Neckel for giving us the opportunity to
study birds in the Carajás region. The final version of this article was completed while the first author held a grant from FIXAM Program from Fundação
de Amparo à Pesquisa do Estado do Amazonas (FAPEAM).
REFERENCES
ABSY ML ET AL. 1991. Mise en evidence de quatre phases d’ouverture de la forêt dense dans le sud-est de l’Amazonie au cours des 60,000 dernières années. Première comparaison avec d’autres régions tropicales. Comptes Rendus de l’Academie des Sciences de Paris 312(II): 673-678.
ALEIXO A AND POLETTO F. 2007. Birds of an open
vegetation enclave in southern Brazilian Amazonia. Wilson J Ornithol 119: 610-630.
ALMEIDA-NETO M, GUIMARÃES P, GUIMARÃES JR PR, LOYOLA RD AND ULRICH W. 2008. A consistent metric for nestedness analysis in ecological systems: reconciling concept and measurement. Oikos 117: 1227-1239.
BASELGA A. 2010. Partitioning the turnover and nestedness components of beta diversity. Global Ecol Biogeogr 19: 134-143.
BATES JM, TELLO JG AND SILVA JMC. 2003. Initial assessment of genetic diversity in ten bird species of South American Cerrado. Studies in Neotropical Fauna and Environment 38: 87-94.
BORGES SH. 2004. Species poor but distinct: bird assemblages in white sand vegetation in Jaú National Park, Amazonian Brazil. Ibis 146: 114-124.
BORGES SH. 2013. Bird species distribution in a complex Amazonian landscape: species diversity, compositional variability and biotic-environmental relationships. Studies in Neotropical Fauna and Environment 48: 106-118. BORGES SH, CORNELIUS C, RIBAS C, ALMEIDA R,
GUILHERME E, ALEIXO A, DANTAS S, SANTOS
MP AND MOREIRA M. 2015. What is the avifauna of
Amazonian white-sand vegetation? Bird Conserv Int 26:
192-204.
BORGES SH, WHITTAKER A AND ALMEIDA R. 2014. Bird diversity in the Serra do Aracá region, north-western Brazilian Amazon: preliminary check-list with considerations on biogeography and conservation. Zoologia 31: 343-360.
CALABRESE AND FAGAN W. 2004. A comparison-shopper’s guide to connectivity metrics. Front Ecol Environ 2: 529-536.
CALMÉ S AND DESROCHERS A. 1999. Nested bird and micro-habitat assemblages in a peatland archipelago. Oecologia 118: 361-370.
CARDOSO P, BORGES PAV AND VEECH JA. 2009. Testing the performance of beta diversity measures based on incidence data: the robustness to undersampling. Diversity and Distributions 15: 1081-1090.
CARVALHO JC AND CARDOSO P. 2014. Drivers of beta diversity in Macaronesian spiders in relation to dispersal ability. J Biogeogr 41: 1859-1870.
CARVALHO JC, CARDOSO P AND GOMES P. 2012. Determining the relative roles of species replacement and species richness differences in generating beta-diversity patterns. Global Ecol Biogeogr 21: 760-771.
CLARK KR AND GORLEY RN. 2006. PRIMER v6: user manual/tutorial. PRIMER-E Ltd, Plymouth, UK.
COLWELL RK, CHAO A, GOTELLI NJ, LIN S-Y, MAO
CX, CHAZON RL AND LONGINO JT. 2012. Models
and estimators linking individual based and sample-based rarefaction, extrapolation and comparison of assemblages. J Plant Ecol 5(1): 3-21.
DEL HOYO J, ELLIOT A AND SARGATAL J (Eds). 1992. Handbook of the Birds of the World, vol. 1 - Ostrich to Ducks. Lynx Edicions, Barcelona.
DEL HOYO J, ELLIOT A AND SARGATAL J (Eds). 1993. Handbook of the Birds of the World, vol. 2 - New World Vultures to Guineafowl. Lynx Edicions, Barcelona. DEL HOYO J, ELLIOT A AND SARGATAL J (Eds). 1996.
Handbook of the Birds of the World, vol. 3 - Hoatzin to Auks. Lynx Edicions, Barcelona.
DEL HOYO J, ELLIOT A AND SARGATAL J (Eds). 1997. Handbook of the Birds of the World, vol. 4 - Sandgrouse to Cuckoos. Lynx Edicions, Barcelona.
DEL HOYO J, ELLIOT A AND SARGATAL J (Eds). 1999. Handbook of the Birds of the World, vol. 5 - Barn-Owls to Hummingbirds. Lynx Edicions, Barcelona.
DEL HOYO J, ELLIOT A AND SARGATAL J (Eds). 2001. Handbook of the Birds of the World, vol. 6 - Mousebirds to Hornbills. Lynx Edicions, Barcelona.
DEL HOYO J, ELLIOT A AND SARGATAL J (Eds). 2002. Handbook of the Birds of the World, vol. 7 - Jacamars to Woodpeckers. Lynx Edicions, Barcelona.
DEL HOYO J, ELLIOT A AND SARGATAL J (Eds). 2003. Handbook of the Birds of the World, vol. 8 - Broadbills to Tapaculos. Lynx Edicions, Barcelona.
DEL HOYO J, ELLIOT A AND SARGATAL J (Eds). 2004. Handbook of the Birds of the World, vol. 9 - Cotingas to Wagtails. Lynx Edicions, Barcelona.
FERREIRA CAC. 2009. Análise comparativa da vegetação lenhosa do ecossistema campina na Amazônia Brasileira. Doctoral thesis, Instituto Nacional de Pesquisas da Amazônia and Universidade Federal do Amazonas. FERREIRA L , CHAVES PP, CUNHA DA, ROSÁRIO AS
AND PAROLIN P. 2013. A extração ilegal de areia como causa do desaparecimento de campinas e campinaranas no Estado do Pará, Brasil. Pesquisas (Botânica) 64: 157-173. FISCHER J AND LINDENMAYER DB. 2005. Perfectly
nested or significantly nested: an important difference for conservation management. Oikos 109: 485-494.
GIARETTA AA AND KOKUBUM MN. 2003. A new species of Pseudopaludicola (Anura, Leptodactylidae) from Northern Brazil. Zootaxa 383: 1-8.
G U M I E R - C O S TA F A N D S P E R B E R C F. 2009. Atropelamento de vertebrados na Floresta Nacional de Carajás, Pará, Brasil. Acta Amaz 39: 459-466.
HERZOG SK, KESSLER M AND CAHILL TM. 2002. Estimating species richness of tropical bird communities from rapid assessment data. Auk 119: 749-769.
HSIEH TC, MA KH AND CHAO A. 2013. iNEXT online: interpolation and extrapolation (Version 1.3.0) [Software]. http://chao.stat.nthu.edu.tw/blog/software-download/. J A C O B I C M , C A R M O F F, V I N C E N T R A N D
LOMOLINO MV. 1996. Investigating causality of nestedness of insular communities: selective immigrations or
extinctions? J Biogeogr 23: 699-703
MORELLATO P AND ROSA NA. 1991. Caracterização de alguns tipos de vegetação na região amazônica, Serra dos Carajás, Pará, Brasil. Rev Bras Bot14: 1-14.
NAKA LN, COHN-HAFT M, MALLET-RODRIGUES F, SANTOS MP AND TORRES MF. 2006. The avifauna of the Brazilian State of Roraima: bird distribution and biogeography in the Rio Branco basin. Rev Bras Ornitol 14: 197-238.
OREN DC. 1985. Two new subspecies of birds from the canga vegetation, Serra dos Carajás, Pará, Brazil, and one from Venezuela. Publicações Avulsas do Museu Paraense Emílio Goeldi 40: 93-100.
OREN DC. 1987a. A avifauna de canga ferrífera, p. 113-116. In: Desenvolvimento econômico e impacto ambiental em áreas de trópico úmido Brasileiro – a experiência da CVRD. Secretaria Especial do Meio Ambiente, International Waterfowl Research Bureau, Companhia Vale do Rio Doce, Rio de Janeiro.
OREN DC. 1987b. A avifauna da região da Serra dos Carajás, Brasil. Memorias del III Congresso de Ornitologia Neotropical, Cali, p. 165-168.
PACHECO JF, KIRWAN GM, ALEIXO A, WHITNEY BM,
WHITTAKER A, MINNS J, ZIMMER K, FONSECA PS, LIMA MF AND OREN DC. 2007. An avifaunal inventory of the CVRD Serra dos Carajás Project, Pará, Brazil. Cotinga 27: 15-30.
PIRES JM AND PRANCE GT. 1985. The vegetation types of Brazilian Amazon, p. 109-145. In: PranceGT and Lovejoy TE (Eds), Key environment – Amazonia. Pergamon Press, New York.
PODANI J AND SCHMERA D. 2011. A new conceptual and methodological framework for exploring and explaining pattern in presence - absence data. Oikos 120: 1625-1638. PODANI J AND SCHMERA D. 2012. A comparative
evaluation of pairwise nestedness measures. Ecography 35: 889-900.
P O U L S E N B O , K R A B B E N , F R O L A N D E R A , HINOJOSA MB AND QUIROGA CO. 1997. A rapid
assessment of Bolivian and Ecuadorian montane avifaunas using 20-species lists: efficiency, biases and data gathered. Bird Conserv Int 7: 53-67.
PRANCE G. 1996. Islands in Amazonia. Philos T Roy Soc B 351: 823-833.
REMSEN JV. 1994. Use and misuse of bird lists in community ecology and conservation. Auk 111: 225-227.
RIDGELY RS AND TUDOR G. 2009. Field guide to the songbirds of South America – the Passerines. University of Texas Press, Austin.
SANAIOTTI T AND CINTRA R. 2001. Breeding and migrating birds in a Amazonian savanna. Stud Neotrop Fauna Environ 36: 23-32
SILVA JMC. 1998. Birds of Ilha de Maracá, p. 211-229. In: Miliken W and Ratter JA (Eds), Maracá: the Biodiversity and Environment of an Amazonian Rainforest. Wiley, Chichester.
SILVA JMC, OREN DC, ROMA JC AND HENRIQUES LMP. 1997. Composition and distribution patterns of the avifauna of an Amazonian upland savanna, Amapá, Brazil. Ornithol Monogr 48: 743-762
SILVA MFF, SECCO RS AND LOBO MG. 1996. Aspectos ecológicos da vegetação rupestre da Serra dos Carajás, Estado do Pará, Brasil. Acta Amaz 26: 17-44.
STRONA G, GALLI P, SEVESO D, MONTANO S AND FATTORINI S. 2014. Nestedness for Dummies (NeD): a user friendly web interface for exploratory nestedness analysis. J Stat Soft 59: 1-9.
TEIXEIRA DM AND LUIGI G. 1993. Notas sobre
Poecilurus scutatus (Sclater, 1859) (Aves, Furnariidae). Iheringia (Série Zoologia) 74: 117-124.
ULRICH W, ALMEIDA-NETO M AND GOTELLI NJ 2009. A consumer’s guide to nestedness analysis. Oikos 118: 3-17.