Copyright © 2016 Vilnius Gediminas Technical University (VGTU) Press http://www.tandfonline.com/TsPm
Using MUltiple Criteria DeCision analYsis (MCDa)
to assist in estiMating resiDential HoUsing ValUes
Fernando a. F. Ferreira a,b,*, ronald W. spaHr b, Mark a. sUnDerMan ba ISCTE Business School, BRU-IUL, University Institute of Lisbon, Avenida das Forças Armadas, 1649–026 Lisbon, Portugal
b Fogelman College of Business and Economics, University of Memphis, Memphis, TN 38152–3120, USA
Received 24 February 2015; accepted 27 July 2015
aBstraCt. Considerable literature exists regarding the complexity of the residential real estate ap-praisal process and the methods employed to determine initial listing prices as estimates of intrinsic market prices. Deviations in residential real estate intrinsic values occur due to a multiplicity of at-tributes and explanatory factors requiring consideration. We conduct a panel study using a Multiple Criteria Decision Analysis (MCDA) based framework that utilizes the skills and knowledge of a panel of residential real estate professionals (i.e. appraisers and realtors). We demonstrate how cognitive mapping and the Measuring Attractiveness by a Categorical Based Evaluation Technique (MACBETH) may assist in estimating appropriate offer/sale prices and strengthening current valuation approaches such as using comparables and/or hedonic modeling. The managerial implications of our MCDA-based framework and some avenues for future research are also presented.
KeYWorDs: Decision support; Housing valuation; MCDA; Residential real estate 1. introDUCton
Accurately estimating the initial asking/sale price for residential real estate is one of the essential first steps in facilitating realtors and sellers suc-cesses in their goal of finding a buyer. Tradition-ally, the estimation of the appropriate initial ask-ing price, from which the final sale price is negoti-ated, has been the responsibility of realtors and appraisers. In many cases, even before appraisers are asked to determine value, real estate brokers and sales associates are asked to establish initial listing prices. Thus, it is critical that these real es-tate professionals understand existing residential housing market conditions and the attributes that determine individual parcel values. The establish-ment of a fair listing price is important in facilitat-ing a timely and mutually beneficial sale.
Much has been written about the appraisal pro-cess and the methods employed in the establish-ment of residential real estate initial listing prices. Nonetheless, market value estimation for
residen-tial real estate remains a complex undertaking (Englund et al. 1998; Fischer 2003). Residential real estate intrinsic values deviate due to a variety of factors that require consideration in the evalu-ation process. Thus, despite considerable progress to date, each valuation approach has specific limi-tations requiring further clarification of selected criteria and trade-off calculations (Ferreira et al. 2012). Using cognitive maps and multiple criteria decision analysis (MCDA), to address valuation limitations, may prove effective by incorporating multiple perceptions and decision makers into a framework for residential real estate valuation.
Methodologically, our MCDA-based framework uses cognitive maps and measures attractiveness to determine an initial offer/ask price for residen-tial real estate by applying a categorical-based evaluation technique (MACBETH) (Bana e Costa, Vansnick 1994; Bana e Costa et al. 2012). MCDA may reinforce current valuation approaches such as the use of comparable properties or hedonic modeling valuation approaches, by potentially re-ducing omitted criteria and promoting better un-* Corresponding author. E-mail: [email protected];
2016 Volume 20(4): 354–370 doi:10.3846/1648715X.2015.1122668
derstanding of the cause-and-effect relationships among attributes (Eden 2004; Filipe et al. 2015). Also, MACBETH may improve value estimation of unique attributes and evaluation criteria (Ferrei-ra et al. 2011a, 2015). In addition, by integ(Ferrei-rating cognitive mapping and MACBETH, our valuation approach may result in initial asking prices satis-factory to both sellers and agents, yet also attrac-tive to potential buyers. We find no prior literature applying this approach, thus we are confident that our study adds to the residential real estate valu-ation literature.
The remainder of the paper is structured as fol-lows. The ensuing section provides a review of the literature on real estate pricing models and strate-gies. Section 3 describes the decision support sys-tem designed. The last section discusses the ma-jor advantages and limitations of our evaluation system, presents concluding remarks and some avenues for future research.
2. BaCKgroUnD on real estate priCing estiMation
Indicative of much of the residential real estate literature, Bin (2004: 68) states that “accurate price prediction of housing sales price is impor-tant in the operation of the housing market”. Ac-curate estimates of sales prices are important not only for sellers and buyers, but also for financial institutions managing underwriting risk related to housing finance. Nevertheless, the estimation of market value for residential real estate is a relatively complex endeavor, because residential housing usually contains unique packages of at-tributes that are potentially conflicting and inter-fering with market value predictions (for further developments, see Clark 1995; gonzález, Formoso 1995; Wolverton, gallimore 1999; Balarine 2004; Hongyu, yue 2005; yan et al. 2007; Malienė et al. 2010; Zhou, Haurin 2010; Benefield et al. 2011; Cheng et al. 2011; Ettema 2011).
Also discussed in the literature are several tech-niques for estimating sales prices such as hedonic modeling, repeated-sales methods and ‘‘hybrid’’ techniques combining both (e.g. Quigley 1995; Englund et al. 1998; Bin 2004; Smith 2006; guo et al. 2007; gouriéroux, laferrère 2009; Hjalmars-son, E., Hjalmarsson R. 2009; Dorsey et al. 2010; Pace et al. 2000; Schulz, Werwatz 2011; Wu et al. 2011). Hedonic modeling is, perhaps, the most widely used mass appraisal technique in estimat-ing residential real estate market values (cf.
Bou-rassa et al. 2010; osland 2010), where the price is defined by a set of lot and housing attributes such as size, number of rooms, geographic location and age of the house, to name just a few. As noted by gouriéroux and laferrère (2009: 206), “the hedonic approach assumes a pricing model where a dwell-ing is represented by a limited number of observed characteristics, each with their own prices”.
Applying hedonic modeling to real estate valu-ation including flexible functional forms, non-parametric or semi-non-parametric regressions and/ or spatial models that capture correlations within submarkets allowing for temporal asymmetry, may have some limitations and has been criti-cized. Criticism generally has been: (1) offers lim-ited guidance regarding the relationship among housing prices and attributes, with “potentially se-rious consequences of functional misspecification” (Bin 2004: 69); (2) being limited by a lack of data on property attributes (according to Dorsey et al. (2010: 91), “[…] hedonic indexes can potentially overcome the limitations of the median price and repeat-sales indexes but are seldom constructed be-cause of a lack of data”); (3) depending not only on previously observed and recorded characteristics of properties but also on previously observed and recorded prices (Quigley 2006; gouriéroux, lafer-rère 2009); (4) estimating coefficients that may suf-fer from omitted variable bias (Hjalmarsson, E.; Hjalmarsson R. 2009); and (5) “not depending on the demand for housing in the market, but only on characteristics of the dwelling and its environment” (Ettema 2011: 1) (for further discussion, see also Peterson, Flanagan 2009; Shin et al. 2011).
While significant progress has occurred, we observe that current methodological approaches, including hedonic modeling, are not without limi-tations in terms of evaluation criteria selection and trade-off calculations. As emphasized by Bou-rassa et al. (2010: 139), “caution, however, should be exercised [...]. Appropriate variables must be selected carefully and measured accurately”. From this perspective, MCDA techniques may provide a useful contribution in overcoming the limitations identified above. In particular, the integration of cognitive maps and MACBETH (background de-tails are presented in section 3) can inform and support the development of more realistic price estimation systems. First, cognitive mapping may assist in reducing the number of omitted criteria and promoting a better understanding of the cause-and-effect relationships among evaluation criteria/attributes (Eden 2004; Filipe et al. 2015).
Second, MACBETH tends to improve the process of estimating compensations among those same evaluation criteria (Ferreira et al. 2014a).
Another important feature of MCDA is that it is designed as a synergistic methodology that may be used to assist price estimation by allowing decision makers/real estate professionals to periodically monitor price updates. However, it is worth not-ing that “the hedonic approach assumes a pricnot-ing model that explains how the price of an apartment or house depends on its characteristics” (gourié-roux, laferrère 2009: 209). MCDA may be used in a complementary rather than a substitution role in establishing initial offering prices, based not only on housing attributes (or characteristics) but also on the semantic judgments and professional experience of real estate professionals. As already noted by Suedel et al. (2009: 5), “criteria such as human impacts […] and social preferences should also be added because these criteria also can sig-nificantly affect the […] decision and are important to stakeholders”.
The MCDA framework facilitates integration of uncertainty and allows for non-optimal solutions (Ferreira et al. 2011b) by accepting inputs from active/professional decision makers, thus reducing data requirements (one of the major limitations of traditional hedonic models). In this sense, and because of the professional experience, practical skills and realism brought by the decision makers, “applying multiple criteria analysis methods may increase the efficiency of modeling and forecasting of real estate sector and its macro- and micro-level environment and its development trends” (Zavads-kas et al. 2005: 136).
3. a “neW” sYsteM For resiDential HoUsing sale estiMation
As previously mentioned, we believe that the in-tegration of cognitive maps and MACBETH is a new and novel approach as an addition to the real estate valuation literature. This approach is a proven and effective technique improving crite-ria selection transparency, trade-off calculations and group decision making for a number of differ-ent applications (e.g. Belton, Stewart 2002; Bana e Costa et al. 2005; Ferreira et al. 2012, 2014b; Filipe et al. 2015). MCDA, as applied to real es-tate valuation, may improve price estimation ac-curacy.
Because of their versatility and interactivity, cognitive maps have been adopted as important tools in the structuring and clarification of a
num-ber of complex problems. Ackermann and Eden (2001), Eden and Banville (2003), Ferreira et al. (2012, 2015) and Filipe et al. (2015), among others, find that maps are particularly useful to: (1) pro-mote discussion with and/or among decision mak-ers, (2) reduce the number of omitted variables in a decision making framework; and (3) increase un-derstanding of the cause-and-effect relationships among criteria.
MACBETH is an interactive approach based on pairwise comparisons, which are easy to make, dis-cuss, justify and agree on (cf. Dyer, Forman 1992). According to Bana e Costa and Vansnick (1994) and Bana e Costa et al. (2012), the technical pro-cedure proposed by the MACBETH approach sup-ports the construction of numerical scales ground-ed on semantic judgments, which seems to be use-ful in dealing with trade-offs in a real estate price estimation context, where most of the variables under consideration are intrinsically qualitative (technical details are presented in subsection 3.2).
our study involved three main parts: (1) struc-turing, where cognitive mapping techniques are used to obtain residential housing valuation cri-teria; (2) evaluation, where the MACBETH tech-nique is applied to calculate trade-offs not only among valuation criteria but also among impact levels in each criterion; and (3) recommendations, which explores the methodological approach pro-posed as means of adding value to existing meth-ods regarding residential housing sale price esti-mation. Advantages and limitations of our frame-work are also discussed. We accomplished these three phases with four intensive work sessions with an average duration of five hours each. 3.1. the structuring part
The structuring phase of our real estate valuation problem was developed in our first two work ses-sions. Several issues were addressed during these work sessions, namely: design of a collective cogni-tive map and definition of an evaluation tree with respective descriptors and impact levels.
3.1.1. participants
Decision makers play an important role in the MCDA framework because their active participa-tion is required to assist the facilitator/researcher in designing, implementing and developing the evaluation framework. From this premise, the composition of a panel of experts in real estate was carefully addressed in our study, which faced two major initial constrains: (1) limited availability of real estate experts to participate in group
meet-ings; and, in sequence, (2) difficulties in getting the entire panel together. given these constrains, we convened a panel of seven experts composed of four realtors and three appraisers, who oper-ate in Memphis, TN. It should be pointed out that the different backgrounds of the panel members allowed us to collect and confront different opin-ions and orientatopin-ions in terms of current markets and current practices of residential housing price estimation (for further details on the importance of appraisal-based information, see Downs, güner 2012, 2013). one of the two facilitators who con-ducted the group meetings was also responsible for recording and registering the outcomes achieved in each group session.
3.1.2. problem formulation
This study integrates cognitive maps and MAC-BETH to develop a decision support system for residential housing valuation/price estimation. The problem consists of identifying and interrelat-ing different valuation criteria/property attributes considered important to: (1) better value estimates of residential housing; (2) allow for comparisons among home sales; and (3) monitor prices over the time. Rankings will be presented but they are not the major aim/concern of our valuation system.
3.1.3. the soDa approach and the collective cognitive map
To begin the operational phase and obtain valu-ation criteria/property attributes, we defined the following trigger question: “Grounded on your val-ues and professional experience, what are the main characteristics and/or factors of a house that most influence its sale price?” This question provided the focus for discussion. It is worth noting that in this study only single-family residential real es-tate was addressed; although our framework may be applied to the valuation of apartments, condo-minium and/or other types of property valuation. Single family homes were selected to focus on only one category of real estate, reduce ambiguity and guarantee better decision-making results.
For convenience, and given the constraints pre-sented in subsection 3.1.1, we decided to start the structuring part of our study following SoDA II – a variant of the strategic options development and analysis (SoDA) methodological approach (Eden, Ackermann 2001a, 2001b). More specifically, the first group session was initiated with careful ex-planations of basic concepts related to cognitive mapping and the “post-its technique”. This initial procedure is very important to avoid
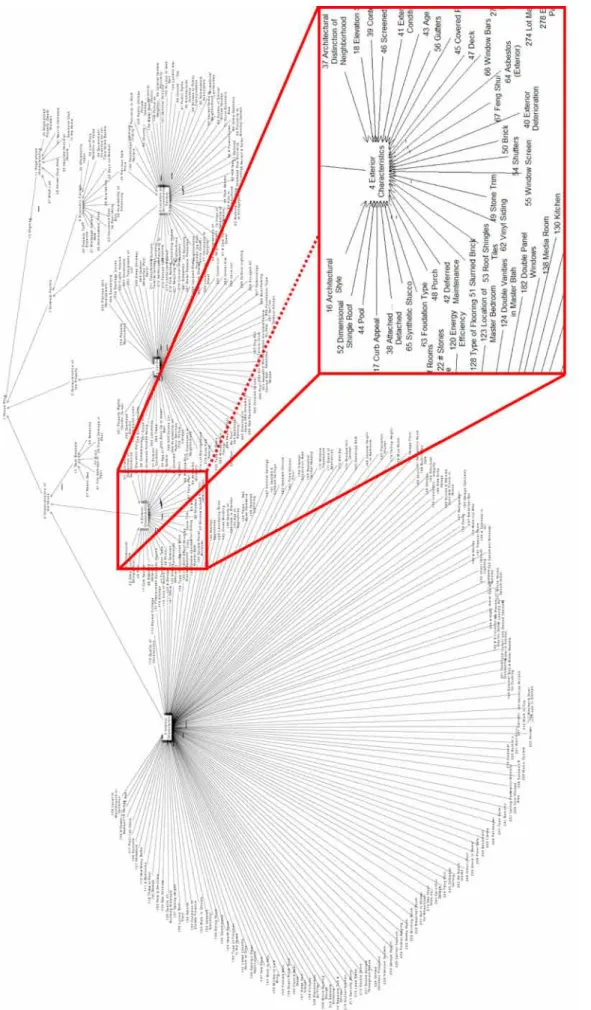
misunder-standings between the facilitators and the panel members. From the practical point of view, it was explained that the “post-its” technique consists of writing what each real estate expert consideres as a relevant criterion on a post-it and stick that post-it on a table/board (or on white wall sheets in our case). The process was repeated until the decision makers demonstrated satisfaction with the number and depth of criteria revealed (for fur-ther details, see Ackermann, Eden 2001; Ferreira et al. 2011a). Following this initial “brain storm-ing” technical procedure, the post-its were subse-quently organized by clusters (also known as ar-eas of concern), allowing additional discussion on their significance. As reported by Malienė (2011: 444), “comprehensive description of the criteria en-sures the maximum precision in estimating price of property”. This procedural step was concluded only with the participants’ agreement on the form and content of the “strategic map” (as it is called in the literature). The final version of the map, which was developed using the Decision Explorer software, is presented in Figure 1.
Considering the size of the final version of the strategic map, which aggregates more than 300 criteria, Figure 1 is merely illustrative. Neverthe-less, it should be recalled that the final version is a result of the discussion/negotiation established among the panel members, and represents the group’s agreement. As can be observed, the final version of the map depends on multiple factors, namely: circumstances, facilitator’s experience and/or skills, decision makers involved, sessions’ duration, etc. Although this might be seen as a shortcoming of our framework, it should be high-lighted, on the other hand, that due to the deci-sion makers’ direct involvement and the amount of information discussed, the use of cognitive map-ping has proved valuable to structure the issue at hand and improve understanding regarding hous-ing sale estimation. From this premise, cognitive mapping should be seen as an instrument to pro-vide consolidated information based on opinions of a certain group of experts. Furthermore, the ap-proach is process-oriented, allowing for adjustment possibilities.
3.1.4. Descriptors and impact levels
Based on the final version of the map, and con-sidering Keeney’s (1992) guidelines, a second group session took place to identify key evalua-tion criteria (also known as fundamental points of view (FPVs); from now on represented by FPVn, with n representing the number of the respective
Fig.
point of view) to estimate residential housing market values. This technical interactive step al-lowed a tree of criteria to be constructed, which was considered of extreme relevance to improve transparency and increase the understanding of the cause-and-effect relationships among identi-fied FPVs. As a structuring procedure, the transi-tion from the strategic map to the tree of criteria was subjective in nature and strongly dependent on the facilitators’ skills. Again, while this may be seen as an important shortcoming, one should bear in mind that the MCDA approach indorses that all decision making is inherently subjective; and integrating subjectivity with objective data is one of the major contributions of this approach (cf. Santos et al. 2002).
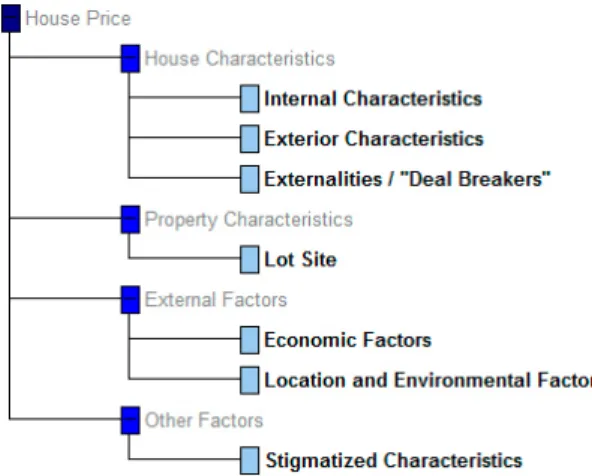
With the support of the M-MACBETH soft-ware, the panel members were allowed to discuss the tree and encouraged to introduce changes in accordance to their own collective perceptions. Following Ferreira et al. (2011a), the properties of the tree were also tested. Representing the de-cision makers’ interpretation of the problem, the final structure of the tree is illustrated in Figure 2, where the FPVs are marked in bold.
Following the decision makers’ interpretation of the tree, FPV1 (Internal Characteristics) concerns internal physical characteristics of the house. In-ternal characteristics will be considered good or bad depending on variables such as: quality of construction, floor plan, interior amenities, size, kitchen and bath conditions; FPV2 (Exterior Char-acteristics) addresses issues in terms of exterior physical characteristics of the house. It seeks to introduce evaluation references into the decision process such as layout/architecture attractiveness, condition, exterior amenities (e.g. pool, deck, porch) and existence of drawbacks; FPV3 (Externalities or
“Deal Breakers”) is defined in order to introduce concerns in terms of past damages and/or danger-ous materials. For example, concerns regarding radon gas, mold, asbestos and flood or fire dam-ages in the past are introduced in the appraisal system by this criterion; FPV4 (Lot Site) concerns evaluation references related to the property, such as: topography, street location, amenities, view and size; FPV5 (Economic Factors) highlights the importance of economic factors, such as: expenses (e.g. taxes, insurances), financing conditions and housing supply; FPV6 (Location and Environmen-tal Factors) addresses issues related to location of the house and surrounding environment, namely: quality of schools, neighborhood safety and reputa-tion, proximity to economic agents (e.g. hospitals, shopping) and accessibilities; and, finally, FPV7 (Stigmatized Characteristics) concerns issues relat-ed to social stigmas, such as: proximity to cemeter-ies, proximity to meth labs or known drug areas, haunting and ghosts and past deaths in the house. As argued by the members, some of the criteria in-cluded in our framework are rarely taken into ac-count. However, the use of cognitive maps in this particular context allowed for their identification, and this was considered extremely positive by the participants involved.
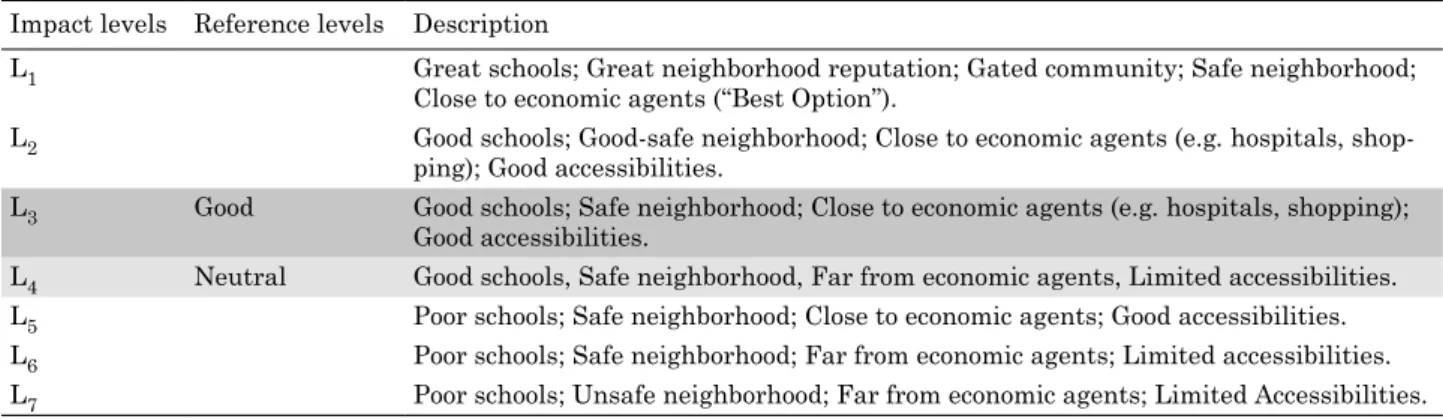
With the tree of criteria validated, the partici-pants were asked to construct a descriptor and re-spective impact levels for each FPV. This technical procedure allowed establishing a proper basis for value judgments projection. For example, FPV6 (i.e. Location and Environmental Factors) becomes operational based on a descriptor of seven ordered reference levels (Li with i = 1, 2, ..., 7), which as-sesses the physical location of a house, while it bal-ances several aspects, namely: quality of schools, neighborhood reputation, proximity to economic agents and accessibilities (Table 1).
According to the decision makers’ interpretation of the descriptor presented in Table 1, the greater the quality of schools and the neighborhood safety, balanced with the proximity to economic agents and accessibilities, the higher the house’s partial score. It should also be noted that in addition to an upper and a lower impact levels, good and neutral levels were also considered to facilitate compari-sons (for further details on the importance of ref-erence points (or “anchors”) to estimate appraised value, see Diaz, Hansz 2001). In practice, this pro-cedure served a basis for sorting the impact levels and obtaining value functions in each FPV. given a complete definition of impact levels in each FPV, the evaluation part was initiated.
3.2. the evaluation part
The evaluation part was initiated with a third group work session. As described in the following subsections, this group workshop was important to calculate the trade-offs/compensations among impact levels and among FPVs. The MACBETH approach was applied during this phase.
3.2.1. Value judgments and local preferences
The definition of a local preference scale for each one of the descriptors created is easier if based on the construction of value matrices. In our study, the matrices were filled following the MACBETH approach, which is based on a set of predefined categories of semantic differences of attractiveness. Specifically: C0 – null; C1 – very weak; C2 – weak; C3 – moderate; C4 – strong; C5 – very strong; and C6 – extreme (cf. Bana e Costa et al. 1999, 2008).
During the third session, the panel members were asked to pairwise compare impact levels in terms of difference of attractiveness. As an exam-ple, for FPV6 (Location and Environmental Fac-tors) (shown in Table 1), the panel needed to de-termine the difference of attractiveness between l1 and l2. Next, how did l1 compare to l3? In essence, we completed the grid shown in Figure 3.
grounded on numerical representations of semi-orders for multiple thresholds (Doignon 1984), the MACBETH approach was developed by Carlos Bana e Costa and Jean-Claude Vansnick in the early 1990s (cf. Bana e Costa et al. 1994, 1999).
As discussed by the authors, given a structure of binary relationships [P(1), P(2), ... , P(k)] (where the preference P(k) is stronger the greater the k), the numerical codification of semantic preferences be-comes possible. More specifically, considering X = {a, b,..., n} as a finite set of n choice alternatives (or actions), the technical procedure consists in repre-senting each choice alternative of X by a certain value x, which results from a value function v(.): X→R, such that differences as v(a) – v(b) (with a P b (i.e. a strictly more attractive than b)) are as compatible as possible with the decision makers’ semantic preferences (see also Jacquet-lagrèze, Siskos 2001). Moreover, for all pairs of choice al-ternatives (a, b) associated to the same category C, the differences v(a) – v(b) will be allocated to the same interval, without any overlap. Techni-cally, if a is considered more attractive than b and the difference between both choice alternatives is moderate, then (a, b) ∈ C3. According to Bana e Costa et al. (2008), whereas two contiguous ranges correspond to two consecutive categories, the pro-cedure consists in the association of asymmetric partitions of the ray of positive real numbers to partition classes of ordered pairs (a, b) (with a P b) (see also Bana e Costa et al. 2012). In this sense, intervals between consecutive categories of differ-ences of attractiveness are naturally introduced based on a value function v and function thresh-olds sk as defined in formulation (1):
( ) 1 : ( ) ( ) . k k k a P b s <v a v b− <s + (1) From the practical point of view, because the thresholds sk are positive real constants, the defi-nition of intervals between categories becomes easier (Bana e Costa et al. 2005). As such, ground-ed on the decision makers’ value preferences, the procedure consists in allocating the difference of attractiveness between each pair of choice alterna-tives (a, b) ∈ X to one of the semantic categories mentioned herein. In doing so, formulations (2)
Table 1. Descriptor and impact levels for FPV6
Impact levels Reference levels Description
l1 great schools; great neighborhood reputation; gated community; Safe neighborhood;
Close to economic agents (“Best option”).
l2 good schools; good-safe neighborhood; Close to economic agents (e.g. hospitals, shop-ping); good accessibilities.
l3 good good schools; Safe neighborhood; Close to economic agents (e.g. hospitals, shopping); good accessibilities.
l4 Neutral good schools, Safe neighborhood, Far from economic agents, limited accessibilities. l5 Poor schools; Safe neighborhood; Close to economic agents; good accessibilities.
l6 Poor schools; Safe neighborhood; Far from economic agents; limited accessibilities.
l7 Poor schools; Unsafe neighborhood; Far from economic agents; limited Accessibilities.
and (3) presented below should be considered for consistency purposes (Junior 2008):
, : ( ) ( ) , a b X v a v b aPb ∀ ∈ > ⇔ (2)
{
}
* * * , 1,2,3,4,5,6 , , , , ( , ) ( , ) : 1 ( ) ( ) ( ) ( ). k k k k a b c d X with a b C and c d C k k v a v b v c v d ∀ ∈ ∀ ∈ ∈ ∈ ≥ + ⇒ − ≥ − (3) According to formulation (2), if alternative a is strictly more attractive than alternative b (i.e. a P b), then the value of a should be greater than the value of b (i.e. v(a) > v(b)). logically, v(a) = v(b) means that no difference between choice al-ternatives is felt. In this case, alternative a is as attractive as alternative b (i.e. a I b) and, conse-quently, the pair (a, b) ∈ C0. grounded on the se-mantic categories Ck presented at the beginning of this subsection, and following Bana e Costa et al. (2008: 28), formulation (3) assumes “that all of the differences allocated to one semantic preference dif-ference category are strictly larger than those al-located to a lower category”.once the consistency of the value judgments has been analyzed, linear programming is applied according to formulation (4) (Junior 2008; Ferreira et al. 2012). This allows an initial scale to be gen-erated, which should serve as a negotiation tool among the decision makers:
( )
. . : , : ( ) ( ) 1
, : ( ) ( )
( , ),( , ) , if thedifferenceof attractivenessbetween
and isbigger than between and ,then: ( ) ( ) ( ) ( ) 1 ( , , , ) ( ) 0 where: isan element o Minv n S T a b X aPb v a v b a b X aIb v a v b a b c d X a b c d v a v b v c v d a b c d v a n − ∀ ∈ ⇒ ≥ + ∀ ∈ ⇒ = ∀ ∈ − ≥ − + + δ = f sothat , , ,... : ( ) , , ,...
isan element of sothat , , ,... : , , ,...( )
( , , , ) istheminimal number of categories of differenceof attractiveness
between thedifferenceof attractiveness between X a b c X n P I a b c a X a b c X a b c P I a a b c d a − − ∀ ∈ ∪ ∀ ∈ ∪ δ
and and the difference of attractivenessbetween and .
b
c d
(4)
Following formulation (4), it is worth noting that n is the most attractive alternative of X (or at least as attractive as the others; i.e. n (P ∪ I) a,
b, c,…), and its value minimization is required to safeguard the minimal length of the initial scale. Contrarily, a- is the least attractive choice alterna-tive of X (or at least as attracalterna-tive as the others; i.e. a, b, c,… (P ∪ I) a-), and its value represents the “zero” of the scale (for a deeper technical dis-cussion, see Bana e Costa et al. 2008). According to formulation (4), Figure 4 illustrates the proce-dure used to achieve the FPV6 value function. It is worth highlighting, however, that this procedure was repeatedly executed until a local preference scale for each descriptor was obtained.
Following Figure 4, it is worth noting the use-fulness of the M-MACBETH software in providing decision makers with the opportunity to express their values using semantic judgments, which are considered a more natural form of value projec-tion (cf. Bana e Costa, Chagas 2004). Addiprojec-tionally, the software used was very valuable in offering opportunities to overcome technical inconsisten-cies. At this stage, and with the aim of guarantee-ing preferential independence among preferences, mutual preferential independence tests were also conducted (for technical details, see Bana e Costa, Chagas 2004; Bana e Costa et al. 2005). once car-dinal value scales (i.e. local scales) were obtained, the next procedural step consisted of calculating weights (i.e. trade-offs) for the FPVs.
3.2.2. the trade-off procedures
Also in the third session, the panel members were next asked to rank the FPVs considered in the model in terms of overall attractiveness to obtain trade-offs among FPVs. This stage in the process was very similar to the previous step, but rather
Fig. 4. Value judgments, proposed value scale and
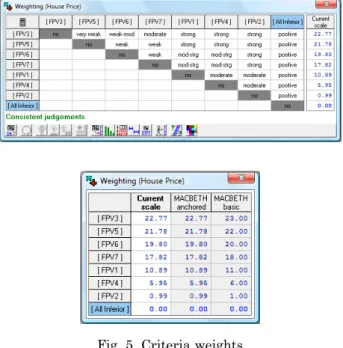
than comparing impact levels within each FPV, the participants were asked to make comparisons among the different FPVs. This step was support-ed on a matrix of cognitive comparisons, which allowed the experts to compare an alternative an (composed of the best impact levels) to an alterna-tive a0 (composed of the worst impact levels) (for technical aspects, see Bana e Costa, Chagas 2004). Following the same technical procedure used for the local scales calculi (cf. Figs 3 and 4), the ex-perts were then asked to express semantic judg-ments regarding the difference of attractiveness among the previously ordered FPVs. An initial MACBETH scale and correspondent compensation rates were then presented for analysis and discus-sion, as illustrated in Figure 5.
After discussion, the substitution rates pre-sented in Figure 5 were consensually approved by the decision makers, and this approval allowed for the application of a simple additive value model as
presented in formulation (5) (Bana e Costa et al. 2008): ( ) ( ) 1 1 1 ( ) 100 0 ( ) 0 n n V a x v a withi i xi i i v goodi i and xi and v neutral
i i = ∑ ∑ = = = = > =
.
(5)Technically, the additive model presented in formulation (5) allows for the calculation of the overall score V(a) through the aggregation of the partial scores vi(a), where wi is the weight of cri-terion i. This overall score is a holistic measure of performance and is important to assist in esti-mating the offer price of a residence. To facilitate cognitive comparisons among choice alternatives (i.e. houses in this case), two specific performance levels – good and neutral – were defined for each descriptor. The respective partial scores of these two reference levels are presented in formulation (5) as vi(goodi) and vi(neutrali).
3.2.3. estimating residential housing sale
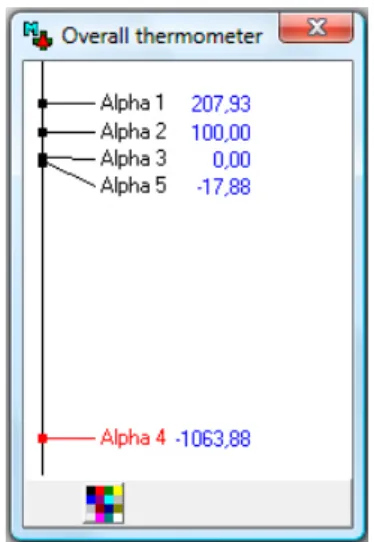
The process of estimating residential housing offer prices was initiated in a fourth and last group ses-sion. Four fictitious houses (called Alphas) were in-troduced in the model to promote cognitive compar-isons and provide decision makers with a starting point for price estimation based on the respective overall performance scores. This procedure was ac-complished based on the cardinal value functions previously defined. This step in the process was very valuable both to test our appraisal system in functional terms and increase the interest of the participants. At this stage, it should be explained that Alpha 1 stands for a house that performs at the best level for all FPVs; Alpha 2 stands for a house that performs at all good levels; Alpha 3 rep-resents a house that is not considered attractive or unattractive and, as such, performs at a neutral Table 2. Impact levels and performance values revealed by the Alphas
overall FPV1 FPV2 FPV3 FPV4 FPV5 FPV6 FPV7 Alpha 1 207.93 l1 200 l1 200 l1 200 l1 266.67 l1 300 l1 200 l1 100 Alpha 2 100 l5 100 l3 100 l2 100 l4 100 l3 100 l3 100 l1 100 Alpha 3 0 l7 0 l4 0 l3 0 l6 0 l4 0 l4 0 l2 0 Alpha 4 -1063.88 l12 –900 l9 –1700 l7 –950 l9 –1233.33 l8 –1800 l7 –900 l5 –500 Weights 0.1089 0.0099 0.2277 0.0595 0.2178 0.1980 0.1782
level for all FPVs; and, finally, Alpha 4 stands for a house that performs at the worst level for all FPVs. Table 2 shows the performance values of the four Alphas, which served as anchored references for price estimation.
As mentioned before, each Alpha’s overall score resulted from the aggregation of the local ratings according to the additive model presented in for-mulation (5). Based on the overall scores calcu-lated, and considering the Alphas’ partial perfor-mance in terms of FPVs, the panel members were asked to associate a price to each one of the four Alphas. This procedural step provided the basis for more discussion and supported cognitive compari-sons allowing the decision makers to estimate a price for each Alpha. Table 3 presents the prices proposed by the group.
Table 3. Estimated price for the Alphas
overall score Estimated price
Alpha 1 207.93 $3,500,000.00
Alpha 2 100 $220,000.00
Alpha 3 0 $132,150.00
Alpha 4 –1063.88 $1,200.00
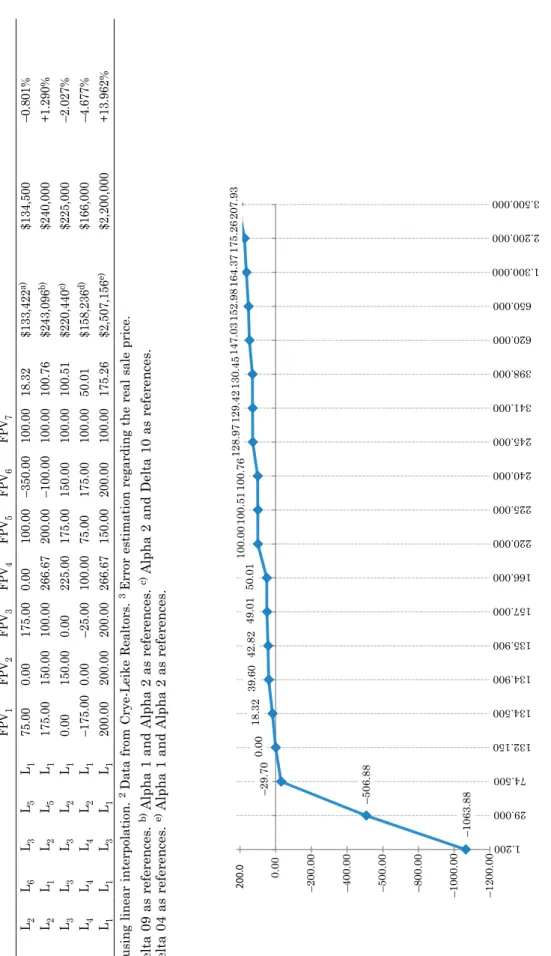
At this stage of the process, residential real estate price estimation became possible thought the application of linear interpolation. As an il-lustrative example, Alpha 5 represents a house with the profile presented in Table 4 and Figure 6. Note that li is the performance level determined by the decision makers for each Alpha in each of the FPVs. The scores and the weights were deter-mined using the MACBETH approach.
Based on the estimated prices presented in Ta-ble 3, and considering the overall score of Alpha 5, the correspondent price would be approximately $129,950.00 (i.e. after applying linear interpola-tion). our evaluation system will increase in ac-curacy and precision with the introduction of ad-ditional actual sales data. More specifically, with linear interpolation, the intervals between scores and prices decrease with an increasing number of actual sales introduced into the model. Conse-quently, the predictive error will tend to decrease accordingly. Thus, one of the major contributions of the MCDA framework is to integrate
subjectivi-ty and transparency with objective data. Moreover, although rakings were not the major objective of our evaluation system, the ordering of the Alphas revealed to be very valuable to support accurate price estimation.
Due to the degree of subjectivity associated to the process, decision makers were invited, at the end of the fourth session, to discuss the results and present advantages and disadvantage of the proposed framework. The decision makers were overall very excited and supportive of this valua-tion process.
3.2.4. testing the process and the new system with actual sales data
After discussing and validating the results achieved during the previous four group meetings, we con-ducted a last session (i.e. the fifth) in order to: (1) test our MCDA-based framework with actual sales data; and (2) get feedback on the results obtained. The attainment of these two objectives would pro-vide important information to assess/strengthen the practical relevance of the process we have fol-lowed to design the appraisal system and of the framework in itself. In this sense, we began the session by asking one of the decision makers (i.e. the realtor who provided us with actual sales data) to complete a matrix of partial evaluations. Recall-ing that one of features of the MCDA approach is reduced need of data (cf. Belton, Stewart 2002; Ferreira et al. 2011b), we used initial information Table 4. Alpha 5 partial performance and respective overall score
overall FPV1 FPV2 FPV3 FPV4 FPV5 FPV6 FPV7 Alpha 5 -17.88 l5 100 l3 100 l3 0 l7 –633.33 l5 –100 l2 150 l2 0 Weights 0.1089 0.0099 0.2277 0.0595 0.2178 0.1980 0.1782
regarding 16 houses (i.e. eleven called Deltas from now on, plus the four Alphas defined by the group in the fourth group session (i.e. Best, Good, Neutral and Worst) and Alpha 5 that was created for ex-emplificative purposes). Following previous MCDA frameworks (e.g. Ferreira et al. 2012, 2014a), this was considered enough to start testing the process and the framework developed.
This phase of the session was fruitful in terms of results consolidation, namely because the deci-sion maker expressed some difficulty with the re-sults obtained for some of the Deltas. This justi-fied the need for careful comparison of the impact profiles of the eleven Deltas, including an analysis of their distance against the five Alphas, which al-lowed for a deeper understanding of the results ob-tained and the introduction of (small) adjustments in the framework. Still, the evaluation system was considered flexible enough to be adopted. Table 5 shows the evaluation exercise of the realtor.
The information provided in Table 5 allowed us to increase the number of anchored references, which, recalling the discussion about linear inter-polation (cf. subsection 3.2.3), allows for price esti-mations and, furthermore, decreases in the predic-tive error (Table 6).
Finally, the next procedural step consisted in using the anchored references presented in Table 6 (i.e. the Alphas and Deltas) to estimate the price of a set of houses (called Betas from now on). Table 7 presents the evaluation exercise of the realtor re-garding five randomly chosen Betas. As can be seen, the application of linear interpolation after calculation of the Betas’ overall scores allowed us to estimate a price for each Beta. Furthermore, we calculate an estimation error for each housing sale
by comparing estimated prices with actual sale prices. An estimation error of approximately 14% for Beta 5 is explainable because Beta 5 is a man-sion and significantlyoutside of the price range of the other properties; however, the results are en-couraging because all the other estimation errors are below 5%. Estimation errors tend to decrease with the introduction of additional Alphas, Deltas or Betas as discussed in subsection 3.2.3. Figure 7 presents the value function obtained.
In line with the results achieved during the last group meeting, the decision maker recognized the Table 5. Partial performance of the 11 Deltas evaluated
House FPV1 FPV2 FPV3 FPV4 FPV5 FPV6 FPV7 Partial value FPV1 Partial value FPV2 Partial value FPV3 Partial value FPV4 Partial value FPV5 Partial value FPV6 Partial value FPV7 Sale price1 Delta 01 l1 l1 l2 l1 l3 l1 l1 200.00 200.00 150.00 266.67 100.00 200.00 100.00 $650,000 Delta 02 l7 l6 l3 l6 l2 l5 l2 0.00 –400.00 0.00 0.00 200.00 –350.00 0.00 $74,500 Delta 03 l5 l2 l2 l3 l3 l2 l1 100.00 150.00 175.00 150.00 100.00 150.00 100.00 $398,000 Delta 04 l8 l6 l3 l6 l3 l2 l1 –150.00 –400.00 0.00 0.00 100.00 150.00 100.00 $157,000 Delta 05 l3 l1 l2 l1 l2 l4 l1 175.00 200.00 115.00 266,67 200.00 25.00 100.00 $341,000 Delta 06 l7 l6 l3 l6 l3 l5 l1 0.00 –400.00 75.00 0.00 100.00 –50.00 100.00 $135,900 Delta 07 l2 l2 l1 l3 l3 l2 l1 200.00 150.00 200.00 150.00 100.00 150.00 100.00 $620,000 Delta 08 l9 l7 l3 l6 l7 l6 l4 –325.00 –725.00 0.00 0.00 –1300.00 –600.00 –350.00 $29,000 Delta 09 l6 l2 l3 l6 l4 l4 l1 25.00 150.00 25.00 25.00 25.00 25.00 100.00 $134,900 Delta 10 l3 l1 l2 l1 l3 l2 l1 175.00 200.00 100.00 266.67 100.00 150.00 100.00 $245,000 Delta 11 l1 l1 l1 l1 l3 l1 l1 200.00 200.00 200.00 266.67 100.00 200.00 100.00 $1,300,000
1 Data from Crye-leike Realtors.
Table 6. overall scores and sale prices of the Deltas (and Alphas) evaluated
House overall score Sale price3
Alpha 1 (‘Best’)1 207.93 $3,500,000 Delta 11 164.37 $1,300,000 Delta 01 152.98 $650,000 Delta 07 147.03 $620,000 Delta 03 130.45 $398,000 Delta 05 129.42 $341,000 Delta 10 128.97 $245,000 Alpha 2 (‘good’)1 100.00 $220,000 Delta 04 49.01 $157,000 Delta 06 42.82 $135,900 Delta 09 39.60 $134,900 Alpha 3 (‘Neutral’)1 0.00 $132,150 Alpha 5 (‘Example’)2 –17.88 $129.950 Delta 02 –29.70 $74,500 Delta 08 –506.88 $29,000 Alpha 4 (‘Worst’)1 –1063.88 $1,200
1 Reference values obtained during the 4th group session. 2 Illustrative example from subsection 3.2.3.
Table
7. Partial performance, estimated sale price and error estimation for the 5 Betas evaluated
House FPV 1 FPV 2 FPV 3 FPV 4 FPV 5 FPV 6 FPV 7 Partial value FPV 1 Partial value FPV 2 Partial value FPV 3 Partial value FPV 4 Partial value FPV 5 Partial value FPV 6 Partial value FPV 7 o verall score Sale price (estimated)
1
Sale price (real)
2 Estimation error (D) 3 Beta 01 l6 l4 l2 l6 l3 l5 l1 75.00 0.00 175.00 0.00 100.00 –350.00 100.00 18.32 $133,422 a) $134,500 –0.801% Beta 02 l3 l2 l2 l1 l2 l5 l1 175.00 150.00 100.00 266.67 200.00 –100.00 100.00 100.76 $243,096 b) $240,000 +1.290% Beta 03 l7 l2 l3 l3 l3 l2 l1 0.00 150.00 0.00 225.00 175.00 150.00 100.00 100.51 $220,440 c) $225,000 –2.027% Beta 04 l8 /l9 l4 l4 l4 l4 l2 l1 –175.00 0.00 –25.00 100.00 75.00 175.00 100.00 50.01 $158,236 d) $166,000 –4.677% Beta 05 l1 l1 l1 l1 l3 l1 l1 200.00 200.00 200.00 266.67 150.00 200.00 100.00 175.26 $2,507,156 e) $2,200,000 +13.962%
1 Estimated price using linear interpolation. 2 Data from
Crye-leike Realtors.
3 Error estimation regarding the real sale price.
a) Alpha 3 and Delta 09 as references. b) Alpha 1 and Alpha 2 as references. c) Alpha 2 and Delta 10 as references.
d) Alpha 2 and Delta 04 as references. e) Alpha 1 and Alpha 2 as references.
–1063.88 –506.88 –29.7 0 0.00 18.3 2 39.6 0 42.8 2 49.0 1 50.0 1 207.93 –1200.00 –1000.00 –800.0 0 –500.0 0 –400.0 0 –200.0 0 0.00 200.0 1.200 29.000 74.500 132.150 134.500 134.900 135.900 157.000 166.000 220.000 225.000 240.000 245.000 341.000 398.000 620.000 650.000 1.300.000 2.200.000 3.500.000 128.97 100.76 100.51 100.00 129.42 130.45 147.03 152.98 164.37 175.26 Fig.
7. Value function for price estimation [
o
potential of the methodologies used and of the as-sessment system derived to bring valuable insights to the process of establishing residential housing prices. However, because in some circumstances it may be difficult to rank the overall performance of some houses, and because the implementation of the framework would require the intervention of a facilitator (i.e. the facilitator’s expertise is fun-damental in dealing with techniques that are not known among realtors), we decided to strengthen our study by performing sensitivity analyses for all FPVs. These analyses were carried out using the M-MACBETH software. Figure 8 illustrates the sensitivity analysis performed for FPV3 (con-sidered as the most important one).
As illustrated in Figure 8, the weight of FPV3 is 22.77 and the sensitivity analysis developed al-lows us to conclude that our appraisal system is strong because the FPV3’s weight can vary consid-erably without compromising the Deltas’ position and, implicitly, the value judgments of the group. Again, sensitivity analyses were carried out for all FPVs. It seems important to underline, however, that these analyses were carried out both to de-termine the stability of the proposed evaluation system and to serve as basis for recommendations. 3.3. the recommendations part
The MCDA-based framework developed in this study allows real estate professionals to: (1) dis-criminate homes according to a system that was developed based on their own experiences, percep-tions and value judgments; (2) compare perfor-mances against cognitive references (i.e. Alphas);
(3) promote discussions throughout the process, which allowed for an increase in transparency in residential real estate price estimation; and (4) show the practicality of cognitive mapping and MACBETH in the particular context of estimating real estate values.
Although the system developed in this study achieved encouraging results in terms of residen-tial real estate valuation and price estimation, namely as a result of the generalized receptive-ness revealed by the panel members, one should bear in mind that the major reason for satisfac-tion is the process itself. As previously discussed, MCDA is not outcome- but process-oriented, where a non-prescriptive position is assumed. In fact, following Wolverton and gallimore (1999), the ap-praisal framework was colored by negotiation and an experience-based learning orientation. As such, considering the versatility of the adopted technical procedures, our evaluation system may be used as a negotiation tool, which does not prescribe opti-mal solutions, but encourages discussion and pro-motes a better understanding of the evaluation factors associated with residential real estate price estimation. Furthermore, considering that results are strongly dependent on the circumstances and/ or participants involved, any generalization should be properly considered. obviously, this can always be pointed out as one of the system’s weaknesses. However, the combined use of cognitive mapping and MACBETH also offers improvement possibili-ties. Thus, we also recommend performing sensi-tivity and robustness analyses after any change in the framework.
4. DisCUssion anD ConClUsion
Accurate estimates of real estate intrinsic values are a first step preceding sale price negotiations, and are of significant interest for sellers, buyers/ investors and lending institutions. However, as dis-cussed above, residential real estate market value estimation is complex, and a number of approaches are currently used, including use of comparables and hedonic pricing models. Residential real estate prices, because of multiple and conflicting stake-holder interests, can deviate from fundamental in-trinsic values due to a variety of factors considered in a house evaluation process. This deviation is par-ticularly evident in scenarios of economic adversity, where it is imperative to understand the mecha-nisms of “internal operational performance [price estimation mechanisms]” (Wu 2012: 303).
The property valuation field has made remark-able progress where a number of flexible func-tional forms have been developed, including: non-parametric or semi-non-parametric regressions and spatial models that capture correlations within submarkets allowing for temporal asymmetry (e.g. Bourassa et al. 2010; osland 2010). However, is-sues still remain in terms of the process through which valuation criteria are defined and the way that compensation rates among criteria/attributes are calculated. We use cognitive mapping to support criteria selection, and apply MACBETH to calculate the trade-offs. We believe that this is the first work that demonstrates how to integrate cognitive map-ping and MACBETH in the real estate price estima-tion literature; and different decision makers can significantly benefit from the application of these two methodologies.
An appraisal system is developed to assist real estate professionals in estimating fair residential real estate initial offer prices. An important fea-ture of our approach is that decisions leading to asking price estimation consider the perceptions of a group of different stakeholders (e.g. realtors, sell-ers, households). This approach, in terms of esti-mating initial asking prices, may be considered an alternative to and may consider factors not usually found in hedonic applications. Another important aspect of MCDA is that value estimation responds to housing market characteristics; i.e. the way trade-offs among criteria are calculated allows for dynamism and spatial and temporal versatility. Special emphasis may also be given to the fact that our valuation system represents a process-oriented application, considering that decisions in this par-ticular context are not easily taken and greatly
depend on several individuals with different and often conflicting standpoints. From this premise, searching for optimal solutions in this particular domain seems to be unrealistic.
We provide evidence that the integration of cognitive maps and MACBETH holds significant potential for strategic planning by assisting real estate professionals in obtaining consolidated in-formation to: (1) discriminate homes according to a system that was developed based on their own experiences, perceptions and value judgments; (2) compare the relative positions of the evaluated houses against cognitive references (i.e. Alphas); and (3) promote discussions throughout the pro-cess, which allows for an increase in transparency in residential real estate price estimation.
The results of our application of cognitive mping and MCDA to real estate valuation are ap-pealing. As stated above, we advise caution when relying on the outputs due to the dependence on circumstances and locations, and the selection of professionals involved in the study. The process is inherently subjective in measurement choices and respective weighting; however, while this can be suggested as a possible shortcoming, it should also be highlighted that valuation is subjective in nature and one of the approach’s greatest contribu-tions is to make such subjectivity explicit and in-tegrated with objective data (cf. Ackermann, Eden 2001; Belton, Stewart 2002; Nowak 2011; Filipe et al. 2015).
Future research may consider: (1) increasing the number of actual sales (i.e. the system’s ef-fectiveness is yet to be confirmed by practical ap-plication on a large scale); (2) organizing a panel study with another set of decision makers in the same region to determine the robustness of the re-sults achieved; (3) organizing a panel study with-in another region to with-increase generalizability; (4) conducting a survey to receive feedback from more decision makers and, thus, increase the reliability of the results; and (5) developing a comparative essay and analyzing the results obtained from the application of other techniques in the context of this study. Furthermore, we recommend assessing the impact of the 2008–2010 financial crisis on the process of valuation of residential real estate. aCKnoWleDgMents
Previous and non-copyrighted versions of this pa-per were presented at the 28th and 29th Annual American Real Estate Society Meetings (St. Pe-tersburg Beach, Florida, April 2012; and Kohala
Coast, Big Island of Hawaii, April 2013), and at the 2015 BAI International Conference, held in Macau, China, July 2015. The authors gratefully acknowledge the institutional support of the Mem-phis Area Association of Realtors, Crye-leike Re-altors, Integra Realty Resources, and the superb contribution and infinite willingness of the panel members: Carol Ann Burns, Cheryl lamghari, Da-vid Ralph, Jamison Walter Allen, Mark Sunder-man, Ralph Allen McCool and Tommie Criswell-Jones. The authors also acknowledge David H. Downs (our discussant), Virginia Commonwealth University, for his helpful comments and sugges-tions. Financial support for this research has been provided by the Morris Fogelman Real Estate Chair Excellence, University of Memphis.
reFerenCes
Ackermann, F.; Eden, C. 2001. SoDA – journey making and mapping in practice, in J. Rosenhead, J. Min-gers (Eds.). Rational analysis for a problematic world revisited: Problem structuring methods for complex-ity, uncertainty and conflict. 2nd ed. Chichester: John
Wiley & Sons, 43–60.
Balarine, o. 2004. The use of appraisal techniques in property development, Revista Produção 14(2): 47–57.
Bana e Costa, C.; Chagas, M. 2004. A career choice prob-lem: an example of how to use MACBETH to build a quantitative value model based on qualitative value judgements, European Journal of Operational Research 153(2): 323–331. http://dx.doi.org/10.1016/ S0377–2217(03)00155–3
Bana e Costa, C.; Vansnick, J. 1994. MACBETH: an interactive path towards the construction of cardi-nal value functions, Internatiocardi-nal Transactions in Operational Research 1(4): 489–500. http://dx.doi. org/10.1016/0969–6016(94)90010–8
Bana e Costa, C.; De Corte, J.; Vansnick, J. 2005. on the mathematical foundations of MACBETH, in J. Figueira, S. greco, M. Ehrgott (Eds.). Multiple criteria decision analysis: the state of the art surveys. New york: Springer, 409–442.
Bana e Costa, C.; De Corte, J.; Vansnick, J. 2012. MAC-BETH, International Journal of Information Tech-nology and Decision Making 11(2): 359–387. http:// dx.doi.org/10.1142/S0219622012400068
Bana e Costa, C.; Ensslin, l.; Corrêa, E.; Vansnick, J. 1999. Decision support systems in action: Inte-grated application in a multicriteria decision aid process, European Journal of Operational Research
113(2): 315–335. http://dx.doi.org/10.1016/S0377–
2217(98)00219–7
Bana e Costa, C.; lourenço, J.; Chagas, M.; Bana e Cos-ta, J. 2008. Development of reusable bid evaluation models for the Portuguese electric transmission
com-pany, Decision Analysis 5(1): 22–42. http://dx.doi.
org/10.1287/deca.1080.0104
Belton, V.; Stewart, T. 2002. Multiple criteria decision analysis: an integrated approach. Dordrecht: Kluwer
Academic Publishers. http://dx.doi.org/10.1007/978–
1-4615–1495–4
Benefield, J.; Pyles, M.; Gleason, A. 2011. Sale price, marketing time, and limited service listings: the in-fluence of home value and market conditions, Jour-nal of Real Estate Research 33(4): 531–563.
Bin, o. 2004. A prediction comparison of housing sales prices by parametric versus semi-parametric regres-sions, Journal of Housing Economics 13(1): 68–84.
http://dx.doi.org/10.1016/j.jhe.2004.01.001
Bourassa, S; Cantoni, E.; Hoesli, M. 2010. Predicting house prices with spatial dependence: a comparison of alternative methods, Journal of Real Estate Re-search 32(2): 139–160.
Cheng, P.; lin, Z.; liu, y. 2011. Property delisting, housing cycle and pricing bias, Journal of Housing Economics 20(2): 152–157. http://dx.doi.org/10.1016/j. jhe.2011.02.002
Clark, T. 1995. Rents and prices of housing across ar-eas of the United States: a cross-section examina-tion of the present value model, Regional Science and Urban Economics 25(2): 237–247. http://dx.doi. org/10.1016/0166–0462(94)02066-P
Diaz, J. III.; Hansz, J. 2001. The use of reference points in valuation judgment, Journal of Property Research 18(2): 141–148.
http://dx.doi.org/10.1080/09599910110039897
Doignon, J. 1984. Threshold representations of multiple semiorders, SIAM Journal of Algebraic Discrete Meth-ods 8(1): 77–84. http://dx.doi.org/10.1137/0608005
Dorsey, R.; Hua, H.; Mayer, W.; Wang, H. 2010. Hedonic versus repeat-sales housing price indexes for meas-uring the recent boom-bust cycle, Journal of Housing Economics 19(2): 75–93. http://dx.doi.org/10.1016/j. jhe.2010.04.001
Downs, D.; güner, Z. 2013. Commercial real estate, in-formation production and market activity, Journal of Real Estate Finance and Economics 46(2): 282–298. http://dx.doi.org/10.1007/s11146–011–9348–6
Downs, D.; güner, Z. 2012. Information producers and valuation: evidence from real estate markets, Journal of Real Estate Finance and Economics 44(1/2): 167–
183. http://dx.doi.org/10.1007/s11146–010–9294–8
Dyer, R.; Forman, E. 1992. group decision support with the analytic hierarchy process, Decision Support Systems 8(2): 99–124. http://dx.doi.org/10.1016/0167– 9236(92)90003–8
Eden, C. 2004. Analyzing cognitive maps to help struc-ture issues or problems, European Journal of Op-erational Research 159(3): 673–686. http://dx.doi. org/10.1016/S0377–2217(03)00431–4
Eden, C.; Ackermann, F. 2001a. group decision and negotiation in strategy making, Group Decision and Negotiation 10(2): 119–140. http://dx.doi. org/10.1023/A:1008710816126
Eden, C.; Ackermann, F. 2001b. SoDA – the principles, in J. Rosenhead, J. Mingers, (Eds.). Rational analysis for a problematic world revisited: problem structuring methods for complexity, uncertainty and conflict. 2nd
Eden, C.; Banville, C. 2003. Construction d’une vision stratégique au moyen de la cartographie cogni-tive assisté par ordinateur, in P. Cossette, (Eds.). Cartes cognitives et organisations. les Éditions de l’ADREg, France.
Englund, P.; Quigley, J.; Redfearn, C. 1998. Improved price indexes for real estate: measuring the course of Swedish housing prices, Journal of Urban Eco-nomics 44(2): 171–196. http://dx.doi.org/10.1006/ juec.1997.2062
Ettema, D. 2011. A multi-agent model of urban process-es: modelling relocation processes and price setting in housing markets, Computers, Environment and Urban Systems 35(1): 1–11.
http://dx.doi.org/10.1016/j.compenvurbsys.2010.06.005
Ferreira, F.; Jalali, M.; Meidutė-Kavaliauskienė, I.; Viana, B. 2015. A metacognitive decision making based-approach to bank customer loyalty measure-ment and managemeasure-ment, Technological and Eco-nomic Development of Economy 21(2): 280–300. http://dx.doi.org/10.3846/20294913.2014.981764
Ferreira, F.; Santos, S.; Rodrigues, P. 2011a. Adding value to bank branch performance evaluation using cognitive maps and MCDA: a case study, Journal of the Operational Research Society 62(7): 1320–1333. http://dx.doi.org/10.1057/jors.2010.111
Ferreira, F.; Santos, S.; Rodrigues, P. 2011b. From tradi-tional operatradi-tional research to multiple criteria deci-sion analysis: basic ideas on an evolving field, Prob-lems and Perspectives in Management 9(3): 114–121. Ferreira, F.; Santos, S.; Rodrigues, P.; Spahr, R. 2014a.
Evaluating retail banking service quality and con-venience with MCDA techniques: a case study at the bank branch level, Journal of Business Economics and Management 15(1): 1–21. http://dx.doi.org/10.38 46/16111699.2012.673504
Ferreira, F.; Santos, S.; Rodrigues, P.; Spahr, R. 2014b. How to create indices for bank branch financial per-formance measurement using MCDA techniques: an illustrative example, Journal of Business Economics and Management 15(4): 708–728.
http://dx.doi.org/10.3846/16111699.2012.701230
Ferreira, F.; Spahr, R.; Santos, S.; Rodrigues, P. 2012. A multiple criteria framework to evaluate bank branch potential attractiveness, International Journal of Strategic Property Management 16(3): 254–276. http://dx.doi.org/10.3846/1648715X.2012.707629
Filipe, M.; Ferreira, F.; Santos, S. 2015. A multiple cri-teria information system for pedagogical evaluation and professional development of teachers, Journal of the Operational Research Society, 66: 1769–1782. http://dx.doi.org/10.1057/jors.2014.129
Fischer, D. 2003. Multi-criteria analysis of ranking pref-erences on residential traits, in Proceedings of the 10th European Real Estate Society Conference, 10–13 June 2003, Helsinki, Finland.
http://dx.doi.org/10.15396/eres2003_154
gonzález, M.; Formoso, C. 1995. Estimativa de modelos de preços hedônicos para locação residencial em Por-to Alegre, Revista Produção 5(1): 65–77.
http://dx.doi.org/10.1590/s0103–65131995000100004
gouriéroux, C.; laferrère, A. 2009. Managing hedon-ic housing prhedon-ice indexes: the French experience,
Journal of Housing Economics 18(3): 206–213. http://dx.doi.org/10.1016/j.jhe.2009.07.012
guo, H.; li, H.; Shen, Q; Wang, y.; li, y. 2007. Real estate confidence index based on Web GIS and SPSS WebAPP, International Journal of Project Manage-ment 25(2): 171–177. http://dx.doi.org/10.1016/j.ijpro-man.2006.09.015
Hjalmarsson, E.; Hjalmarsson, R. 2009. Efficiency in housing markets: which home buyers know how to discount?, Journal of Banking & Finance
33(11): 2150–2163.
http://dx.doi.org/10.1016/j.jbank-fin.2009.05.014
Hongyu, l.; yue, S. 2005. Housing prices and general economic conditions: an analysis of Chinese new dwelling market, Tsinghua Science and Technol-ogy 10(3): 334–343. http://dx.doi.org/10.1016/S1007– 0214(05)70078-X
Jacquet-lagrèze, E.; Siskos, y. 2001. Preference disag-gregation: 20 years of MCDA experience, European Journal of Operational Research 130(2): 233–245. http://dx.doi.org/10.1016/S0377–2217(00)00035–7
Junior, H. 2008. Multicriteria approach to data envelop-ment analysis, Pesquisa Operacional 28(2): 231–242. Keeney, R. 1992. Value-focused thinking: a path to creative
decisionmaking. Harvard: Harvard University Press. Malienė, V. 2011. Specialised property valuation:
mul-tiple criteria decision analysis, Journal of Retail & Leisure Property 9(5): 443–450.
http://dx.doi.org/10.1057/rlp.2011.7
Malienė, V.; Deveikis, S.; Kirsten, L.; Malys, N. 2010. Commercial leisure property valuation: a compari-son of the case studies in UK and lithuania, Inter-national Journal of Strategic Property Management
14(1): 35–48. http://dx.doi.org/10.3846/ijspm.2010.04
Nowak, M. 2011. Interactive multicriteria decision aid-ing under risk: methods and applications, Journal of Business Economics and Management 12(1): 69–91. http://dx.doi.org/10.3846/16111699.2011.555366
osland, l. 2010. An application of spatial econometrics in relation to hedonic house price modeling, Journal of Real Estate Research 32(3): 289–320.
Pace, K.; Barry, R.; gilley, o.; Sirmans, C. 2000. A meth-od for spatial-temporal forecasting with an applica-tion to real estate prices, Internaapplica-tional Journal of Forecasting 16(2): 229–246. http://dx.doi.org/10.1016/ S0169–2070(99)00047–3
Peterson, S.; Flanagan, A. 2009. Neural network hedonic pricing models in mass real estate appraisals, Jour-nal of Real Estate Research 31(2): 147–164.
Quigley, J. 1995. A simple hybrid model for estimat-ing real estate price indexes, Journal of Housestimat-ing Economics 4(1): 1–12. http://dx.doi.org/10.1006/ jhec.1995.1001
Quigley, J. 2006. Real estate portfolio allocation: the Eu-ropean consumers’ perspective, Journal of Housing Economics 15(3): 169–188. http://dx.doi.org/10.1016/j. jhe.2006.09.003
Santos, S.; Belton, V.; Howick, S. 2002. Adding value to performance measurement by using systems dynam-ics and multicriteria analysis, International Journal of Operations & Production Management 22(11): 1246–
Schulz, R.; Werwatz, A. 2011. Is there an equilibrating relationship between house prices and replacement cost? Empirical evidence from Berlin, Journal of Ur-ban Economics 69(3): 288–302.
http://dx.doi.org/10.1016/j.jue.2010.12.003
Shin, W-J.; Saginor, J.; Van Zandt, S. 2011. Evaluating subdivision characteristics on single-family housing value using hierarchical linear modeling, Journal of Real Estate Research 33(3): 317–348.
Smith, B. 2006. The impact of tax increment finance districts on localized real estate: evidence from Chi-cago’s multifamily markets, Journal of Housing Economics 15(1): 21–37. http://dx.doi.org/10.1016/j. jhe.2006.02.003
Suedel, B.; Kim, J.; Banks, C. 2009. Comparison of the direct scoring method and multi-criteria decision analysis for dredged material management decision making [online]. ERDC – Engineer Research and
De-velopment Center. Available at: http://el.erdc.usace.
army.mil/elpubs/pdf/doerr13.pdf [accessed February 2015].
Wolverton, M.; gallimore, P. 1999. Client feedback and
the role of the appraiser, Journal of Real Estate Re-search 18(3): 415–431.
Wu, H. 2012. Constructing a strategy map for banking institutions with key performance indicators of the balanced scorecard, Evaluation and Program Plan-ning 35(3): 303–320.
http://dx.doi.org/10.1016/j.evalprogplan.2011.11.009
Wu, J.; gyourko, J.; Deng, y. 2011. Evaluating condi-tions in major Chinese housing markets, Regional Science and Urban Economics 42(3): 531–543. http://dx.doi.org/10.1016/j.regsciurbeco.2011.03.003
yan, y.; Wei, X.; Hui, B.; yang, S.; Wen, Z.; Hong, y.; Shou-yang, W. 2007. Method for housing price fore-casting based on TEI@I methodology, Systems Engi-neering – Theory & Practice 27(7): 1–9.
Zavadskas, E.; Ginevičius, R.; Kaklauskas, A.; Ba-naitis, A. 2005. Analysis and modeling of the lithu-anian real estate sector, Journal of Business Eco-nomics and Management 6(3): 135–143.
Zhou, y.; Haurin, D. 2010. on the determinants of house value volatility, Journal of Real Estate Research 32(4): 377–395.


![Fig. 8. Sensitivity analysis [FPV 3 ]](https://thumb-eu.123doks.com/thumbv2/123dok_br/19254816.977214/13.871.215.681.86.396/fig-sensitivity-analysis-fpv.webp)