Repositório ISCTE-IUL
Deposited in Repositório ISCTE-IUL: 2018-12-12
Deposited version: Post-print
Peer-review status of attached file: Peer-reviewed
Citation for published item:
Paulo, M. M., Rita, P., Oliveira, T. & Moro, S. (2018). Understanding mobile augmented reality adoption in a consumer context. Journal of Hospitality and Tourism Technology. 9 (2), 142-157
Further information on publisher's website: 10.1108/JHTT-01-2017-0006
Publisher's copyright statement:
This is the peer reviewed version of the following article: Paulo, M. M., Rita, P., Oliveira, T. & Moro, S. (2018). Understanding mobile augmented reality adoption in a consumer context. Journal of
Hospitality and Tourism Technology. 9 (2), 142-157, which has been published in final form at https://dx.doi.org/10.1108/JHTT-01-2017-0006. This article may be used for non-commercial purposes in accordance with the Publisher's Terms and Conditions for self-archiving.
Use policy
Creative Commons CC BY 4.0
The full-text may be used and/or reproduced, and given to third parties in any format or medium, without prior permission or charge, for personal research or study, educational, or not-for-profit purposes provided that:
• a full bibliographic reference is made to the original source • a link is made to the metadata record in the Repository • the full-text is not changed in any way
The full-text must not be sold in any format or medium without the formal permission of the copyright holders. Serviços de Informação e Documentação, Instituto Universitário de Lisboa (ISCTE-IUL)
Av. das Forças Armadas, Edifício II, 1649-026 Lisboa Portugal Phone: +(351) 217 903 024 | e-mail: [email protected]
Understanding mobile augmented reality adoption in a consumer
context
Abstract Purpose
The aim of this study is to further our knowledge of what influences users to adopt Mobile Augmented Reality in Tourism (MART). A conceptual model is proposed, combining the extension of Unified Theory of Acceptance and Usage of Technology (UTAUT2) with Task Technology Fit (TTF), to explain behavioural intention and user behaviour of MART adopters.
Design/methodology/approach
A questionnaire was completed by a sample of 335 respondents in Portugal. Both UTAUT2 and TTF were combined into a new model from which several hypotheses were drawn based upon the literature.
Findings
The results have shown that the model explains 72% of the variance in behaviour intention to use MART and 45% of the variance in user behaviour.
Originality/value
MART is becoming increasingly known to travellers as it provides the user diverse and useful information with a real relationship with the world. By studying behaviour and what influences consumers to use MART, this study aims to advance the research into new technologies in tourism.
Keywords:
1. Introduction
As the use of Augmented Reality (AR) travel applications continues to grow, it is crucial to understand what is important to tourists who are using or intend to use AR, with the purpose of reaching out to those who would be less likely to use it. Therefore, further research would be helpful in developing and evaluating Mobile Augmented Reality in Tourism (MART) to satisfy tourist behaviour needs (Olsson et al., 2011). Consequently, the main objective of this research is to determine what influences users to adopt MART.
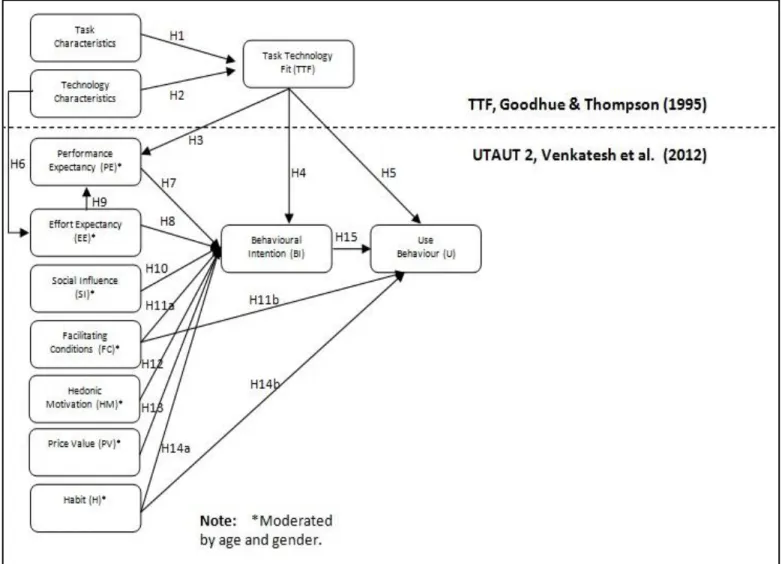
This study proposes to integrate two theories: (1) the Task Technology Fit (TTF) model that states that individuals adopt a technology based on the fit between the technological characteristics and task requirements (Goodhue and Thompson, 1995); and (2) the Unified Theory of Acceptance and Usage of Technology, UTAUT (Venkatesh et al., 2003) and UTAUT2 (Venkatesh et al., 2012), which analyses interactions of users using a technology and the consequent user behaviour.
This research aims to understand MART adoption through the application of two solidly grounded models, UTAUT2 and TTF. The integrated framework based on the two models provides an overview of the relevance of MART to tourism, as technology evolves to meet requirements of consumers and their uptake of immersive and engaging technological solutions that capture their attention.
2. Literature Review
2.1. Mobile Augmented Reality in Tourism (MART)
Mobile augmented reality offers the user the possibility of having a live view of their surroundings augmented with additional practical information (Kourouthanassis et al., 2014), making it possible to discover, amongst other things, museums and monuments, locations, restaurants, attractions and accommodation. Convenient information can also be obtained based on preferences and context such as Wi-Fi spots, ATMs, car parks, transportation, local news and weather (Chen, 2014).
Some of these applications allow users to create a list of their preferred points of interest (POI), tailoring information according to both preferences and context (Trojan, 2016). Moreover, since population cannot be offline these services are offering customers an immediate connection through social networks, where they may exchange information and tips (Kounavis et al., 2012).
The use of MARTs can leverage a tourist experience allowing the visitor to be more creative (Richards, 2011) and spontaneous (Wang et al, 2012). MART has been studied by some researchers, with results suggesting direct benefits for the understanding of the surrounding environment when visiting a tourist location (e.g., Lashkari et al., 2010). Nevertheless, some drawbacks often occur in mobile applications which limit user experience and context awareness, such as the lack of adaptive visualization of contents regarding the immediate surroundings (Yovcheva et al., 2012).
2.2. Technology acceptance
The unified theory of acceptance and use of technology (UTAUT) was developed to study the use of technology in an organizational context by proposing four key constructs: performance expectancy; effort expectancy; social influence and facilitating conditions as direct determinants of behaviour intention and use behaviour (Venkatesh et al., 2003). These authors have also introduced constructs of age, gender, experience
and voluntariness of use acting as moderators on the impact of the four independent key constructs on the two dependent constructs.
Venkatesh et al. (2012) also developed UTAUT2, which extended the earlier theory by incorporating three additional variables: hedonic motivation; price value and habit. Consequently, this updated version is more appropriate for studying technology adoption from a consumer point of view. The hedonic motivation is crucial in consumer product or technology use (Dickinger et al., 2006), and its addition complements the strongest predictor of UTAUT which emphasizes utility. Moreover, the authors of UTAUT2 argued that adding a construct related to price or cost would complement the previous model, which was only focused on time and effort. Finally, they found that habit had a significant relationship with consumer behavioural intention and actual use of mobile Internet services.
The TTF model states that individuals adopt a technology based on the fit between the technology characteristics and the task requirements (Goodhue and Thompson, 1995). Specifically, users will not adopt an advanced technology if it does not fit with their tasks and consequently cannot improve their performance (Junglas et al., 2008; Lee et al., 2007).
Law et al. (2014) pointed out the critical relevance of mobile technology adoption in hospitality and tourism. The more recent study by Ukpabi and Karjaluoto (2016) analysed 71 studies published from 2005 to 2016 on e-tourism technology acceptance, where five of them adopted UTAUT. Interestingly, the same authors concluded that research into mobile technology acceptance in tourism is not widespread. The adoption of augmented reality in tourism was also studied by Tom Dieck and Jung (2015) and Jung et al. (2016) in a museum tour application, with their findings revealing several dimensions that need to be incorporated in mobile solutions to improve tourist acceptance, including price value and facilitating conditions
3. Conceptual Framework
Ultimately as TTF might determine performance expectancy (PE), Behavioural Intention (BI) and Use Behaviour (U), this study proposes to test UTAUT2 in MART,
adding the task technology fit framework to the model. Below, each of the constructs of TTF and UTAUT2 are defined (Figure 1).
Gebauer and Ginsburg (2009) noted that task technology fit of mobile information systems is determined by task characteristics and technology performance, leading to the following hypotheses:
4.
Task technology fit impacts user performance expectancy (Schrier et al., 2010). If a user demands fast, convenient and ubiquitous tourist services, the user is likely to feel that MART is helpful and therefore improves their performance.
A good task technology fit will improve Behavioural Intention (BI) and Use Behaviour (U), whereas a poor task technology fit will decrease user adoption intention (Lee et al., 2007).
5.
Technology characteristics affect advantages of MART such as ubiquity and immediacy, allowing users to discover relevant information and therefore reducing their time and effort (Zhou at al., 2010).
H1: The influence of Task Characteristics will be positive on Task Technology fit.
H2: The influence of Technology Characteristics will be positive on Task Technology fit.
H3: The influence of Task Technology Fit will be positive on user’s Performance Expectancy (PE).
H4: The influence of Task Technology Fit will be positive on Behavioural Intention.
H5: The influence of Task Technology Fit will be positive on User Behaviour.
H6: The influence of Technology Characteristics will be positive on user Effort Expectancy (EE).
Performance Expectancy (PE) on using MART can be defined as the degree to which a user believes that using that service is helping them perform certain tasks (Venkatesh at al., 2003).
According to UTAUT, effort expectancy (EE) can be defined as the degree of ease associated with the use of a MART. It positively determines Behavioural Intention (BI) (Venkatesh at al., 2003). Furthermore, Effort Expectancy (EE) affects Performance Expectancy (PE). If users feel that MART is easy to work with and does not demand much effort, they will have high expectations towards performance.
Social Influence (SI) is similar to the subjective form of TRA (Venkatesh at al., 2003) and reflects the effort of environmental factors, such as the opinions of friends, relatives and work superiors of users (Lopez-Nicolas et al., 2008). Their opinions affect the intention of users to adopt MART (Zhou et al., 2010).
Facilitating Conditions (FC) are similar to perceived behavioural control of TPB and reflects the effect of technical infrastructure to support MART, such as user knowledge, ability and resources (Venkatesh et al. 2003; Venkatesh et al. 2012). It influences behaviour intention, and therefore user behaviour.
H7: The influence of Performance Expectancy (PE) on Behavioural Intention (BI) will be positive and moderated by age and gender.
H8: The influence of Effort Expectancy (EE) on Behavioural Intention (BI) will be positive and moderated by age and gender.
H9: The influence of Effort Expectancy (EE) on Performance Expectancy (PE) will be positive and moderated by age and gender.
H10: The influence of Social Influence (SI) on Behavioural Intention (BI) will be positive and moderated by age and gender.
H11a: The influence of Facilitating Condition (FC) on Behavioural Intention (BI) will be positive and moderated by age and gender.
H11b: The influence of Facilitating Condition (FC) on Technology Use (U) will be positive and moderated by age and gender.
Hedonic motivation (HM) that can be defined as the fun or pleasure felt from using a technology (Venkatesh et al., 2012) has been shown to play an important role in determining technology acceptance and use. In the consumer context, hedonic motivation has also been found to play an important role in technology acceptance and use (Brown and Venkatesh, 2005). Therefore, hedonic motivation is added as a predictor of the intentions of consumers to use MART.
The price value (PV) is positive when the benefits of using a technology are perceived The price value (PV) is positive when the benefits of using a technology are perceived to be greater than monetary cost and such price value has a positive impact on intention (Venkatesh et al., 2012). In the case of MART, consumers usually bear the monetary cost of the data transferred over the internet. Thus, this factor must be considered.
Habit is a perceptual construct that reflects results of prior experiences (Venkatesh et al., 2012). Also, Kim and Malhotra (2005) found out that prior use was a strong predictor of future technology use.
To maintain the consistency with the underlying theory for all of the intention models, it is expected that behavioural intention will have a significant positive effect on technology use behaviour (Venkatesh et al., 2003).
H12: The influence of Hedonic Motivation (HM) on Behavioural Intention (BI) will be positive and moderated by age and gender.
H13: The influence of Price Value (PV) on Behavioural Intention (BI) will be positive and moderated by age and gender.
H14a: The influence of Habit (H) on Behavioural Intention (BI) will be positive and moderated by age and gender.
H14b: The influence of Habit (H) on Technology Use (U) will be positive and moderated by age and gender.
H15: Behavioural Intention (BI) will have a significant positive influence on Use Behaviour (U).
4. Research Methodology
All measurement items were adopted, with slight modifications, from the literature (Table 1). These were measured using a seven-point Likert scale, ranging from strongly disagree (1) to strongly agree (7). The developed questionnaire was first validated through a pilot survey (30 respondents). After clicking on the questionnaire URL, a page appeared with a message describing the objective of this research and a video presenting MART. Of the 402 received responses, 335 were considered valid for statistical treatment (Table 2).
When comparing the sample distributions of the first and second respondent groups, using the Kolmogorov-Smirnov (K-S) test, no non-response bias was found (Ryans, 1974). Furthermore, common method bias was also analysed using Harman’s one-factor-test (Podsakoff et al., 2003), and found to be of no significance in the data set.
5. Data Analysis and Results
To analyse the relationships defined in the research model, Smart PLS 2.0 M3 (Ringle et al., 2005) was used for three different reasons: (i) not all items in the data were distributed normally (p < 0.01 based on Kolmogorov-Smirnov’s test); (ii) the research model had not been previously developed; and (iii) the research model was considered to be complex.
Table 3 presents the loadings, t-values, average variance extracted (AVE), composite reliability (CR) and Cronbach’s alpha (CA). Since the reliability indicator loadings must be greater than 0.7 (Henseler et al., 2009), the items FC4 (0.68), U4 (0.56), U5 (0.56), and U6 (0.66) were excluded as they presented a lower value than that required and were lacking statistical evidence. All items were statistically significant at 1% according to the analysis of the t-statistics values collected from bootstrapping with 500 iterations. To measure the reliability of the constructs, two indicators were taken into account: Composite Reliability (CR) and Cronbach’s Alpha (CA). According to Hair et al. (2010), CR evaluates the reliability and internal consistency of each construct and the
extent to which the items represent the underlying constructs. CA provides an estimate of the reliability, taking into account the indicator inter-correlations and assuming that all indicators are equally reliable (Henseler et al., 2009). As seen in Table 3, CR and CA for each construct were above the expected threshold of 0.7, thus showing evidence of internal consistency.
To assure convergent validity, AVE was examined. It must be greater than 0.5 meaning that the latent variable explains more than half of the variance of its indicators (Henseler et al., 2009). The AVE of each construct was above the expected threshold of 0.5, hence confirming convergent validity.
Finally, to test discriminant validity of the constructs the data present in Table 4 must be evaluated through two criteria: Fornell-Larker measure and cross-loadings. The first theorises that the square root of AVE must be greater than the correlations between the construct (Henseler et al., 2009), while the second requires that the loading of each indicator must be greater than all the cross-loadings (Chin, 1998). As presented in Table 4, the square roots of AVE (elements exhibited in the diagonal) were higher than the correlation between each pair of constructs (elements exhibited off-diagonal). Moreover, our findings confirmed that the patterns of loadings were greater than the cross-loadings, consequently both measures were satisfied.
In summary, the proposed conceptual model has reliability, convergent validity and discriminant validity. Thus, the constructs can be used to test the research model.
To initiate the analysis of the model it is important to verify if Chin’s (1998) theory is applied, i.e. all r-squares presented are above 0.2. Task Technology Fit, Performance Expectancy, Effort Expectancy, Behavioural Intention and Use Behaviour were 0.59, 0.43, 0.24, 0.72 and 0.45, respectively, and therefore this measure was consistent in the research model.
Table 5 summarizes the results of PLS estimation and findings revealed that not all of the constructs were statistically significant – according to the calculated t-values derived from bootstrapping (500 iterations).
Task Characteristics ( = 0.17; p < 0.01) and Technology Characteristics ( = 0.49; p < 0.01) were statistically significant in explaining Task Technology Fit (TTF). Furthermore, TTF was statistically significant in explaining Behavioural Intention ( =
0.14; p < 0.01) for Mobile Augmented Reality in Tourism (MART), and also showed to have a positive impact on Performance Expectancy ( = 0.37; p < 0.01). Technology Characteristics ( = 0.66; p < 0.01) was also used to explain Effort Expectancy.
Regarding UTAUT2, not all direct effects were statistically significant. Performance Expectancy ( = 0.11; p < 0.10), Facilitating Conditions ( = 0.15; p < 0.01), Hedonic Motivation ( = 0.21; p < 0.01), and Habit ( = 0.38; p < 0.01) were significant in explaining Behavioural Intention to use MART, whereas Effort Expectancy, Social Influence and Price Value were not. Also, TTF had good indices ( = 0.14; p < 0.01) for explaining Behavioural Intention to use MART. It is also important to note that Effort Expectancy ( = 0.40; p < 0.01) was confirmed to explain Performance Expectancy. Ultimately, all indicators explaining future usage of MART were confirmed, TTF ( = 0.29; p < 0.01), Habit ( = 0.31; p < 0.01) and Behavioural Intention ( = 0.15; p < 0.10), except one – Facilitating Conditions.
Concerning UTAUT2 moderators (age and gender), they did not reach the relevant value ( ≥ 1.65; p ≤ 0.10) in any construct to be statistically significant in the research model.
6. Discussion and conclusions
6.1.Conclusions
Figure 2 shows the outcomes of the hypotheses tested. The research model proposed explains 59% of variation in TTF of MART, which therefore explains (with UTAUT2 constructs) 72% and 45% of variation in Behavioural Intention (BI) and Use Behaviour (U) of MART, respectively. TTF also explains 43% of variation in performance expectancy. Technology Characteristics is also able to explain 24% of variation in Effort Expectancy (EE). TTF has been used to study the adoption of emerging Internet services - but people are willing to adopt them only if they meet their requirements and consequently improve their performance (Lee et al., 2007; Junglas et al., 2008). Thus, this study results are in accordance with previous studies (Zhou et al., 2010).
6.2.Theoretical implications
Findings show that Facilitating Conditions (FC) have low influence on the intention to use (H11a) and may even not influence use behaviour (H11b), contrasting with UTAUT2 premises. Interestingly, this result is in line with the study by San Martín and Herrero (2012), which evaluated the online purchase intentions of rural accommodation by tourists, when compared to other contexts such as hospital services (Aggelidis and Chatzoglou, 2009) who found FC to influence behaviour. Such results may be explained by the maturity of tourists regarding technological innovations being at ease with mobile applications (Ukpabi and Karjaluoto, 2016). Aligned with this finding is the discovery of a correlation between TTF and UTAUT2 constructs, as Technology Characteristics strongly influence EE, suggesting that a higher level of technological maturity in mobile application users overshadows facilitating conditions, thus less effort is required by users.
The results regarding EE, Social Influence (SI), and Price Value (PV) over Behavioural Intention (BI) suggest that respondents are neither concerned with the effort taken to use MART, nor with the opinion of others – relatives, friends and colleagues – concerning these technologies or their price. Finally, considering the effects on Use Behaviour, all constructs (TTF, Habit, and BI) were significant except FC, meaning that respondents are not considering possible difficulties that may arise when adopting this technology. This further highlights the specific nature of MART, which is yet to be thoroughly studied when compared to acceptance of other mobile technologies (Han et al., 2013).
6.3.Practical implications
MART service providers should invest in studying the market with the objective of understanding the consumer types they might reach and how to please them. A tourist who is enjoying moments of spontaneity only wants to obtain the necessary information at that moment and in that place.
Despite the analysis of the moderators not reaching a significant value for the influencing part of the path analysed, a significant value was obtained regarding age over Behavioural Intention (BI), leading to the first recommendation to management to analyse the users and cluster them by age groups. People in different stages of life think differently and have specific demands and needs (i.e., a student travelling is usually more concerned with the money spent, while a professional in a mature phase of their career might prefer a user-friendly platform which offers easy access to cultural information).
Moreover, it is important to understand that consumers are becoming more demanding, and an easier way to please and captivate them could be to provide a service that is able to offer practical uses. The user feels more enthusiastic (Hedonic Motivation – HM) about using an application that shows its usefulness (Performance Expectancy – PE), and with technological developments (Facilitating Conditions – FC) an application can start helping even before the beginning of the tourist journey. Prior to a trip, users must always plan and book something (i.e., what to pack, which transport to take, book a hotel), or if they decide to make their own way, they will eventually need a navigation system. They will want to know about which places to visit, where to taste the best food and how to exploit the area (i.e. cultural guidance, restaurant advice, events in town). Consequently, communication will certainly be required when looking for specific information that cannot be easily found or simply cannot be understood in foreign language. In this case immediate translation tools would be extremely useful). In order to remember and document the trip an application selecting the best moments could give the tourist a perfect souvenir.
These applications are still in development stages, but if the tourist could get all of these services together and have the opportunity to use them, certainly MART could become part of a tourist life (TTF, BI and Habit over U).
Finally, both suppliers and tourists can benefit from the adoption of these services providing efficiency and convenience for both sides. The tourism sector can always have a line of communication to their clients whilst attracting new customers. Meanwhile tourists can see their lives simplified in various ways, giving them time to experience what they enjoy most when travelling.
6.4.Limitations and future research
While the 335 responses provided a significant overview of MART acceptance, further studies are required using a larger sample of responses to confirm the above findings. In addition, this study could be replicated in future studies in other geographical areas. Moreover, once developed, specific mobile augmented reality in tourism applications could be tested in order to assess their potential adoption by tourists. This could address not only segmentation analysis from a consumer perspective but also the classification of different solutions according to their characteristics and perceived benefits of their usage.
References
Aggelidis, V.P. and Chatzoglou, P.D. (2009), “Using a modified technology acceptance model in hospitals”, International Journal of Medical Informatics, Vol.78 No.2, pp.115-126. Brown, S.A. and Venkatesh, V. (2005), “Model of Adoption of Technology in the Household: A
Baseline Model Test and Extension Incorporating Household Life Cycle”, MIS Quartely, Vol.29 No.4, pp.399-426.
Brislin, R.W. (1970), “Back-Translation for Cross-Cultural Research”, Journal of Cross-Cultural Psychology, Vol.1 No.3, pp.185-216.
Chen, W. (2014), “Historical Oslo on a handheld device – A mobile augmented reality application”, Procedia Computer Science, Vol.35, pp.979-985.
Chin, W.W. (1998), “Issues and opinion on structural equation modeling”, MISQuartely, Vol.22, No.1, pp.6-15.
Dickinger, A., Arami, M. and Meyer, D. (2006), “Reconsidering the adoption process: enjoyment and social norms—antecedents of hedonic mobile technology use”, in Proceedings of the 39th Annual Hawaii International Conference on System Sciences, 2006. HICSS'06, IEEE.
Gebauer, J. and Ginsburg, M. (2009), “Exploring the black box of task-technology fit”, Communications of the ACM, Vol.52 No.1, pp.130-135.
Goodhue, D.L. and Thompson, R.L. (1995), “Task-technology fit and individual performance”, MIS Quartely, Vol.19 No.2, pp.213-236.
Hair, J.F.J., Black, W.C., Babin, B.J. and Anderson, R.E. (2010), Multivariate Data Analysis (7th Edition), Prentice Hall, New Jersey, USA.
Han, D.I., Jung, T. and Gibson, A. (2013), “Dublin AR: implementing augmented reality in tourism”, in Information and communication technologies in tourism 2014, Springer, pp.511-523.
Hannam, K., Butler, G. and Paris, C. (2013), “Developments and key issues in tourism mobilities”, Annals of Tourism Research, Vol.44, pp.171-185.
Henseler, J., Ringle, C.M. and Sinkovics, R.R. (2009), “The use of partial least squares path modeling in international marketing”, Advances in International Marketing, Vol.20, pp.277-319.
Im, I., Hong, S. and Kang, M.S. (2011), “An international comparison of technology adoption: Testing UTAUT model”, Information & Management, Vol.48 No.1, pp.1-8.
Jung, T., tom Dieck, M.C., Lee, H. and Chung, N. (2016), “Effects of virtual reality and augmented reality on visitor experiences in museum”, in Information and Communication Technologies in Tourism 2016, Springer, pp.621-635.
Junglas, I., Abraham, C. and Watson, R.T. (2008), “Task-technology fit for mobile locatable information systems”, Decision Support Systems, Vol.45 No.4, pp.1046-1057.
Kim, S.S. and Malhotra, N.K. (2005), “A Longitudinal Model of Continued IS Use: An Integrative View of Four Mechanisms Underlying Post-Adoption Phenomena”, Management Science, Vol.51 No.5, pp.741-755.
Kounavis, C., Kasimati, A. and Zamani, E. (2012), “Enhancing the tourism experience through mobile augmented reality: Challenges and prospects”, International Journal of Engineering Business Management, Vol.4, pp.1-6.
Kourouthanassis P., Boletsis C., Bardaki C. and Chasanidou, D. (2014), “Tourists responses to mobile augmented reality travel guides: The role of emotions on adoption behavior”, Pervasive and Mobile Computing, Vol.18, pp.71-87.
Law, R., Buhalis, D. and Cobanoglu, C. (2014), “Progress on information and communication technologies in hospitality and tourism”, International Journal of Contemporary Hospitality Management, Vol.26 No.5, pp.727-750.
Lashkari, A.H., Parhizkar, B. and Mohamedali, M.A. (2010), “Augmented reality tourist catalogue using mobile technology”, in Second International Conference on Computer Research and Development, IEEE, pp.121-125.
Lee, C.C., Cheng, H.K. and Cheng, H.H. (2007), “An empirical study of mobile commerce in insurance industry: Task-technology fit and individual differences”, Decision Support Systems, Vol.43 No.1, pp.95-110.
Lopez-Nicolas, C., Molina-Castillo, F.J. and Bouwman, H. (2008), “An assessment of advanced mobile services acceptance: Contributions from TAM and diffusion theory models”, Information & Management, Vol.45 No.6, pp.359-364.
Martins, C., Oliveira, T. and Popovic, A. (2014), “Understanding the Internet banking adoption: A unified theory of acceptance and use of technology and perceived risk application”, International Journal of Information Management, Vol.34 No.1, pp.1-13.
Olsson, T., Lagerstam, E., Karkkainen, T. and Vaananen-Vainio-Mattila, K. (2013), “Expected user experience of mobile augmented reality services: a user study in the context of shopping centres”, Personal and Ubiquitous Computing, Vol.17 No.2, pp.287-304.
Podsakoff, P.M., MackKenzie, S.B., Lee, J.-Y. and Podsakoff, N.P. (2003), “Common method biases in behavioral research: a critical review of the literature and recommended remedies”, Journal of Applied Psychology, Vol.88 No.5, pp.879-903.
Richards, G. (2011), “Creativity and tourism: The state of the art”, Annals of Tourism Research, Vol.38 No.4, pp.1225-1253.
Ringle, C.M., Wende, S. and Will, A. (2005), SmartPLS 2.0 (M3), Beta, Hamburg,Germany. Ryans, A.B. (1974), “Estimating consumer preferences for a new durable brand in an established
product class”, Journal of Marketing Research, pp.434-469.
San Martín, H. and Herrero, Á. (2012), “Influence of the user’s psychological factors on the online purchase intention in rural tourism: Integrating innovativeness to the UTAUT framework”, Tourism Management, Vol.33 No.2, pp.341-350.
Schrier, T., Erdem, M. and Brewer, P. (2010), “Merging task-technology fit and technology acceptance models to assess guest empowerment technology usage in hotels”, Journal of Hospitality and Tourism Technology, Vol.1 No.3, pp.201-217.
tom Dieck, M.C. and Jung, T. (2015), “A theoretical model of mobile augmented reality acceptance in urban heritage tourism”, Current Issues in Tourism, doi:10.1080/13683500.2015.1070801.
Trojan, J. (2016), “Integrating AR services for the masses: geotagged POI transformation platform”, Journal of Hospitality and Tourism Technology, Vol.7 No.3, pp.254-265. Ukpabi, D.C. and Karjaluoto, H. (2016), “Consumers’ acceptance of information and
communications technology in tourism: A review”, Telematics and Informatics, doi:10.1016/j.tele.2016.12.002.
Venkatesh, V., Morris, M.G., Davis, G.B. and Davis, F.D. (2003), “User acceptance of information technology: Toward a unified view”, MIS Quarterly, Vol.27 No.3, pp.425-478.
Venkatesh, V., Thong, J.Y. and Xu, X. (2012), “Consumer acceptance and use of information technology: extending the unified theory of acceptance and use of technology”, MIS Quartely, Vol.36 No.1, pp.157-178.
Wang, D., Park, S. and Fesenmaier, D. (2012), “The role of smartphones in mediating the touristic experience”, Journal of Travel Research, Vol.51 No.4, pp.371-387.
Yovcheva, Z., Buhalis, D. and Gatzidis, C. (2012), “Overview of smartphone augmented reality applications for tourism”, e-Review of Tourism Research (eRTR), Vol.10 No.2, pp.63-66. Zhou, T., Lu, Y. and Wang, B. (2010), “Integrating TTF and UTAUT to explain mobile banking
Table 1 - Items for all constructs.
Constructs Items Source
Performance Expectancy (PE)
I find mobile internet useful in my touristic activities PE1
Venkatesh et al. (2003), Venkatesh et al.
(2012) I think that mobile internet increases my chances of
achieving things that are important to me in my touristic activities
PE2 I think mobile internet would enable me to conduct touristic
activities more quickly PE3
Effort Expectancy (EE)
Learning how to use mobile internet for touristic activities
is easy for me EE1
My interaction with mobile internet in touristic activities is
clear and understandable EE2
I find mobile internet easy to use in touristic activities EE3 It is easy for me to become skilful at using mobile internet
in touristic activities EE4
Social Influence (SI)
People who influence my behaviour think that I should use
mobile internet in my touristic activities SI1 People who are important to me think that I should use
mobile internet in my touristic activities SI2 People in my environment who use mobile internet services
in touristic activities have more prestige than those who do not
SI3 Having mobile internet services in touristic activities is a
status symbol in my environment SI4
Facilitating Conditions (FC)
I have the necessary resources to use mobile internet in
touristic activities FC1
I have the necessary knowledge to use mobile internet in
touristic activities FC2
Mobile internet in touristic activities is compatible with other technologies I use
I can get help from others when I have difficulties using mobile internet in touristic activities
FC3 FC4
Hedonic Motivation (HM)
Using mobile internet in touristic activities is fun HM1
Venkatesh et al. (2012) Using mobile internet in touristic activities is enjoyable HM2
Using mobile internet in touristic activities is very
entertaining HM3
Price Value (PV)
Mobile internet for touristic activities is reasonably priced PV1 Mobile internet for touristic activities is a good value for the
money PV2
At a current price, mobile internet for touristic activities
provides a good value PV3
Habit (H)
The use of mobile internet in touristic activities has become a habit for me
H1 H2 I am addicted to using mobile internet in touristic activities
I must use mobile internet in touristic activities Using mobile internet in touristic activities has become natural to me
H3 H4
Behavioural Intention (BI)
I intend to continue using mobile internet in touristic
activities in the future BI1 Venkatesh et al.
(2003), Martins et al. (2014) I will always try to use mobile internet in my touristic life BI2
I plan to continue to use mobile internet frequently in
Constructs Items Source
Use Behaviour (U) Please choose your usage frequency for each of the following: Maps U1 Im et al. (2011) Attractions U2 Where to eat? Where to sleep? Transports Events U3 U4 U5 U6 Task Characteristics (TKC)
I need to obtain touristic information anytime TKC1
Goodhue and Thompson (1995), Zhou et
al., (2010) I need to obtain touristic information anywhere TKC2
Technology Characteristics (TC)
Mobile internet provides ubiquitous services in tourism activities
Mobile internet provides a real time services in tourism activities
Mobile internet provides a quick service in tourism activities
Mobile internet provides a secure service in tourism activities TC1 TC2 TC3 TC4 Task-Technology Fit (TTF)
In helping complete my touristic activities, the functions of mobile internet are enough
In helping complete my touristic activities, the functions of mobile internet are appropriate
In general, the functions of mobile internet fully meet my touristic needs
TTF1 TTF2 TTF3
Table 2 - Demographic data and characterization of respondents.
Gender Professional Status (according to CAE)
Male 125 37.3 %
Female 210 62.7% Other 71 21.2%
Student 69 20.6%
Financial activities 38 11.3%
Age Health and Social Services 24 7.2%
Collective, social and personal services 19 5.7%
<21 19 5.7% Education 16 4.8%
22-25 121 36.1% Unemployed 16 4.8%
26-30 66 19.7% Public Administration 14 4.2%
31-40 96 28.7% Wholesale and retail trade 12 3.6%
>40 33 9.9% Construction 10 3%
Transports, storage and communications 8 2.4%
Education Processing industries 8 2.4% Agriculture, Animal Production, Hunting, Forestry 6 1.8% Elementary &
High School 44 13.1%
International Organisations & other institutions 6 1.8%
Retired 6 1.8%
Undergraduate
Degree 130 38.8%
Real estate market, renting and services to businesses 5 1.5%
Accommodation and restaurants 3 0.9%
Graduate
Degree 96 27.8%
Production and distribution of electricity, water and
gas 2 0.6%
DK / NA = Do not know / No answer 2 0.6% Post-Graduate
Diploma 59 17.6%
Fishing 0 -
Extractive industries 0 -
Doctoral Degree 8 2.4% Stay at home parent 0 -
Other 1 0.3%
Owning a smartphone and/or portable device
Use of a smart & portable device - tourism Yes 314 93.7% Always 175 52.2% No 21 6.3% Often 85 25.4% Sometimes 42 12.5% Rarely 6 1.8% Never 27 8.1%
Table 3 - Loadings of the measurement model and reliability measures (CR and CA) and AVE.
Construct Item Loading t-Value AVE CR CA
Task Characteristics (TKC) TKC1 0.9599 97.98 0.93 0.96 0.92 TKC2 0.97 151.17 Technology Characteristics (TEC) TecC1 0.85 33.58 0.80 0.94 0.92 TecC2 0.93 93.00 TecC3 0.93 97.58 TecC4 0.87 48.57
Task Technology Fit (TTF) TTF1 0.95 118.04 0.89 0.96 0.94 TTF2 0.95 88.98
TTF3 0.93 75.64
Performance Expectancy (PE) PE1 0.89 61.34 0.82 0.93 0.89 PE2 0.93 83.36
PE3 0.89 54.45
Effort Expectancy (EE) EE1 0.91 65.55 0.83 0.95 0.93 EE2 0.91 54.75
EE3 0.90 44.19 EE4 0.92 57.53
Social Influence (SI) SI1 0.90 63.86 0.71 0.91 0.87 SI2 0.92 84.11 SI3 0.78 24.50 SI4 0.75 20.54 Facilitating Condition (FC) FC1 0.84 37.75 0.69 0.90 0.85 FC2 0.89 63.20 FC3 0.90 83.01 Hedonic Motivation (HM) HM1 0.96 147.63 0.89 0.96 0.94 HM2 0.95 127.41 HM3 0.93 83.80 Price Value (PV) PV1 0.93 68.77 0.90 0.96 0.94 PV2 0.96 147.46 PV3 0.94 99.80 Habit (H) H1 0.91 85.50 0.77 0.93 0.90 H2 0.81 36.94 H3 0.86 39.11 H4 0.93 126.25
Behavioural Intention (BI) BI1 0.89 56.50 0.82 0.93 0.89 BI2 0.89 65.30
BI3 0.93 87.50
Usage Behaviour (U) U1 0.89 19.09 0.00 0.00 0.00 U2 0.86 17.66
Table 4 - Means, standard deviations, correlations and discriminant validity measures. Mean SD TKC TEC TTF PE EE SI FC HM PV Habt BI U Gender Age TKC 4.5 1.75 0.96 TEC 4.64 1.49 0.59 0.90 TTF 4.72 1.51 0.56 0.76 0.94 PE 5.08 1.60 0.58 0.60 0.55 0.90 EE 5.40 1.48 0.34 0.49 0.45 0.56 0.91 SI 3.49 1.85 0.36 0.43 0.41 0.48 0.31 0.84 FC 5.12 1.62 0.35 0.48 0.48 0.46 0.71 0.31 0.83 HM 4.67 1.65 0.50 0.54 0.56 0.68 0.50 0.50 0.50 0.95 PV 3.59 1.60 0.21 0.39 0.31 0.33 0.29 0.27 0.37 0.31 0.95 H 3.68 1.85 0.64 0.59 0.56 0.69 0.47 0.52 0.50 0.68 0.32 0.88 BI 5.04 1.70 0.53 0.61 0.59 0.67 0.54 0.45 0.57 0.71 0.31 0.76 0.91 U 3.42 1.07 0.60 0.54 0.54 0.53 0.36 0.31 0.35 0.45 0.25 0.57 0.54 NA Gender 0.37 0.48 -0.08 0.02 0.08 0.02 0.00 -0.04 0.05 -0.04 -0.04 -0.01 0.03 -0.05 NA Age 30.09 8.93 -0.15 -0.10 -0.09 -0.03 -0.09 -0.06 -0.11 -0.05 0.02 -0.11 -0.05 -0.03 0.16 NA
Table 5 - Structural Model results for TTF + UTAUT 2.
Hypotheses Path Findings Moderators Conclusion
R2 t-value
Task Technology Fit 59%
H1 Task Characteristics 0.17 3.15 *** None Supported
H2 Technology Characteristics 0.49 8.50 *** None Supported
Performance Expectancy 43%
H3 Task Technology Fit 0.37 6.06 *** None Supported
H9 Effort Expectancy 0.40 6.37 *** Age, Gender Partially supported *
Effort Expectancy 24%
H6 Technology Characteristics 0.66 14.21 *** None Supported
Behavioural Intention 72%
H4 Task Technology Fit 0.14 2.80 *** None Supported
H7 Performance Expectancy 0.11 1.76 * Age, Gender Partially supported *
H8 Effort Expectancy 0.01 0.10 Age, Gender Not supported
H10 Social Influence -0.01 0.23 Age, Gender Not supported
H11a Facilitating Conditions 0.15 2.68 *** Age, Gender Partially supported * H12 Hedonic Motivation 0.21 3.64 *** Age, Gender Partially supported *
H13 Price Value -0.03 0.75 Age, Gender Not supported
H14a Habit 0.38 6.89 *** Age, Gender Partially supported
Use Behaviour 45%
H5 Task Technology Fit 0.29 3.82 *** None Supported
H11b Facilitating Conditions -0.02 0.27 Age, Gender Not supported
H14b Habit 0.31 4.75 *** Age, Gender Partially supported *
H15 Behavioural Intention 0.15 1.65 * None Supported
Notes:
* Effect not significant with moderators