The aim of the project was to create an operational satellite-based real-time monitoring and warning system for forest fire management in Finland. The satellite-based alarm system is integrated into the existing fire control system of the Finnish Ministry of the Interior.
Project background
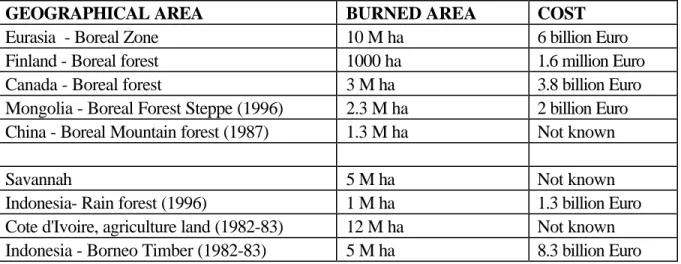
Economic impact of fires
The estimated cost in Finland of the destroyed forest per year is about 1.6 M Euro, or about 3 K Euro / ha. Extrapolating these costs to the entire boreal forest region, the damage to the forest will be 6 billion Euros per year.
Fire detection and management
To limit the cost of the flight survey, the amount of flight hours is optimized. When a fire is detected (either by citizens or fire observation flights), it is usually reported to the alarm center (or dispatch center) of the alarm area.

Available satellite data for 'Fire alert system'
- Overview
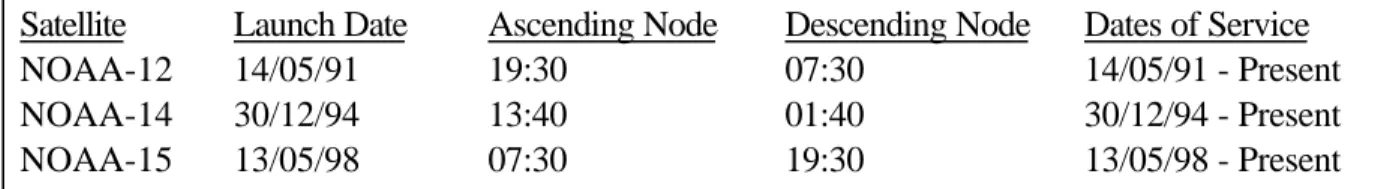
- NOAA
- ERS
- LANDSAT
The AVHRR instrument is a four- or five-channel broadband scanner that senses the visible, near-infrared, and thermal-infrared portions of the electromagnetic spectrum. Features and changes on the Earth's surface can be detected, measured and analyzed using Landsat data.
Pilot system for satellite-based fire detection
R6 Fire detected and the nearest fire department notified within 30 minutes after the fire started. As the entire rescue administration in Finland uses the GIS-based 'Mapinfo' system, the alarm information must be automatically sent in a compatible format to the alarm center closest to the fire location.
Output from 'FIRE ALARM' system
For the regional control rooms that can record fire information in digital form, the electronic fire report is written to a file to be sent over the network. This message contains the same information as the fax fire report (without the fax map page). By using the Finnish coordinate system in Finland, the regional control rooms can enter the fire coordinates directly into their MapInfo GIS system.
The use of electronic fire reports requires modification to the GIS software in the regional dispatch centers. Since these modifications were impossible before the 2000 fire season, all fire reports were sent by fax in the summer of 2000. The summary fire reports are sent by e-mail to the Finnish Ministry of the Interior, and to those regional dispatch centers that have the appropriate facilities to read e-mail.
A daily fire map is available graphically online showing the locations of all fires detected by the FireAlarm system within the fire monitoring area in the previous 24 hours. The daily fire map is displayed on the same WWW site as other FMI services for fire authorities, i.e. the fire log file contains information on all potential fires (both real fires and those viewed as fire alarms). false) for historical analysis.
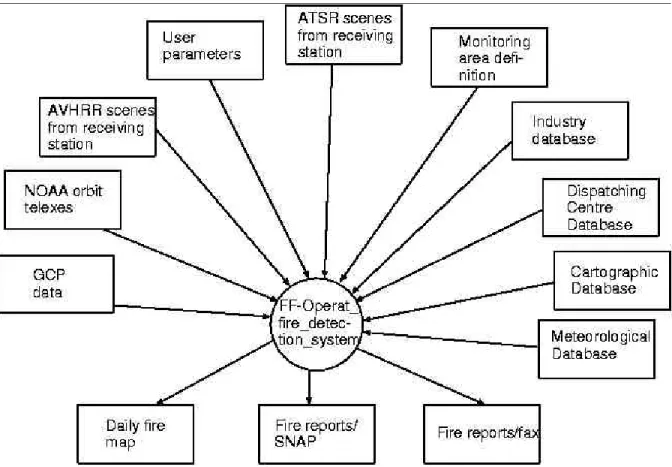
System Architecture for 'Fire Alarm'
Daily fire summary reports are text files that list all fires observed during a day. NOAA AVHRR data are received from the receiving station operated by the Finnish Meteorological Institute in Helsinki, Finland. The data is directly accessible from the server computer running the 'FireAlarm' fire detection system.
ERS-2 ATSR data is received and pre-processed by the Tromso receiving station in Norway. We estimate that it takes approximately 18 minutes for AVHRR to process a scene from the start of data acquisition to the start of sending a fire report via email or fax. An ATSR data orbit can be downloaded and processed in 7 to 10 minutes, depending on the number of scenes (within the monitoring area) in orbit and the actual FTP connection speed.
FTP transfer speed is affected by the load of other traffic on the network.

Pre-processing of satellite data
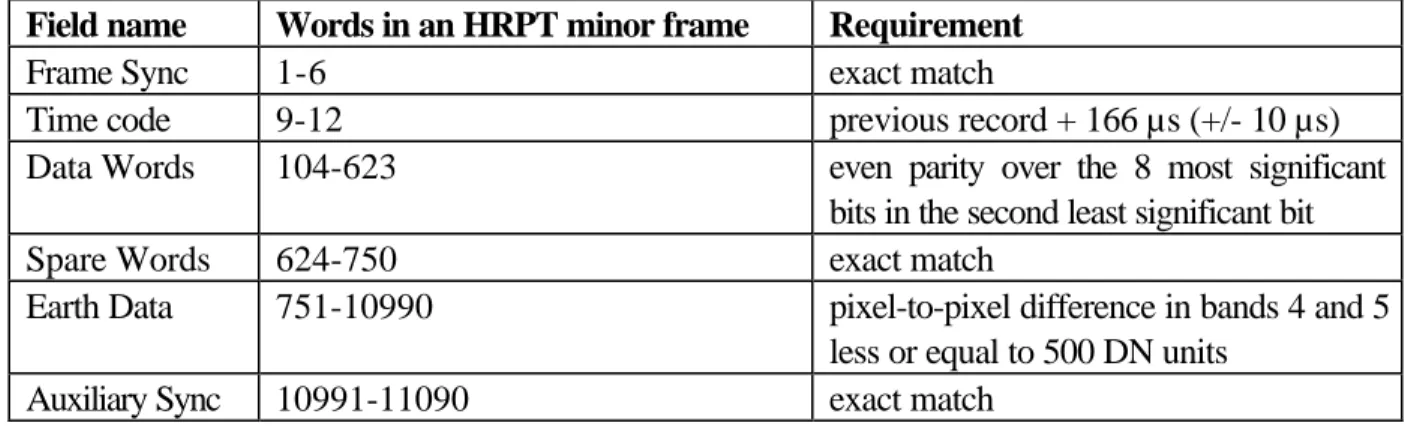
- AVHRR data quality control
- AVHRR calibration
- AVHRR geo-coding
- Pre-processing of ATSR data
The emissivity of the internal calibration target can be calculated using the measured temperature and spectral response of the AVHRR band to be calibrated. The calibrated radiance can then be converted back to brightness temperature using the spectral response of the AVHRR band to be calibrated. The visible bands (1 and 2) of NOAA-14 are under intensive calibration monitoring, and updated calibration coefficients can be found on the Internet.
NOAA guidelines were followed when performing thermal band calibration. Input data to the AVHRR geocoding module consists of orbital telexes (TBUS messages), calibrated subscenes with associated heads, and GCP data. The base mosaic is a cloud-free mosaic of NOAA AVHRR band 2 (0.9 µm) data, precisely geo-coded to the same Transverse Mercator coordinate system used (internally) by the 'FireAlarm' fire detection system.
Geocoded (or rectified) here means a regular grid of constant interval - in the map projection used internally by the fire detection system - where the axes of the grid are aligned along the coordinate axes of the projection system. Since the rectification using orbital data is quite inaccurate (the geolocation errors can be up to 15 km even if new orbital data is used), a refinement of the geolocation is necessary to reach the 0.5 km geolocation requirement (Rauste et al., 1999). The sun height data is also used in determining between the daytime and nighttime fire detection thresholds.

Fire detection algorithms
AVHRR fire detection algorithm
The 1.6 µm ATSR band data is calibrated using the most recent calibration coefficient and solar elevation angle (interpolated from the GBT header file). Average coordinates of the burn area (both northeast and line column in the geocoded scene). The deviation angle ('c' in Figure 8) is used in the fire detection algorithm to eliminate false alarms caused by sunlight on water surfaces or similar reflection phenomena by clouds, fog or smoke.
The direction vector of the reflected sunlight is in the same vertical plane as the vector pointing to the sun (c.f. Figure 8). The elevation angle of this vector is the same as the elevation angle of the sun-directed vector ('b' in Figure 8). The sensor heading vector is calculated from the orbital data using the known geographic coordinates of the target.
The average light temperature in AVHRR band 4 is above the threshold (t_b4_AVHRR) that ensures that the fire is in a cloud-free area;. The distance from the edges of the image swath is greater than the threshold (t_swath_AVHRR) to ensure that various unpredictable scattering/reflection phenomena in the poor quality areas furthest from the nadir do not cause false alarms. In addition to these criteria, all fire spots have the property that their average luminous temperature is in the band 3.5–3.7 µm above the fire detection threshold (t_b3_AVHRR).

ATSR fire detection algorithm
Threshold values
Fire indices and meteorological information
- Production of fire indices
- Fire indices and wind forecasts
- Description of the burning seasons 1999 and 2000
- Fires detected by the 'FireAlarm' system in 1999-2000
- ATSR observed fires
- Discussion on fire detection thresholds
In the years 1999 and 2000, the number of reported wildfires and also the size of the burned area were below the long-term average values. A response (to a verification request) was obtained on 104 faxes, which means that 28 percent of the fires were verified. To detect forest fires, the fire detection threshold must be less than the saturation level of the sensor.
Surface temperatures of 312 K or higher will cause saturation of the sensor, preventing the fire from being detected. To eliminate false alarms associated with the rather low saturation level of the ATSR 3.7 µm band, ATSR scenes are divided into 'night' and 'day' scenes. The division between 'night' and 'day' scenes is made based on the maximum sun position within the scene.
In cold conditions (winter or night season 1), or when the size of the fire is small, an increase in the sensed radiation level may not produce a fire alarm if the fire detection threshold II is used. This is not a major drawback as forest fires are not a problem in boreal forests during the cold season of the year. For ATSR, the nighttime threshold was lowered to 305 K, which is clearly less than the saturation level of the sensor.

Evaluation by User-Requirement Criteria
- Temporal coverage
- Size of detected fires
- False alarm rate
- Geo-location accuracy of detected fires
- Alarming time- time delay caused by data acquisition
- User satisfaction
- Application by other users outside Finland
- Fire risk assessment by fire index
Direct estimation of the proportion of fires detected by the 'FireAlarm' system is impossible based on data from 1999. The technical implementation of the 'FireAlarm' system and the satellite constellation have limitations on the fire detection performance, such as the minimum detectable fire size. Therefore, the signal is too weak compared to the pixel size of the satellite image.
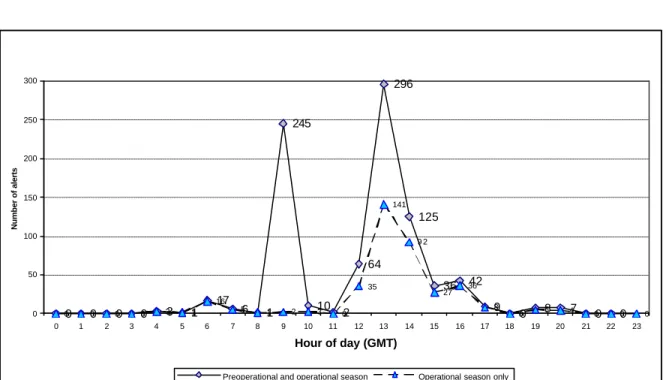
The small number of observations is due to clouds and irregular plant operation. The alarming time is the time period between the ignition of the fire and the receipt of the alarm at the dispatch center. The list shows that the processing time itself is only a small fraction of the technical alert time.
Most of the faxes were sent in less than 30 minutes from the start of image acquisition. The second most mentioned point refers to the location of the fire and its map representation. Restrictions on adapting the application to Southern Europe are similar to those in Northern Europe.
Supporting information on fire susceptibility, fuel amount, and burned area
The actual burned area was also schematically marked on the map by a demonstration participant. An ignition/fuel risk map was prepared using unsupervised classification of multi-channel data from 1999. Burning area segmentation using time-ratio channel classification that was combined with the fuel map also succeeded surprisingly well. .
The size of the smallest detectable fire depends on the intensity of the fire and the type of fire. The evaluation showed that the more appropriate evaluation criterion is 'alarm within 30 minutes after detection of fire'. The coordinate data (location of the fire) generated by the 'FireAlarm' system is in the same reference system as the Mapinfo GIS systems of the Finnish fire brigade.
The damage from the fire in this demonstration case was very low because only the cut open area was burned. The usefulness of the 'FireAlarm' system will become even better as the number of suitable satellites and instruments increases. In the Finnish conditions, the current level of services is already used as a complementary part of the forest fire risk management system.