It is important to take the ambient temperature and humidity into account for the purpose of fine-tuning the machine learning algorithm. Bluetooth beacons were used to measure temperature, humidity, acceleration and beacon battery levels in the thesis project. In the image below, the stress caused by the acceleration due to gravity is reported on the z-axis.
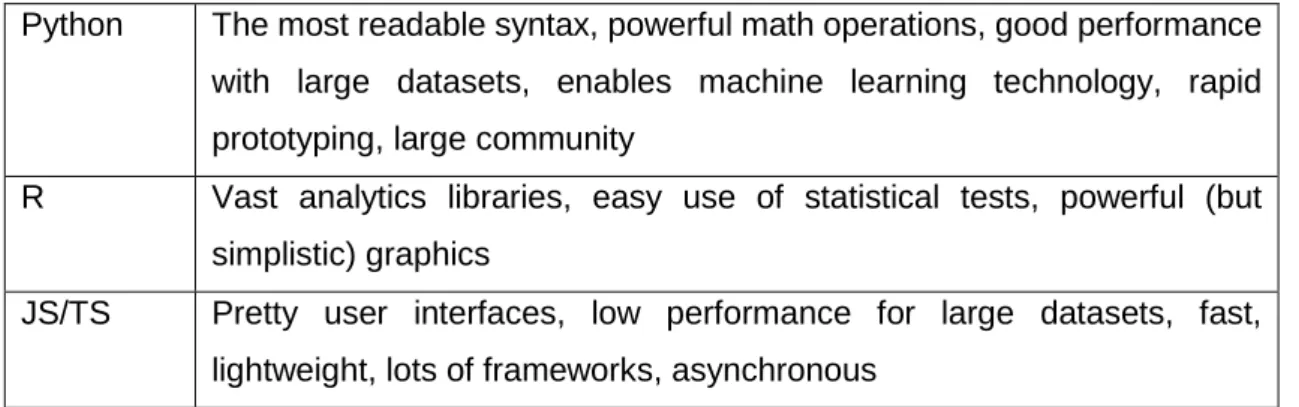
Both visually pleasing and powerful, the Jupyter notebook is a python interpreter that runs in the user's browser. In the thesis project, machine learning is applied to produce predictions, or labels, which in this case are maintenance intervals and/or lifetime of a machine. In the machinery example, the machine wear parameters must be clearly defined to find out which category fits best.
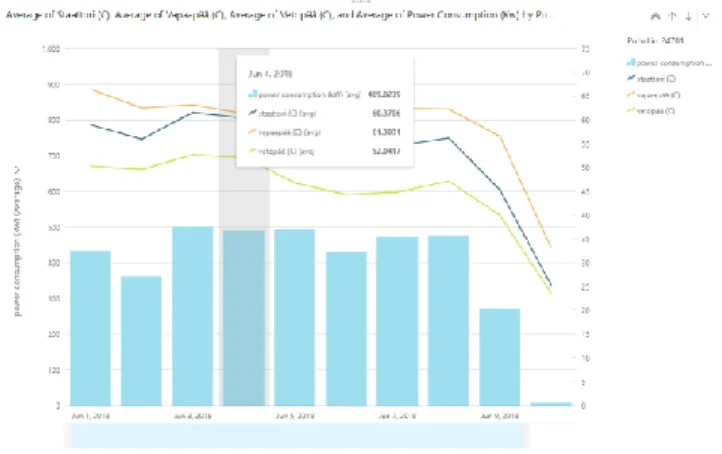
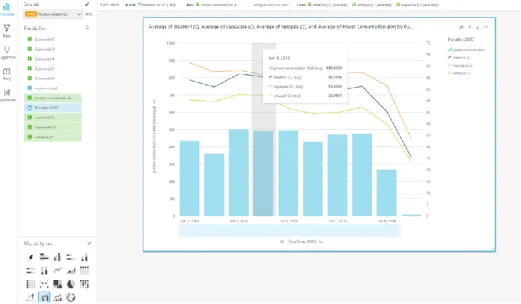
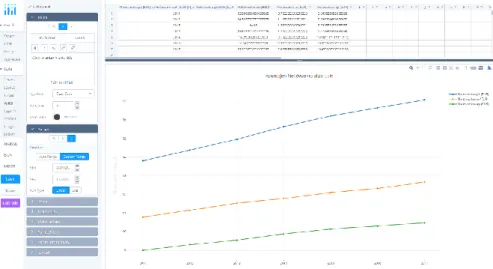
In the browser application, the user can enter data and create dozens of different graphs. The user can also filter dates to appear in the chart, perform analyzes on the data.
3 THE COMPARISON OF DATASETS
After some cleaning operations, the data is sent to the cloud application in json format and stored in a database specially adapted to process time series data. An online gateway will communicate its data over the internet and store it in a database, while offline gateways will store the data in a csv file. There are at least two types of data that must be integrated to use the system.
Data from the customer's automated measurement system and data from raspberry pi gateways, both online and offline. Data must be unified for analysis purposes, and offline and online gateway data must be in the same format. The data coming from the prototype system includes several fields consisting of identifiers, version information, timestamp, and metrics.
Data from the automated system is available as a file and requires a trivial piece of code that analyzes the information. The beacon data coming to the cloud service in the JSON format will be stored in the database as is and only parsed in case the data is queried by the UI component. Although the data sets have serious differences, the prototype will test the possibility of integrating the different technologies to refine the use of the measurement information.
Limited use usually comes from the lack of knowledge about how to take advantage of all the possibilities. Only during the rise of the Internet of Things (IoT) did the decision makers realize it as a way to update their processes to a more modern state of manufacturing. Previously, the data was collected, but only used during the measurement to make somewhat informed evaluations about the condition of the machines.
Other uses for the data include complete error prevention and more efficient resource planning.
4 THE EXPLORATORY ANALYSIS
Pandas converts read files to the DataFrame type which can be easily adapted to the needs of the data analyst. Perhaps the oldest, "the grandfather" of python plotting, the matplotlib library offers the greatest number of features and drawing options. One of the newer tools is the one called Altair, which creates visualization using the Vega-Lite graphics library with a minimal amount of code [9].
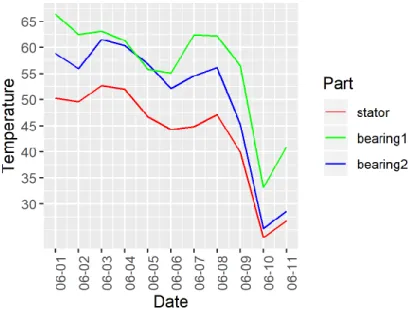
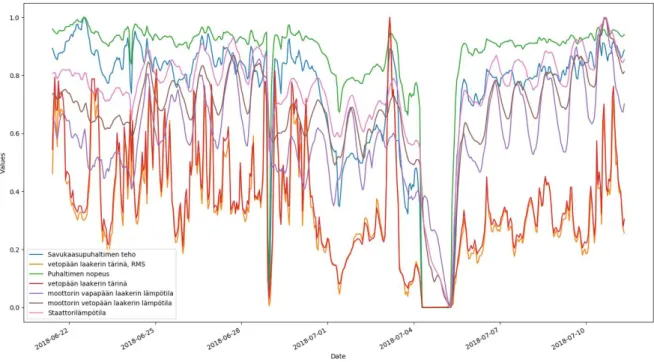
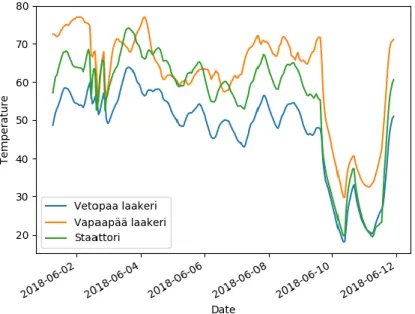
The latter was installed recently and does not cover most system maintenance. After that, it was only necessary to correctly define the axes in order to successfully show the peaks in the data. After plotting them all, a chaotic figure 9 was created, where most of the spikes were hidden in the noise.
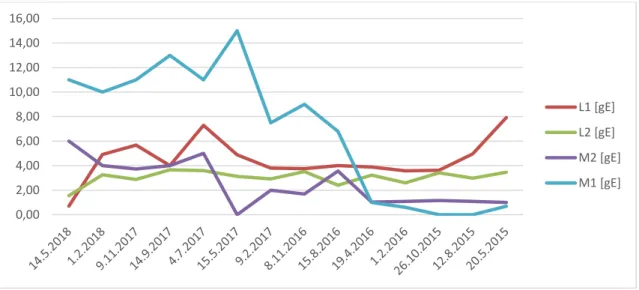
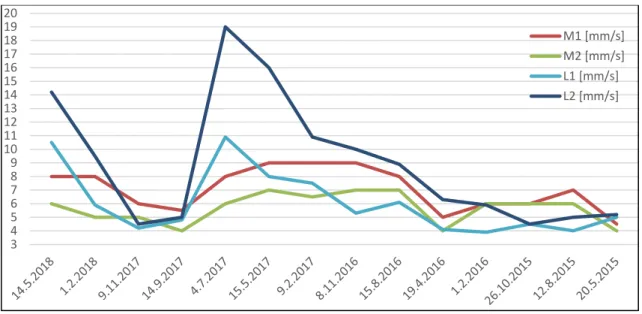
Peaks in the vibration, power consumption and speed of the motor are visible and are probably the cause of the resulting shutdown shortly afterwards. Metric values of the measurements continue to rise to warning and hazard levels, and after replacement or maintenance of certain parts, the levels fall to safe values. The machine shutdown visualized in the graph is unlikely to be due to a temperature alarm, although there is a slight variance in power consumption/speed/vibration spikes.
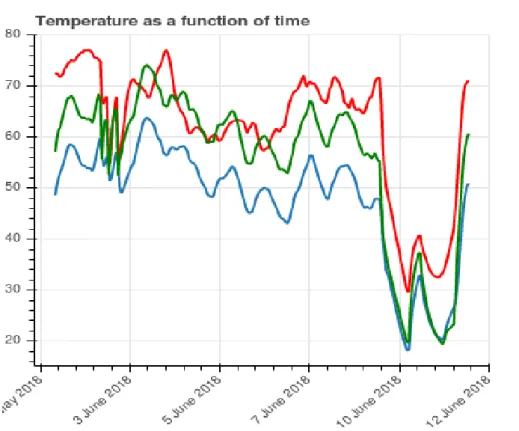
Normally, the temperature fluctuation results in one peak during the day, but at the time of failure, three peaks are visible in the graph. It is used to optimize the model by minimizing the loss function, which essentially represents the best description of the observed values. The figure also shows how the choice of model affects the sensitivity to changes in value.
However, these exaggerations can be useful when trying to model the defective state of the machine.
5 THE SYSTEM
Each device can send different combinations of packets that appear as separate instances in the scanner application or device. They can be used to describe the position of a device in the hierarchy. A transitional device, the Raspberry Pi during the thesis project, will be responsible for sending data over the local network or the Internet.
Be that as it may, the Bluetooth packet should not be forwarded in the state it arrives, with all sorts of unnecessary information. Therefore, the gateway has software that cleans the data and prepares a proper format to send it to the recipient. Other cloud functionalities include services that visualize the data in the user interface, as well as analytics.
Even the data that may at first seem redundant can have uses later and are stored in the database. The most suitable gateway device is the Raspberry Pi 3 B or B+, the former shown in image 6. To account for that, it is planned to place a few additional beacons somewhere near the measured machinery for the sole purpose of measurement of ambient temperature and use visualization to observe possible correlation, if any.
Temperatures in the field can rise to nearly 80°C and beacons can lose battery life. In the target area, the factory, wireless beacons should be installed on different sides of the machines. When the gateway sends data over the Internet to the cloud, it is queued.
The data can be in the form of charts, gauges, lists, or any number of other things.

6 THE PROTOTYPE
One of the prototype gateways will have access to the Internet and send beacon data over the Internet to a cloud service. The third source is offline gateway data from which the data must be manually restored. The cloud part of the system will include a piece of code that listens to incoming messages and forwards parts of it to their proper destinations.
Installing an application on a Raspberry Pi automatically turns it into a service, which allows the script to not only run in the background, but can also be stopped, started, and restarted depending on the user's needs. Each gateway has its own group of sensors that collect data from different areas of the plant and from different machines. To help identify each of the beacons, they are provided with tags that describe their hardware identification: the beacon's MAC address.
Each MAC address is linked to one of the machines, and each machine can have several measurement areas, such as bearings, motors or gearboxes, and each area must be measured individually. After installations, each gateway has the ability to detect beacons in its vicinity, and the functionality can be used to keep track of those beacons that for some reason are not heard by the gateways. Many of the installed beacons fit this category, but it remains to be seen whether the dust actually affects the measurements.
Each of the headlights was attached to their respective piece of machinery using epoxy glue. After installing the beacons and placing the ports on the power source, data began flowing into the system, ready to be displayed. The headlights form the nervous system of the prototype and are the most interesting part to test.
Confidex beacons ship with some vibration calculations in the firmware, but it remains to be seen if the data they report is useful in the eyes of the customer.
7 CONCLUSION
Thanks to its simple installation process, the system would be very quick to implement and the potential customer would gain the use of the system in a very short time. Many IoT applications in the business-to-business world are about making the process more efficient and providing added value to various processes. The purpose of the prototype was to provide the customer with improved efficiency and gain better control over the resources available to them.
By the end of the thesis project, the UI elements for displaying the data were unfinished, but the data collection was implemented, tested and installed. The client was positively surprised at how fast the installation process was and mentioned how easy the system would be to scale up if the project continued beyond the proof of concept phase. All in all, the project revealed many software development and business world work methods and techniques that would not be found in the student world.
During the project, good programming practices, version control, testing, documentation and communication skills proved invaluable. Software development also requires a person who is quick to adapt to new wishes of a customer and a mindset to effectively find answers to problems that arise throughout the development process. Throughout the project, the business experience gained may prove invaluable in the future and it will be interesting to follow the development of the IoT applications, industrial or otherwise.