Developing Purchasing Process and Forecasting Practices in Retail Business
Helsinki Metropolia University of Applied Sciences
Industrial Management
28 April 2019
Past year has been busy and rough, but in the end, also rewarding. Combining work and studies brought challenges in scheduling and everyday life, but the journey has been educational. But without the support from other people, this project would not have been possible. Therefore, I would like to take this opportunity to thank everyone who has sup- ported me during this project, in any way.
First, I would like to thank my company for supporting my studies, especially my col- leagues at the purchasing department, as well as the purchasing manager and the ERP project manager, who were willing to participate in this project and give their integral input during the data collection stages.
I would also like to thank all the lecturers at Metropolia University of Applied Sciences, as they shared their knowledge during varied courses. There were also several interest- ing guest lecturers from other universities and companies of different fields sharing their views through different industries. I would like to thank my instructors, Dr. Thomas Rohweder, for sharing essential views on the execution of this thesis, and Zinaida Grabovskaia, for her crucial help regarding the writing of this thesis. Furthermore, I would like to thank my class mates for the peer support. We all came from varied industries with different backgrounds, but in the end, we were in this together.
Last, but not least, I would like to thank my family and friends for their support. Without their encouragement and boost this project would not have been possible to finish.
Helsinki April 28, 2019
Author Title
Number of Pages Date
Antti L
Developing Purchasing Process and Forecasting Practices in Retail Business
75 pages 28 April 2019
Degree Master of Engineering
Degree Programme Industrial Management
Instructors Dr. Thomas Rohweder, Principal Lecturer Zinaida Grabovskaia, PhL, Senior Lecturer
This thesis focused on developing the purchasing process and forecasting practices of the case company. The purchasing process in the purchasing department of the case company has been working well overall in the past, but the constant growth of the company in the recent years has put pressure on the performance of the company and especially the pur- chasing. The case company is also implementing a new version of the ERP system during 2019 and this gave a good opportunity to improve the purchasing process and forecasting practices, while taking into account the characteristics of the new ERP.
The study was based on design research, which is not its own research methodology but a method of approach which uses both qualitative and quantitative research methods. The study was conducted in four parts, including three data collection rounds. Data was gathered mainly in three workshops with key stakeholders.
This study revealed some inconsistencies and deficiencies in the purchasing process of the case company. The current state analysis pointed the most significant problems being in product categorization, safety stocks and forecasting. With the help from conceptual frame- work constructed from the literature review, the improvement proposal was conducted. This study proposes several improvements to the three aforementioned steps of the purchasing process, as well as to some other issues encountered during the research.
By applying the improvements proposed in this study, the case company can increase effi- ciency, reliability and customer satisfaction, and reduce costs. The improvements proposed in this thesis will start taking place after this study is finished.
Keywords Purchasing, forecasting, product categorization, safety stocks, process development
Contents
1 Introduction 1
1.1 Business Context 1
1.2 Business Challenge, Objective and Outcome 2
1.3 Thesis Outline 3
2 Method and Material 4
2.1 Research Approach 4
2.2 Research Design 5
2.3 Data Collection and Analysis 6
3 Current State Analysis of the Purchasing Process and Forecasting Practices 8
3.1 Overview of the Current State Analysis Stage 8
3.2 Analysis of the Current Purchasing Process and Forecasting Practices 8 3.3 Analysis of the Weaknesses of the Current Purchasing Process and
Forecasting Practices 12
3.3.1 ABC-Categorization of Products 13
3.3.2 Safety Stocks 15
3.3.3 Forecasts and Seasonal Factors 16
3.3.4 Retiring Products 17
3.3.5 Unreliability of Planned Orders with Less Common Products 19 3.4 Analysis of the Strengths of the Current Purchasing Process and Forecasting
Practices 19
3.5 Key Findings from the Current State Analysis 20
4 Existing Knowledge and Best Practice on Purchasing and Forecasting 25
4.1 ABC-Categorization 25
4.2 Safety Stocks 26
4.3 Forecasting 27
4.4 Improving the Purchasing and Forecasting Process in Other Areas 28
4.5 Conceptual Framework 32
5 Building Improvement Proposal for the Purchasing Process and Forecasting
Practices for the Case Company 35
5.1 Overview of the Proposal Building Stage 35
5.2 Findings of Data Collection 2 35
5.2.1 Improving ABC-Categorization 36
5.2.2 Improving Safety Stocks 37
5.2.3 Improving Forecasting 39
5.2.4 Other Improvements 42
5.3 Proposal Draft 44
6 Validation of the Proposal 52
6.1 Overview of the Validation Stage 52
6.2 Findings of Data Collection 3 52
6.2.1 Improving ABC-Categorization 53
6.2.2 Improving Safety Stocks 54
6.2.3 Improving Forecasting 57
6.2.4 Other Improvements 60
6.3 Final Proposal 63
7 Conclusions 71
7.1 Executive Summary 71
7.2 Managerial Implications 72
7.3 Thesis Evaluation 73
7.4 Validity and Reliability 73
7.5 Closing Words 75
References 1
List of Figures
Figure 1. Research design of this Thesis.
Figure 2. Data plan for this Thesis.
Figure 3. Process map of the current purchasing process and forecasting practices.
Figure 4. ABC-categorization based on order picking lines, in the case company (calcu- lated monthly, 2018-2019).
Figure 5. Products in ABC-categories within spare parts, in the case company, (on av- erage, 2018-2019).
Figure 6. Back orders on average in the case company (in 2018).
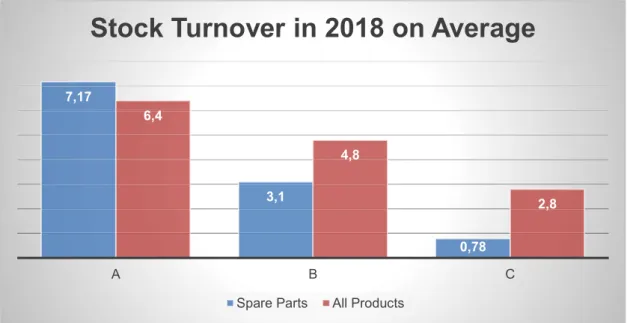
Figure 7. Stock turnover in the case company by product category (in 2018).
Figure 8. Summary of strengths based on the key findings.
Figure 9. Process map of the current purchasing process and forecasting practices with the identified weaknesses highlighted.
Figure 10. Summary of weaknesses based on the key findings.
Figure 11. Conceptual framework for improvements in the purchasing process and forecasting practices in this study.
Figure 12. Proposal for the improved purchasing process in the case company.
Figure 13. Proposal for improving product categorization.
Figure 14. Proposal for improving safety stocks.
Figure 15. Proposal for improving forecasting.
Figure 16. Proposal for other improvements.
Figure 17. Final proposal for improving product categorization.
Figure 18. Final proposal for improving safety stocks.
Figure 19. Final proposal for improving forecasting.
Figure 20. Final proposal for other improvements.
Figure 21. Summary of the final improvement proposal.
List of Tables
Table 1. Data 1-3 collection rounds.
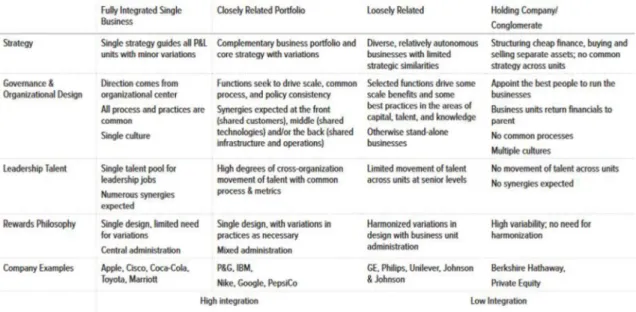
Table 2. Four types of operating governance and degrees of integration (Kesler et al.
2016).
Table 3. Key stakeholder suggestions for proposal building (Data 2) in relation to ABC- Categorization from the CSA (Data 1) and the key elements from CF.
Table 4. Key stakeholder suggestions for proposal building (Data 2) in relation to Safety Stocks from the CSA (Data 1) and the key elements from CF.
Table 5. Key stakeholder suggestions for proposal building (Data 2) in relation to Fore- casting from the CSA (Data 1) and the key elements from CF.
Table 6. Key stakeholder suggestions for proposal building (Data 2) in relation to other issues from the CSA (Data 1), the key elements from CF and ideas in Data 2.
Table 7. Key stakeholder feedback and new suggestions for final improvement pro- posal (Data 3) in relation to initial improvement suggestions on ABC-Categorization from the Data collection 2 stage.
Table 8. Key stakeholder feedback and new suggestions for final improvement pro- posal (Data 3) in relation to initial improvement suggestions on Safety Stocks from the Data collection 2 stage.
Table 9. Key stakeholder feedback and new suggestions for final improvement pro- posal (Data 3) in relation to initial improvement suggestions on Forecasting from the Data collection 2 stage.
Table 10. Key stakeholder feedback and new suggestions for final improvement pro- posal (Data 3) in relation to other issues from the Data collection 2 stage.
1 Introduction
This thesis explores purchasing process and forecasting practices in the context of retail business. Customer orientation is becoming a more and more relevant aspect in retail and service business. This naturally includes customer satisfaction with service delivery, which again includes the service level, the availability of the products that customers need and the speed of the delivery to customers. From the customer perspective, the product availability could be resolved by just ordering enough products from the factories and other vendors. This, however, is viewed differently from the service provider per- spective, as it would increase the value of the stock insanely and would hurt the eco- nomics of the company.
In certain retail business, customers can be cities, private customers and company chains. Many common products are sold in big quantities and often evenly throughout the year. It means that sales can be forecasted quite reliably. However, with more un- common products, and especially with spare parts coming into the scene, the demand varies quite strongly, and this causes significant problems when making forecasts.
This thesis takes up this problem of making the forecasts more reliable in a challenging environment of less predictable orders and delivering spare parts. The thesis is carried out for a case company operating in the retail business.
1.1 Business Context
The case company is the leading supplier in its field in Finland. The case company pro- vides the latest technology equipment and software, daily supplies and comprehensive support services for professionals. The case company is part of a company group, whose parent company, is one of the world's leading equipment manufacturers in its field. The product development is also closely linked to cus- tomers' needs and aspirations. Within the company group, the case company belongs to a business group, which operates in 12 countries across Europe. The business group is Europe's second largest supplier in its field, and many of the group's companies are leaders in their own market.
The case company in Finland also serves a sister company in Estonia as their ware- house for all products and all of their products are ordered and shipped first to the case
company and then sold and shipped to Estonia. The same process has also been imple- mented with most of the products for sister companies in Norway and Sweden. Spare parts were included in this process with Norway in 2016 and with Sweden in 2019, so practically all of their spare parts are now ordered, stored and handled in Finland. The collaboration in purchasing is also increasing with sister companies in Denmark, Latvia and Lithuania. This puts a great deal of pressure to the purchasing department regarding the purchasing process and forecasting.
1.2 Business Challenge, Objective and Outcome
The business challenge in the case company is that the increasing product range, sales volume and varying needs, especially for the spare parts, too often cause out-of-stock situations, but also overstocking. This increases pressure for the whole purchasing de- partment, but especially regarding the spare part purchasing. The current ABC-classifi- cation, i.e. product classification by their movability, for the products is not working properly, especially for the spare parts. Often many spare parts are placed in category C because of their rare sales, which means that the ERP-system lets the stock balance go empty, and even stay empty for a long time, before the forecasting of the system suggests purchases to be made. Many of these spare parts are too critical for the cus- tomers and the maintenance of their equipment to wait for the purchasing and shipping from the factory.
The company is also in the process of upgrading the ERP system to a newer version in 2019. This brings the company more challenges as the ERP system changes might not go as smoothly as the company hopes. However, this also brings more possibilities as the new system allows the purchasing department to implement more and better features in the new system than what they have in the current system. The challenge in this lies in configuring what are the essential and desirable changes and upgrades which the purchasing department needs in the new system, and which upgrades and changes can be, and need to be, implemented immediately and which can be implemented later.
Key development areas are increasing the quality and accuracy of the purchasing fore- casts and decrease out-of-stock situations and overstocking in order to reduce costs and increase customer satisfaction. This also includes changing the product classification system to allow more variation within the product range regarding their purchase fore- casts.
The objective of this thesis is to propose improvements to the purchasing process and forecasting practices in order to increase their quality and accuracy.
The scope of this thesis is focused on the purchasing department of the case company, which also serves other sister companies in northern Europe. The outcome of this thesis is an improvement proposal for purchasing process and forecasting practices.
1.3 Thesis Outline
The study is conducted by organizing discussions and workshops with key stakeholders, analyzing the and studying theoretical literature in order to find best practice. In the end the goal is to implement the improvement suggestions, analyze the results and make the final improvement suggestions.
This thesis contains 7 sections. Section 1 is the Introduction to the topic and Section 2 describes the materials and methods used to achieve the objective of the Thesis. Current State Analysis is described in Section 3 and Best practice and literature in Section 4. An initial proposal is given in Section 5 and validated in Section 6. Thesis ends with conclu- sions in Section 7.
2 Method and Material
This section describes the research method and material that were used in this study.
This section starts by describing the research approach, then continues with research design and data collection and analysis methods used in this Thesis.
2.1 Research Approach
The reason for defining the research approach is to give some frame and clarification to the information and claims made in the study. (
Selecting a research approach depends on the project, experience of the researcher and the environment of the study. Creswell (2014) implies that it is not only about choosing between qualitative, quantitative and mixed methods studies, but deciding on a type of study within these three methods. Choosing the appropriate methods for the project gives the researcher direction for procedures in a research design.
Qualitative research approach is mostly used when there is not much, or any, information of the issue that is being studied, and it does not have guidance or methodological frame- work to help. It is also used to get more in-depth understanding of the phenomenon.
Quantitative research needs models or theories and understanding the case. Different factors affecting the case also need to be known for the researcher to operate calcula- tions for quantitative research. (Kananen 2013)
Case research studies cases. A case subject could be a company, a business unit, a group of people or an individual. Case research is not its own research methodology but a method of approach which uses both qualitative and quantitative research methods.
The target for case research is to get understanding and make statements of the one case in hand. If the research ends up changing the current situation of the subject, the case research has changed to action research or design research. (Kananen 2013: 37- 39)
Unlike action research, which would be ongoing and making cycles for a longer period of time, design research makes only one cycle and ends with the final results. Design research was chosen to give the guidelines for this project, because the purpose of this
thesis was to make improvement suggestions and, in the end, change the current situa- tion in the case company, without repeating the research process cycles indefinitely.
2.2 Research Design
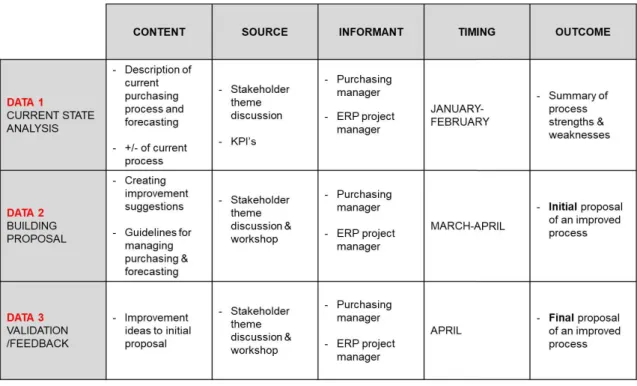
This section describes the research design of this thesis and the different parts that are included in it. The research design consists of four parts as shown in Figure 1, including three data collection rounds.
Figure 1. Research design of this Thesis.
As shown in Figure 1, the research design consists of four parts. The first part is the current state analysis. This was performed to get a better understanding and view about the current situation. The current state analysis included stakeholder theme discussion (DATA 1) and analyzing strengths and weaknesses of the current processes, in regards of the of the company.
Good practice from relevant literature was searched after the current state analysis as the significant issues and aspects of the current state of the purchasing process and forecasting practices were to be found during the current state analysis stage. The con- ceptual framework for the project was built regarding that relevant literature.
The next step was to co-develop improvement suggestions and ideas via discussions and workshops (DATA 2). Also, guidelines for managing processes was done with initial proposal of an improved purchasing process.
The research ended with validating the proposed improvements and analyzing them with the stakeholders during a workshop (DATA 3), after which the final proposal of the im- proved process was delivered.
2.3 Data Collection and Analysis
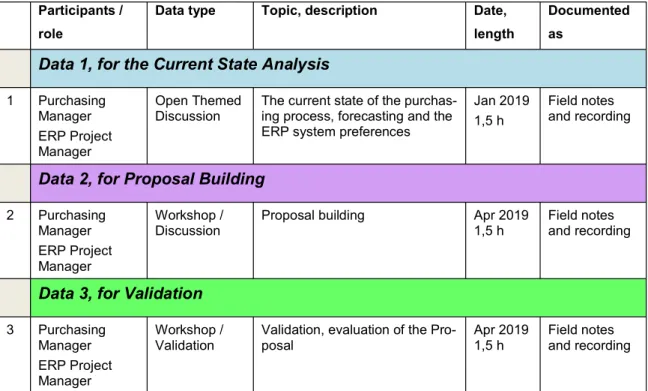
This study collected data from a variety of sources and from several data collection rounds. Figure 2 below gives an overview on Data 1-3 collection rounds.
Figure 2. Data plan for this Thesis.
As seen in Figure 2, data for this project was collected in three rounds. The first round, collecting Data 1, was conducted for the current state analysis and included themed key stakeholder discussion, own observations and exploring system guide- lines.
In the next round, Data 2 was collected to gather suggestions from the case company for developing the proposal based on the results of the CSA and the findings of best practice. This data included improvement suggestions. The final Data 3 round was col- lected when receiving feedback for the proposal from the case company. A more in- depth look into the data collection can be seen in Table 1 below.
Table 1. Data 1-3 collection rounds.
Participants / role
Data type Topic, description Date, length
Documented as
Data 1, for the Current State Analysis
1 Purchasing Manager ERP Project Manager
Open Themed
Discussion The current state of the purchas- ing process, forecasting and the ERP system preferences
Jan 2019 1,5 h
Field notes and recording
Data 2, for Proposal Building
2 Purchasing Manager ERP Project Manager
Workshop / Discussion
Proposal building Apr 2019 1,5 h
Field notes and recording
Data 3, for Validation
3 Purchasing Manager ERP Project Manager
Workshop /
Validation Validation, evaluation of the Pro-
posal Apr 2019
1,5 h Field notes and recording
As seen in Table 1, the discussions and workshops with key stakeholders made the primary method of data collection, in this study. The discussions were conducted as semi-structured discussions, held on the company premises, using open questions. The discussions were recorded, and field notes were taken.
There were two key stakeholders chosen for the discussions for data gathering. The two stakeholders were the purchasing manager and the ERP project manager. These two stakeholders were chosen for their position in the case company and their significant knowledge of the issues in hand. The situation was organized as a group discussion and not a one-to-one interview because there was more information to gather with open dis- cussion than with an interview with specific questions, as these stakeholders were known to openly discuss about different aspects of the themed matters. Also, most of the system documents and manuals were left out of the analysis as they were outdated or otherwise not suitable for this purpose.
The biggest part of data analysis took place in the current state analysis stage, in order to understand the current state of the purchasing process. The findings from the current state analysis are discussed next in Section 3. The analysis was carried out using the- matic analysis.
3 Current State Analysis of the Purchasing Process and Forecasting Practices
This section discusses the current state of the purchasing process and forecasting prac- tices within the Purchasing department in the case company. The first sub-section de- scribes the current state analysis and how it was conducted. It is followed by the descrip- tion of the current processes and practices and the analysis of strengths and weak- nesses. This section ends with the key findings from the current state analysis.
3.1 Overview of the Current State Analysis Stage
The purpose of the current state analysis was to create a better view and understanding of the current situation in the case company and within the business issue.
This current state analysis was executed in four steps. Step 1 describes the current pur- chasing process and the current forecasting practices. For this end, the study used dis- cussions with the colleagues in search for a more in-depth view and understanding of the current state of the purchasing process and the forecasting practices and to identify the problems in the current system.
Step 2 analyzed the current KPIs in the purchasing process and the current forecasting practices. This was done to increase understanding of the current situation and its met- rics.
Step 3 mapped the current purchasing process and forecasting practices and related KPIs to most of the steps. The map gave an overview to point out the issues of the current process. A more detailed description of the map is given in the next sub-section.
Finally, in Step 4, the study identified and summarized the strengths and weaknesses of the current purchasing process and forecasting practices. The identified weaknesses helped to point to the direction for searching business and research literature in order to find best practice and to come up with a proposal for improvement.
3.2 Analysis of the Current Purchasing Process and Forecasting Practices
The case company is part of a 12-company business group operating in Europe. Within this business group, the Purchasing department, warehouse and product management
of the case company serve directly four companies in Finland, Sweden, Norway and Estonia. The Purchasing department and the warehouse also serve a few other sister companies, so far occasionally, but constantly increasing business and collaboration with them.
Currently, the Purchasing department consists of six people, including the purchasing manager. The responsibilities regarding vendors are divided equally between all pur- chasers, although with different emphasis on the selection of vendors. In most cases each purchaser handles each vendor and their business in its entirety, but with some bigger vendors, the responsibilities are divided between two or three purchasers regard- ing their emphasis on other vendors, e.g. spare parts, devices and materials could be purchased by a different purchaser.
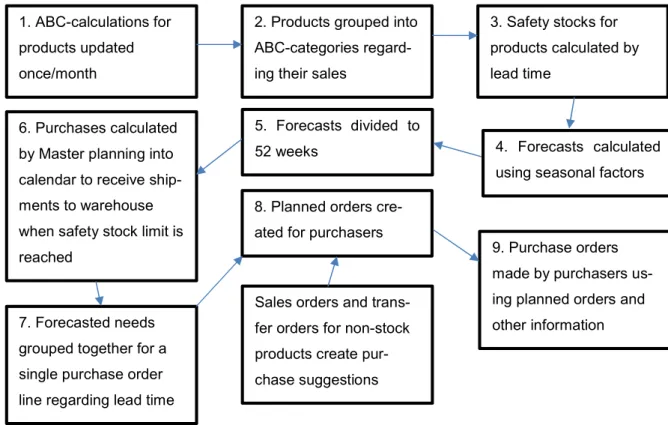
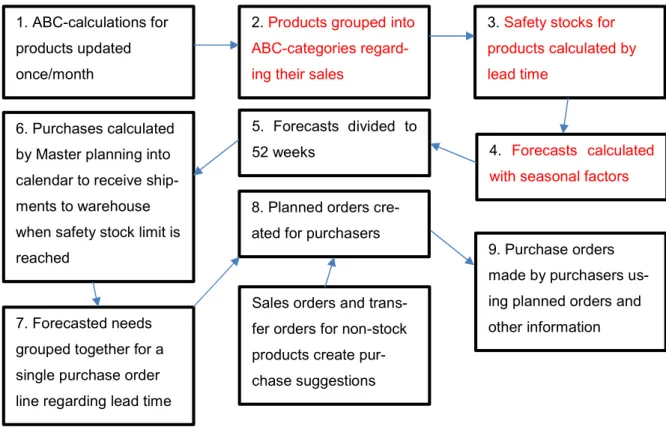
Based on the results from the observations and discussions with the stakeholders of the case company, the process map of the current purchasing process and forecasting prac- tices was created. The process map is shown in Figure 3 below.
Figure 3. Process map of the current purchasing process and forecasting practices.
1. ABC-calculations for products updated once/month
2. Products grouped into ABC-categories regard- ing their sales
3. Safety stocks for products calculated by lead time
7. Forecasted needs grouped together for a single purchase order line regarding lead time
4. Forecasts calculated using seasonal factors 5. Forecasts divided to
52 weeks 6. Purchases calculated
by Master planning into calendar to receive ship- ments to warehouse when safety stock limit is
reached 9. Purchase orders
made by purchasers us- ing planned orders and other information 8. Planned orders cre-
ated for purchasers
Sales orders and trans- fer orders for non-stock products create pur- chase suggestions
As seen in Figure 3, the current process starts from ABC-calculations and ABC-catego- rization, which is a traditional approach for inventory management and prioritizing prod- ucts. Then the process continues with safety stock calculations and forecast calculations which are then divided to 12 months of the year, regarding the seasonal factors. After that, the purchases are calculated and grouped together for planned purchases, together with non-stock product orders. Purchase orders are then made accordingly by the pur- chasers. A more in-depth analysis of the current purchasing process and forecasting practices is detailed below.
As seen in Figure 3, in Step 1, ABC-calculations are updated. The update cycle for the ABC-calculations is one month, for both purchasing and forecasting. But there are also some exceptions for these ABC-calculations and categorizations, which are mostly in forecasting, and they will be discussed later in this section.
Currently, in Step 2, the products in the ERP system are grouped into ABC-categories regarding their sales. The products are analyzed by their movability, as in the number of picking lines in sales orders, not the sales quantities, in order to group them into catego- ries A, B and C. The product categorization to groups of A, B and C, as described above, might make look like it is working well and that there would be hardly any products in group C. The reality, however, with tens of thousands of different products and huge volumes in sales, especially with the products in group A, means that there are still thou- sands of products in groups B and C. This excludes so called non-stock or service prod- ucts, which are not stocked in the warehouse but only ordered from the manufacturer or vendor after the sales order has been made.
After that, in Step 3, the safety stocks for the products are calculated by their lead time.
The A products get a safety stock that is the same quantity as their lead time consump- tion. B products get a safety stock that is 0,5 times their lead time consumption and C products get a safety stock that is 0,2 times their lead time consumption.
For some spare parts, the safety stock calculation is static and not calculated every month, while for some other category B and C products, which would not get a perma- nent safety stock regarding their actual sales quantities and forecasts, a minimum stock level of one or two is forced, if the products are seen crucial for the customers or the service department. These products are removed manually from the safety stock calcu- lations every month.
As for the current forecasting practices, in Step 4, the forecasts are calculated utilizing seasonal factors, using the aforementioned categories A, B, C, quantities and transac- tions of the last six months together with seasonal factors, for the next year. The sea- sonal factors correct the straight forecasting regarding the last six months, e.g. the sales are not as high in July as in March.
After these calculations, in Step 5, the forecasts are divided to 52 weeks, according to their seasonal fluctuations. In the current forecasting practices, the seasonal factors are not calculated automatically, but they are maintained manually. The same seasonal fac- tors cover all products and do not take into account product-based differences, special and regional sales spikes, or big project sales which might include several years of reg- ular sales quantities of some products at once.
After the forecasts are calculated, in Step 6, purchases are calculated by Master planning into calendar to receive shipments to warehouse when the safety stock limit is reached.
To be more specific, the master planning timing calculates the consumption into the cal- endar and creates planned purchase orders, which are also called purchase sugges- tions, in the way that the shipments would arrive to the warehouse at the presumptive date when the stock would reach the safety stock limit.
In Step 7, forecasted needs are grouped together for a single purchase order line re- garding lead time. The system defines the length of the time period in which the needs are grouped together for a single purchase order. The grouping also calculates the throughput class of the products, e.g. if the throughput class is 0-14 days, the calculation groups 28 days of needs together for the products in group A, 56 days of needs for products in group B and 84 days of needs for products in group C.
In step 8, planned orders are created for purchasers, with the aforementioned parame- ters, including lead times and the ABC-classification. After all these steps comes the more visible step, Step 9, the actual purchase orders.
In Step 9, purchase orders are made by purchasers using planned orders and other information. This includes e.g. special offers, additional discounts and minimum order quantities, not to mention all the experience of the purchasers, which helps enormously in recognizing the exceptions and oddities in the planned orders, which need another look and clarification before making the purchase order.
There is also another step in the process map, where sales orders and transfer orders for non-stock products create purchase suggestions. Unlike regular products, which are stocked in the warehouse, non-stock products do not use these calculations, but the planned purchase orders are created one at a time for every need, even when there are several sales orders for the same non-stock product at the same day. This is partly be- cause forecasts and safety stocks are not calculated for non-stock products.
Another reason is that the sales and purchase orders in these non-stock cases are linked together, and the ERP system cannot handle the sales orders if the purchases are grouped because it would lose these links. For the same reason, it would also complicate the work in the warehouse.
Summing up, presently, based on the results of mapping the current purchasing and forecasting practices, the purchasers at the Purchasing department, make purchases according to the planned purchase orders, which are calculated in the ERP system, val- idated and improved by the knowledge and experience of the purchasers. The forecast- ing practices include calculations to organize products into categories A, B and C, using the last six months of sales in creating the forecasting quantities for the next year, also adding seasonal factors to increase and decrease planned purchase orders accordingly.
Min-max categorization for products is not in use at the moment. The min-max catego- rized products would always create planned purchase orders when the stock level goes under the minimum stock and order the exact amount to achieve the defined maximum stock. This would be possible to implement to the current system, but the levels would have to be managed and updated manually, which would increase the workload for sev- eral employees.
3.3 Analysis of the Weaknesses of the Current Purchasing Process and Forecasting Practices
In some in-depth analysis, the research concentrates more on spare parts, as they, as a product group, are mostly affected by the problems that are discussed in this thesis, and thus they are easier to work with as a product group. Nonetheless, the results of this research can easily be implemented to other products which means all of them are not needed in this text all the time.
3.3.1 ABC-Categorization of Products
As mentioned earlier, all the products are placed in ABC-categories based on their mov- ability, as in order picking lines on sales orders. Below, in Figure 4, is a chart that depicts this categorization to show how the order picking lines affect the products in this catego- rization.
Figure 4. ABC-categorization based on order picking lines, in the case company (calculated monthly, 2018-2019).
As seen in Figure 4, 80% of these transactions cover category A, while category B gets 18% and category C 2%. The case company has a product range that includes tens of thousands of products and all these products are sold in different quantities. This means that as the products are divided between only these three categories, all these categories include a big variety of different products with very different sales quantities and e.g. two products in category A, of which one is sold in thousands per month while the other is sold by a hundred or less, are treated with the same characteristics in the ERP and all calculations while in reality they are in a very different position. Thus, it is clear that the ABC-categories are just too large and include too much variety within the products in those categories.
Figure 5, next, describes the relative and absolute quantities of products in ABC-catego- ries within the spare part segment of the product catalogue.
80 % 18 %2 %
ABC-Categorization of All Products Based on Order Picking Lines
A B C
Figure 5. Products in ABC-categories within spare parts, in the case company, (on average, 2018-2019).
As seen in Figure 5, most of the products in the spare part product group fall in to cate- gory C and only 2% are in category A. This means that only 2% of all spare parts that are supposed to be stocked, are sold enough to be put in category A, and that they get calculated efficiently based on their sales.
In addition to this problem with variety amongst products in one category, there is also a lack of market-based categorizations. E.g. one product can be sold as a category A prod- uct in one market but overall average sales within the whole market drops it to category
B This was very clearly expressed by
one of the stakeholders in the discussions, as follows:
One downside with these calculations is that if we have a certain product assort- ment in certain market, e.g. some laboratory equipment that are sold only in Fin- land, they do not take into account that the ABC-classification for this product drops when we always calculate the whole sales, in four countries. (Interviewee 1)
This leads to the conclusion that as the market specifics are not taken into consideration and products fall to the next categories, it would be reasonable to make the calculations according to the sales in only that country.
2 % 13 %
85 %
Products in ABC-Categories within Spare Parts
A B C
3.3.2 Safety Stocks
Presently, safety stocks in the case company are calculated by the lead time of the prod- ucts. The A products get a safety stock that is the same quantity as their lead time con- sumption. B products get a safety stock that is 0,5 times their lead time consumption and C products get a safety stock that is 0,2 times their lead time consumption.
The biggest problems in safety stocks, and especially with spare parts, is that the safety
many spare parts are sold through service orders instead of sales orders, the calcula- tions cannot calculate the whole consumption and hence give these products too small safety stock values. This leads to out-of-stock situations when the purchase orders are always late because the safety stock is too low, and the planned orders do not see the actual consumption and thus make the purchase suggestions too late.
Additionally, as the whole product range is tens of thousands, and spare parts only make about 10% to 15% of them, it is not a surprise that only few products in spare parts product category, about 2% of spare parts that are supposedly stocked products, as excluding the non-stock products from this sum, fall in to category A. All of these category A products get a safety stock value that is more than zero. Of the stocked products in category B, which includes hundreds of products, more than half, about 57%, get a safety stock value that is more than zero, but already hundreds of products are left without one.
But, as can be seen in Figure 5, in category C, which includes most of the spare parts, only few products get a real safety stock value. That is less than 2% of all of the products in category C. And this brings the bigger problem as in many cases the planned purchase order is not launched until the sales order is already made and leads to back orders and unhappy customers or service representatives.
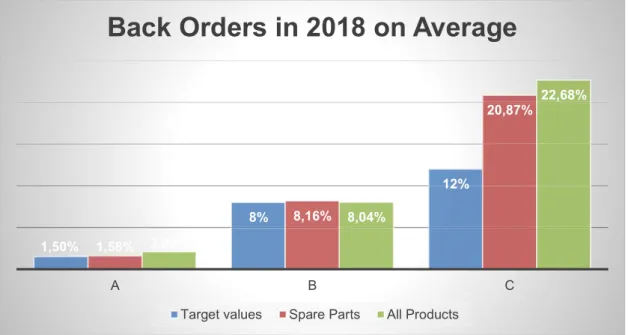
For the past three years, in the spare part category, the back orders have been steadily within the target values in categories A and B. In category A, the target value in the company is 1,5% and in category B it is 8%. With spare parts in 2018 the actual back orders have been 1,58% for category A and 8,16% for category B, on average. Figure 6 shows the back orders on average as calculated per month, in 2018, for the case com- pany.
Figure 6. Back orders on average in the case company (in 2018).
As seen in Figure 6, on the other hand, the situation looks very different in category C.
As the company target value for back orders in category C is 12%, the reality with spare parts is over 20%, on average. Comparing to the whole product range on company level, the actual back order levels are similar, which indicates that, even though back orders could be reduced in all product categories, most of the work should be focused on cate- gory C products.
For some category C products, a forced safety stock level of one has been implemented, but as they are updated manually, it cannot be the solution for every product as it would be overly costly and time consuming to manually go through the whole product catalogue and update the safety stocks regarding the product life cycle. Manually overriding the safety stock levels like this also means that if the product starts selling in a way that the system would calculate a bigger safety stock than one for it, it would not do this because of this forced minimum safety stock.
3.3.3 Forecasts and Seasonal Factors
Presently, in the Purchasing department of the case company, seasonal factors are cal- culated, or added to be more specific, to all products after ABC-categorization and safety stock calculations. They are the same for all products. At the moment, the seasonal fac- tors are updated manually and there is only one set of factors that is used for all products.
1,50%
8%
12%
1,58%
8,16%
20,87%
2,08%
8,04%
22,68%
A B C
Back Orders in 2018 on Average
Target values Spare Parts All Products
Therefore, different factors, e.g. product group-based factors, market specific factors, or any other product specific factors are not taken into account in these calculations. Hence, they are rather more suggestive and limited to average seasonal sales through the year.
As the seasonal factors are updated manually, they do not take into account big project sales or any other special cases. Additionally, one thing that is affected by both, i.e. the safety stock calculations and forecasts, is that spare parts are often needed quickly.
Sometimes even the whole operation of a customer
stopped because of one broken part. In that case the product is needed and ordered as fast as possible even if it is a non-stock product. But when it is a product that should be stocked but is not in stock because of inefficient safety stock and forecast calculations, the problems start to escalate.
Another problem regarding the forecasts is that the ERP system cannot copy the forecast from a retiring and stopped product to the replacing product. When a product is stopped for purchasing in the system, it does not mean that the forecasting or planned orders would stop. It is only removed from the regular planned orders window view, and the forecasts will run for the next six months in the background, probably even longer if the product, at the time of stoppage, has large stock which takes time to sell out and keeps calculating forecasts accordingly.
Naturally, when the stopped product still has large stock, it is not as crucial to order the replacing product, but eventually it has to be ordered. However, since the system cannot copy the forecasts between products, and the only indication for the new product needs from the system comes from the sales order for the product that is not there yet, and needs to be ordered for the back order, the purchasers have to be awake and aware of these replacements and their possible future need and order them beforehand. In some cases, the product needs special attention several times before the purchaser can leave it and trust that the system will handle it properly going forward.
3.3.4 Retiring Products
In the Purchasing department of the case company, there is also another problem re- garding the retiring products. When older products are in process of being retired in pur- chasing, it could happen for varied reasons, e.g. the factory has stopped producing it, replaced it with a newer model or the case company has stopped offering it or replaced it with another product. Usually then, when the stock of the old product is consumed, the
system will indicate the sales persons making the sales orders that the product is no longer available, and they should use the replacing product on the order instead. But the problem in this process is that the replacing product will not be offered to the sales or- ders, if the stopped product is already out of stock, but has any open incoming orders, as the system only sees that the old product has products coming to the warehouse. In the case company, retiring products are also referred to as stopped products, as blocking their purchasing and/or sales when they are being retired, is called stopping. An example of the problem regarding retiring products was given by one of the stakeholders in the discussions, as follows:
One example of this problem was a product which was sold in great quantities.
The replacing product was already in the system and also in stock, ready for sales, so everything seemed to be ok. But there was a return order coming from Sweden and the system only saw that there is or will be stock to be sold. As normally the system indicates when the stopped product is out of stock and the replacing prod- orders for this stopped product. (Interviewee 1)
This includes small backorders from vendors and returning sales orders from customers or from other countries. So even when there is only one or a couple of products coming to the warehouse and there might be hundreds of open sales orders for the old product, the system does not alert people in sales or in purchasing.
Another problem regarding the products that are retiring and marked as stopped in pur- chasing is that as they are excluded from the regular view of the planned purchase orders for purchasers, they are not checked regularly. Nobody seems to be in charge of check- ing the stopped products and there might be open sales and transfer orders over six months old as they have not been checked and nobody is asking where they are, why they have not been delivered. In some cases, the customers have just made new orders.
These same problems are even worse with spare parts, as all the service representatives have their own warehouses, both physically and in the system. And if there are any prod- ucts in any of the warehouses, the system sees them as available and does not indicate that the stock in the main warehouse is empty and the replacing product should be used.
Also, with transfer orders, which are used to transfer products from the main warehouse does not indicate the out-of-stock situations or stopped and replaced product info at all.
3.3.5 Unreliability of Planned Orders with Less Common Products
There are also other more detailed issues with the current purchasing process and fore- casting practices. One of these issues is that when a purchaser is checking the planned orders window for a certain vendor and as category A products can be ordered as they are planned and displayed, the category C products often have to be checked thoroughly because the planned orders suggestions cannot be trusted as they are. This includes going through the forecasts, stock levels, transactions and possibly the whole history of the product to get a better picture of why the system suggests the given quantities and if they are reliable or not.
Especially with spare parts the quantities that are suggested are often too low, as men- tioned earlier. But there is also a good chance that the suggested quantities are too high.
Reasons for these too high suggestions come from the forecasts that are calculated too high, and the source for the wrong calculations is most often either some big project sales or rare single sales orders that drain the whole stock at once.
3.4 Analysis of the Strengths of the Current Purchasing Process and Forecasting Prac- tices
Even though several weaknesses have been found and analyzed in this research, there are also advantages and strengths in the current system. In the big picture the current system works reasonably well. It works relatively automatically and the whole product catalogue is controlled at least on some level. The planned orders tool is easy to work with and works well with the most common products. Also, the coverage groups for the products are updated automatically. If the product starts from category C but the sales increase enough, the system transfers the product automatically to categories B and A and vice versa. Additionally, if the lead time is changed, the system automatically trans- fers the product to the right coverage group with the right parameters.
The basis of the current system is that some priorities have been implemented. This has been necessary to handle the vast amounts of products. The big majority of products , e.g. the stock turnover rates, which can be seen in Figure 7.
Figure 7. Stock turnover in the case company by product category (in 2018).
As seen in Figure 7, the stock turnover ratios in the case company are very good on category A and B products. And the low turnover ratio for spare parts in category C can be explained with the irregular nature of the more rarely needed spare parts, which need to be stored regarding their critical nature for the work of customers rather than great sales.
The current system keeps the overall service level good and, although there are several deficiencies, it would allow the case company to implement several diverse coverage calculations to the system. Unfortunately, this would require someone having time to implement them and be appointed to be responsible for processing and updating them, but the possibilities are there.
3.5 Key Findings from the Current State Analysis
This subsection provides an overview of the main strengths and weaknesses identified in the current state analysis in Section 3. The process map below in Figure 8, shows the identified weaknesses in the current purchasing process and forecasting practices.
After analyzing the issues that were found in the current state analysis stage, the key findings were categorized accordingly. The key findings can be found next in Figures 8, 9 and 10.
7,17
3,1
0,78 6,4
4,8
2,8
A B C
Stock Turnover in 2018 on Average
Spare Parts All Products
Figure 8. Summary of strengths based on the key findings.
As shown in Figure 8, the current system works well in the big picture. All of the products are in the system and great amounts of more sold products can be handled easily. Cov- good to keep in the future.
The weaknesses, on the other hand, need a closer look. The process map, with the identified steps suffering from the weaknesses discussed above, can be found below, in Figure 9.
Figure 9. Process map of the current purchasing process and forecasting practices with the identified weaknesses highlighted.
1. ABC-calculations for products updated once/month
2. Products grouped into ABC-categories regard- ing their sales
3. Safety stocks for products calculated by lead time
7. Forecasted needs grouped together for a single purchase order line regarding lead time
4. Forecasts calculated with seasonal factors 5. Forecasts divided to
52 weeks 6. Purchases calculated
by Master planning into calendar to receive ship- ments to warehouse when safety stock limit is
reached 9. Purchase orders
made by purchasers us- ing planned orders and other information 8. Planned orders cre-
ated for purchasers
Sales orders and trans- fer orders for non-stock products create pur- chase suggestions Summary of Strengths
Overall Works Well
- The whole product range is included at some level
- Coverage groups of the products are updated automatically based on the transactions
- Common products are easily ordered and handled with planned orders -
As can be seen in Figure 9, there are three steps in the current purchasing process, which have been identified as the main weaknesses. These weaknesses include the ABC-categorization of the products, safety stock calculations and forecasting. These steps are described in more detail in Figure 10 below.
Figure 10. Summary of weaknesses based on the key findings.
As seen in Figure 10, there are four key findings in the weaknesses, of which three have been chosen for more in-depth study. The first of these findings is the ABC-classification.
The size of the ABC-categories makes them less flexible and accurate as the products within these groups vary significantly and the same calculations should not be used for so many different products. A similar problem arises in the incapability to make market- based or other special ABC-calculations for products that are sold in different quantities in different markets, or other special reasons.
Summary of Weaknesses ABC-categorization
- ABC-categories are too large
- The calculations do not take into account the differences between markets Safety stocks
- ERP does not count service orders, part of consumption excluded from cal- culations
- Too many back orders, especially in product category C
Forecasting and products
- Seasonal factors are same for all products and updated manually
- ERP cannot copy the forecast from retiring and stopped product to replac- ing product, causing out-of-stock, late orders and backorders
- The replacing product will not be offered to the sales orders, if the stopped product is already out of stock, but has any open incoming orders, as the system only sees that the old product has products coming to the ware- house
The problem increases with spare parts, if there are any products in any warehouse, the replacing product will not be offered by the sys- tem
On transfer orders the retiring products can be ordered without the system indicating it at all
- Retiring products on planned orders are not checked regularly Less common products need a lot of manual work
- Unreliability of planned orders for less common products
- Checking forecasts, stock levels, overall history and transactions before or- dering
The second weakness relates to safety stocks. The current ERP system does not count service orders in the calculations, thus leaving a huge amount of data and transactions out of the calculations, especially within spare parts. This leads to wrong calculations and safety stock levels that are too low. Moreover, these issues accumulate back orders as the purchase orders are made too late and the shipments from vendors will not get to the warehouse in time. And not only do the back orders decrease customer satisfaction, but they also increase shipping costs.
The third big finding includes forecasting and retiring products. One of the issues in this segment is that the seasonal factors are same for all products, so it does not allow any specific factors to be implemented on some products that might be known to behave differently. They are also updated manually so real changes in sales do not affect these factors and they are often outdated.
As the products get replaced with other products, the new products do not have any forecasts, but they start from a clean plate. The forecasts from the replaced products cannot be copied to the replacing products, which often leads to out-of-stock situations and back orders with the new product. Another problem with replacing products is that the system does not offer them to the sales orders until the stock is completely empty for the old product. As this often works, too often there are situations where the old product is waiting for a return order to come to the warehouse and the system only sees that the old product still has inventory to be sold and does not indicate the product change to people making sales orders. As the system is not made for spare parts, but they were included in to it later, the problems with retiring and replacing products are even greater within spare parts. Transfer orders are the most common way for service representatives to receive spare parts from the main warehouse to their own. But with transfer orders the system does not indicate the product change at all. It does not stop the order transaction if the product is out of stock and stopped in purchasing, and hence it also does not give the replacing item to send to the service representative. This problem, together with the fact that stopped products are not checked regularly, sometimes lead to very long waiting period for the actual transactions to happen.
The fourth finding in the weaknesses list is about the workload that the less common products and many spare parts causes for the purchasers. But as all four findings above overlap each other, this issue receives less attention during this research, as improving
the other findings will help to improve this issue also. The selection of these three findings will guide the choice of literature in Section 4.
4 Existing Knowledge and Best Practice on Purchasing and Forecasting
This section discusses the theoretical background related to purchasing processes and forecasting practices. The section concentrates on existing knowledge, best practice and concepts which relate to the findings of the current state analysis, discussed in Section 3, namely, the concepts related to product ABC-categorization, safety stocks, forecasting and purchasing processes. Section 4 ends with the conceptual framework.
4.1 ABC-Categorization
ABC-categorization is a traditional approach for inventory management and prioritizing products. In this system, products are categorized into three categories called A, B and C. Traditionally, products in category A get the most attention and products in category C get the least amount of attention. Products in category B are in the middle. Many com- panies have a wide range of products, sometimes thousands, or even tens of thousands.
As managing these products manually one by one would be impossible, ABC-categori- zation is a useful tool helping to solve when to make orders and for what quantities.
According to Ravinder and Misra (2014), it has been a common practice to categorize products by their turnover. The number of products in category A would be small but they would account for most of the turnover. Accordingly, based on the Pareto Principle, the number of products in category C would be huge, but their turnover would be small.
Although categorizing products by their turnover has been a helpful tool, it has been based only on one criterion. Other criteria can be taken into account in order to establish multi-criteria ABC-categorization. (Ravinder and Misra 2014)
Douissa and Jabeur (2016) agree with the increasing importance of other criteria in ABC- categorization in addition to traditional turnover. They also add that in the literature of this topic, there are two primary methods of doing the ABC-categorization, ranking and classification. In the ranking method, products are categorized based on their ranking, which could be performed using different calculation systems. Classification method, on the other hand, utilizes Artificial Intelligence (AI) systems in order to categorize products.
Using AI system in ABC-categorizing would need implementing training sets for the sys- tem to learn with and deep knowledge of AI systems, which could be difficult for many companies to achieve. (Douissa and Jabeur (2016)
4.2 Safety Stocks
Sales and supply of products can be unpredictable and unreliable. Safety stocks are a typical and smart part of inventory management to deal with this challenge and they are calculated by evaluating risks and applying the safety stock value for the forthcoming time periods. Kanet et al. (2010) suggest that the easiest way of doing this is to define one simple safety stock value in a bigger scope, although more progressive approaches support progressive checkups and revision of the safety stock values. According to Kanet et al. (2010), safety stocks could be changed with time, in order to decrease their value when supply and sales are foreseen and increase the quantities when supply and sales are more unpredictable. Informing other members in the supply chain in advance about the changes in demand is crucial for the changing safety stocks to work properly and producing a trajectory to predict these changes is a helpful tool in keeping safety stocks on a reasonable and effective level. Decreasing stock levels and safety stocks and in- creasing service level is a desired result for companies, so planning for situations when sales and lead times are not stagnant is important. (Kanet et al. 2010: 6859-6860) Inventory management gets challenging when demand and supply are random and vague. According to Inderfurth and Vogelgesang (2013) profit losses are not easy to forecast in these situations and introducing safety stocks is a good way to regulate them.
It is safe to say that even in static environment the level of safety stocks fluctuates, one of the causes being inconsistent lead times. In the end, it is in the hands of the managers to decide, whether a fixed safety stock would be better for the company due to simpler and cheaper construction and maintenance, comparing to progressive and changing safety stock, which would need more work to build and update. (Inderfurth and Vogelge- sang 2013: 293-294, 300)
According to Osman and Demirli (2012), the service level of the end customer is the determining factor regarding the safety stocks. Companies should find the optimal safety stock levels and fill rates to satisfy the customer service level, while keeping the inventory costs as low as possible. The main cause for failing to deliver products to customers in time is the unreliability of suppliers and their shipments coming in late. Another cause correlates with inventory systems with arbitrary order decisions and out-of-stock situa- tions. (Osman and Demirli 2012: 299) As it has become clear, many aspects of safety stocks are heavily related to forecasting, which is discussed in the next sub-section.
4.3 Forecasting
Prak et al. (2017) suggest that in the related literature it is usually presumed that all specifications of supply and demand are known. In reality, however, this is not the case, but the forecasts regarding to the future demand are based on past experiences and old information. Variation on the estimation of the demand could cause safety stocks being considerably smaller than needed and service level worse than intended. (Prak et al.
2017: 454)
When dealing with products that have varied and inconsistent demand, many sources concentrate mostly in spare parts, as their nature is often inconsistent, but often the same methods can be utilized with other products, with similar traits, as well. Pennings et al.
(2017) depict spare part business and management and their influence on the success of companies significant, especially for companies that have broad selection of spare parts, perhaps thousands of them. Forecasting for spare parts and other products that are sold irregularly is difficult as the clear and consistent signals, comparing to more common products, are missing. At the same time, service level targets are set high, while trying to keep inventory costs low. The accuracy of forecasting becomes even more chal- lenging when customers order large quantities at a time, draining the inventory for some products, which increases out-of-stock situations and back orders, especially if the lead time for these products from factories is long. With external customers, companies often have to rely solely on historical data from previous transactions, as the exact information about the customer and the order that is specific to the context, is rarely accessible.
(Pennings et al. 2017: 958-959)
According to Dombi et al. (2018), managing spare parts systematically and efficiently can increase loyalty within customers significantly. Then again, as mentioned earlier, there are many challenges in forecasting their demand. These challenges include the range of spare parts, which can be immense, and their demand, which fluctuates vastly.
Spare parts are also often needed urgently, which puts pressure to increase inventory.
The risk of ending up with huge amounts of obsolete products, on the other hand, puts pressure to decrease the inventory. Understanding and identifying product life cycle, for the spare parts, and the end products, for which they are used, supports finding the right balance in forecasting. (Dombi et al. 2018)
4.4 Improving the Purchasing and Forecasting Process in Other Areas
For improving business processes, defining a business process is needed first, which can be challenging. According to Sharp and McDermott (2009),
collection of interrelated activities, initiated in response to a triggering event, which achieves a specific, discrete result for the customer and other stakeholders of the pro-
When looking more closely into this definition, the customer can be a person or an organization, and it can be internal or external. Next, the triggering event that starts the whole process needs to be identifiable, and the activ- ities within the process interrelated. Alternatively, according to Sharp and McDermott (2009: 57-58), a business process can be defined, especially when the process includes repetitive and clearly described tasks. Then, the process is also reasonable to be mod- eled. Creative, strategic and executive processes, on the other hand, are much more difficult to model, as they usually cannot be defined as easily. Considering these argu- ments (Sharp and McDermott 2009), it could be said that a purchase process is a busi- ness process and, in many aspects, could be modeled.
According to Martinsuo and Blomqvist (2010), process management can be imple- mented almost anywhere in companies and organizations in order to enhance their work.
Enhancing work requires specifying targets and improving their processes. Frequently, process improvement involves information systems and it is typically based on using documentation and tools from process management. In order to achieve this, tracking performance and getting suitable information is essential for process improvements. Be- fore starting the process improvement, the process or the part of the process needs to be defined, for which the improvement is going to be made for. This defining work also includes the information on the amount of unpredictability and the level of detail in the process. (Martinsuo and Blomqvist 2010: 4-5)
Business Process Reengineering (BPR) is one way of decision making when processes a con- stant process or organization, but as an instrument created for reengineering one pro- cess and to be dismantled after it is done. After that, the employees return to their normal work and organization, which might have changed during the reengineering process.
Usually, companies should not do more than one process reengineering at a time, as this interrupts normal work and causes stress. They can, however, create another BPR team right after the previous team has finished their work and has been dismantled. Still,
the process itself is not forgotten after the reengineering is finished, but constant devel- opment is needed from the people who work in the process. BPR also has the interest set on the results more than activities. Keeping the results in mind provides guidance and measurability. Nevertheless, BPR includes risks. The changes might not be suitable after all, or the reaction within the organization might be negative and oppose the changes. However, communicating in simple terms and early on to the organization
-579)
Also, decision making is a crucial part of improving processes. Everything that compa- nies do, whether it is an opportunity or success or misfortune, is a result of decision making. According to Rogers and Blenko (2006), decisions often get stuck inside the organization and the effects can be huge for the processes. (Rogers and Blenko 2006) The benefits of decision making could still be lost even in companies with good reputation on decision making, if the accountability of who is making the decisions disappears, and the whole process could be stopped. Thus, defining and designating the roles and re- sponsibilities is the first procedure in tackling the obstacles of decision making. People who are good at making decisions identify the decisions that are most critical for the work of the company. They also discover the right people to have the right role in the decision- making process. One approach to this is called RAPID. This abbreviation comes from the roles of recommend, agree, input, perform and decide. (Rogers and Blenko 2006) In RAPID, in the recommending role, the person gives a recommendation of the activity that should be done but needs analysis and data from persons who are giving the input for the decision making. Persons who give input into the decision-making process work like consultants. They provide facts, statistics and other useful information for the rec- ommending persons, who, on the other hand, are not constrained by this input, but have to take it into consideration, nonetheless. In the agreeing role, the person either agrees with the original recommendation, or permits it to go forward, or works with the person recommending in order to improve the recommendation so that the action can be per- formed. The next step in this approach is deciding. There should not be too many per- sons in the role of decision making in order to keep the decision-making processes op- erating fluently. Finally, the person with the last but not the least role is the performer.
Performers execute the decision and make sure it is done efficiently and fast. The im- portance of this role comes from the idea that a good decision executed fast is better for the organizations than trying to make the perfect decision and execute it poorly or slowly.
(Rogers and Blenko 2006)