There appeared to be no effective means of automatically diagnosing vibration data from a remote location. However, there seemed to be no definition of smartness or intelligence in the context of condition monitoring.
INTRODUCTION
The main focus of the thesis is to show how classification enables a continuous learning process in predicting machine faults. Introduction of a method for continuous learning of the diagnostic system for automating the processes of detecting irregularities and errors.
CONDITION MONITORING
General
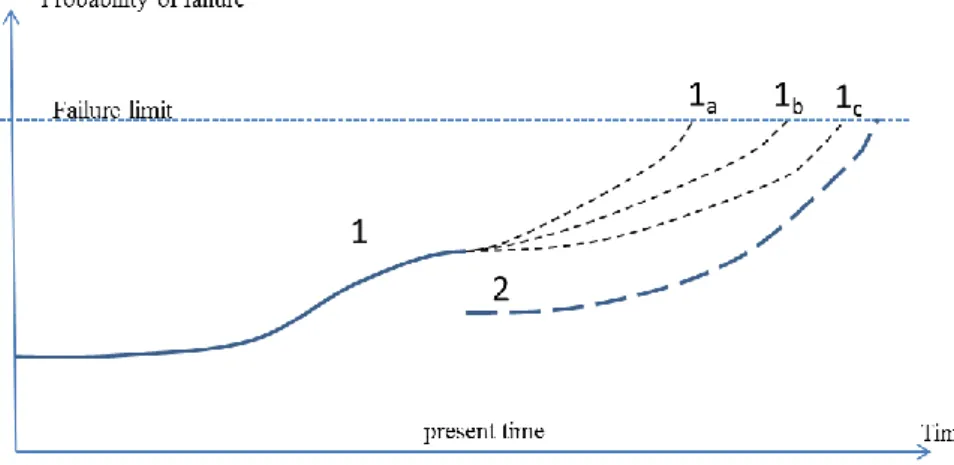
Exceeding an error limit should alert the user to the significant possibility of an error. In reality, it is seldom possible to set a definite error limit below which the probability of error would be significantly lower than above it.
Temporal data
For diagnostic and prognostic purposes, pre-failure data is needed as a baseline, which defines the normal behavior of the machine. Post-failure data is useful to confirm that the problem has been resolved and the machine has returned to normal.
Spatial data
Example 7 shows that the vibrational motions at the ends of the rotor are out of phase, indicating a possible couple imbalance. In this case, spatial data is collected regardless of the current environment, and its influence on vibration behavior is taken into account separately.
Descriptors, symptoms and syndromes
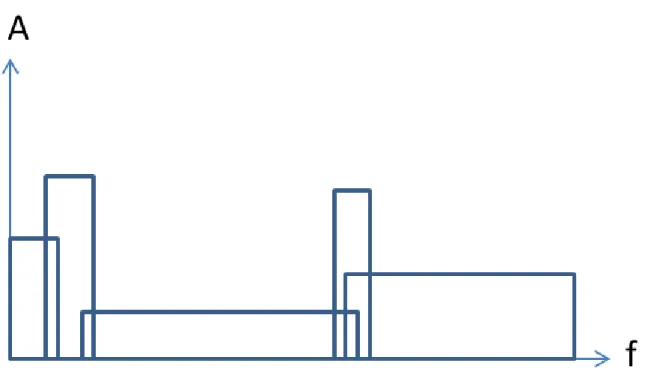
Many of the descriptors used in conventional condition monitoring systems are likely to be related. Frequency band descriptors (such as items 7, 8, and 9 in the list above) are very sensitive to response to changes in the shape of the vibration spectrum.
Diagnostics
Prognostics
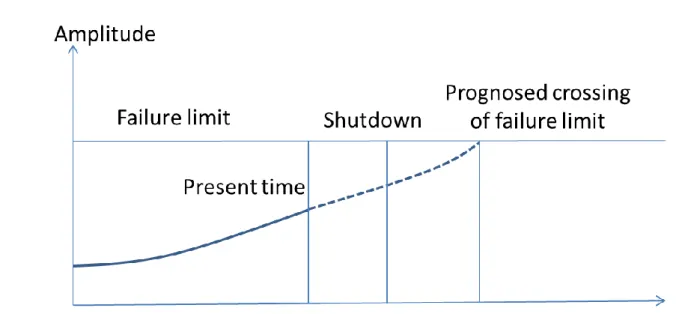
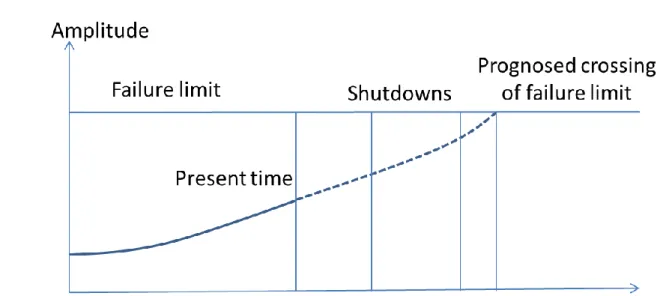
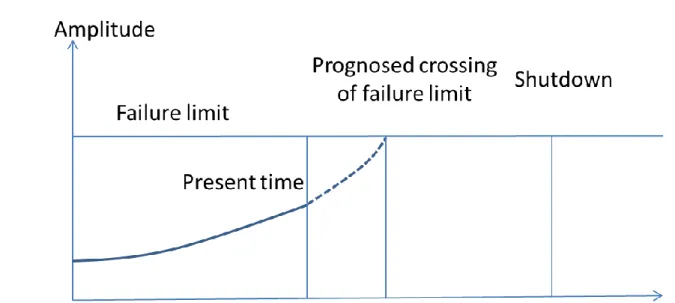
The failure level is determined intellectually to represent an amplitude value of a descriptor or symptom, which would lead to an immediate failure or to a high probability of failure if exceeded. 15 Figure 7: Maintenance is required during the next scheduled shutdown because the forecast is that the fault limit will be exceeded before the second scheduled shutdown.
Prediction
Intelligence in prediction
If an expert has no prior expertise on a particular failure mode and the pattern is missing, it is extremely difficult to arrive at a correct prediction. It is equally important to remember and retrieve previous interpretations of the occurrence of different error modes.
Confidence level of prediction
The third option implies that the timing of the work was based solely on the actual condition of the item, determined by condition monitoring. It should be understood that the shortest period comes first, but the order of the other two periods is helpful in determining condition monitoring confidence.

Certification
If the certification body has been accredited, the certificates are recognized by other bodies and around the world. After the candidate has met all requirements for certification in a given category, the certification body should announce the certification and issue certificates indicating certification.
DATA PRE-PROCESSING
- Challenges
- Missing data
- Erroneous data
- Outliers
- Precision of data values
- Irrelevant data
- Normalization
Some of the descriptor values may be missing from the dataset for various reasons. In fact, the neural network system as such has no means of detecting errors in the data. Therefore, a small change in symptom values can be considered to be caused by other phenomena that the machine is operating.
Classifier training attempts to organize classes based on variation in data sets.
SOM BASED CLASSIFICATION
- Introduction
- Self-Organizing Map
- Training of SOM based classifier
- Class membership
- Multivariate classifier
- Class label
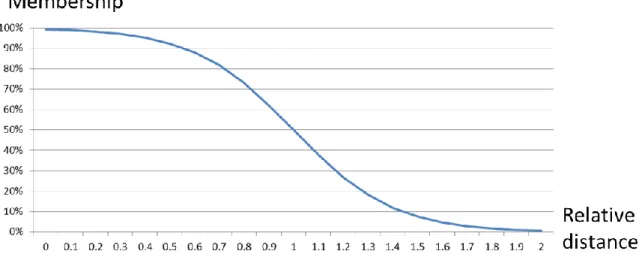
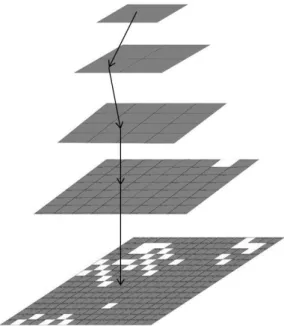
Note that SOM is an iterative process that can be terminated before the weight vector is at the centroid of the data samples. If the new sample falls close to the center of gravity of the training samples, the membership is high. 37 anomaly index (AI) can be defined as the ratio of a distance(s) of the data sample to the centroid to a distance (smax) of the farthest training sample to the centroid.
The prediction should include the level of confidence, for example "the machine can be safely used for 30 days with 80 percent confidence".
CONTINUOUS LEARNING
- Introduction
- Initial Training
- Prediction
- Retraining
- Fault Detection
- Fault Progression
- Probability of Failure
- Generalization
- Summary of the method
43 mode of a known defect, any new information about the different severities of the defect is valuable in predicting the progression of the defect. After retraining, the organization of the classifier will change and the class indices will no longer be the same. If the new pattern falls close to the geometric center of the training patterns, the membership is high.
All data related to error modes is valuable and increases the confidence level of the class label.

EXPERIMENTS WITH MULTIVARIATE DATA
Introduction
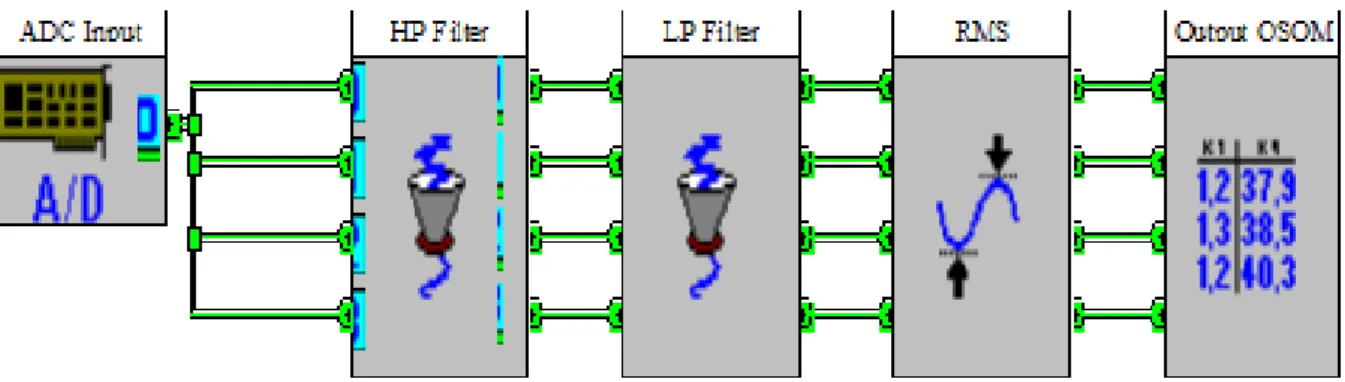
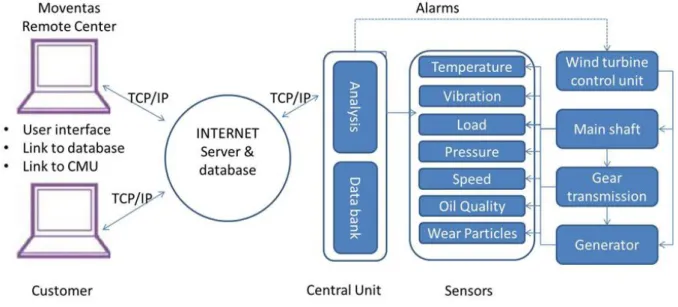
The purpose of the system is to anticipate actual maintenance needs in order to avoid unexpected maintenance actions. The core of the system is a smart sensor (Figure 25), which is the result of internal development by Moventas. Most measurements and analyzes can be automated, with one analyst monitoring around 300 turbines.
As a secondary objective, the system must be able to use the data and lessons learned from all failure modes and their progression on any of the monitored gearboxes.
Data pre-processing
An outlier left in the training data will cause an error in the membership calculation. Due to the normalization process, which in this case was the standard scoring method, random meaningless variance at low magnitudes resulted in high symptom values, which in turn gave excessive weight to these descriptors in the training of a classifier. Finally, it is important to understand that the descriptors should be chosen so that a minor error progression would cause a detectable change (ie, a symptom) in the descriptor value.
The purpose of this operation was to emphasize the actual diversity of the data values.
Initial training
58 all descriptor values for a data sample are missing, the data is not important and should be discarded. The data population used to calculate the mean and standard deviation values was changed through the initial training, testing and retraining processes as explained later. Hence, a small change in the symptom value is insignificant and probably caused only by random variation.
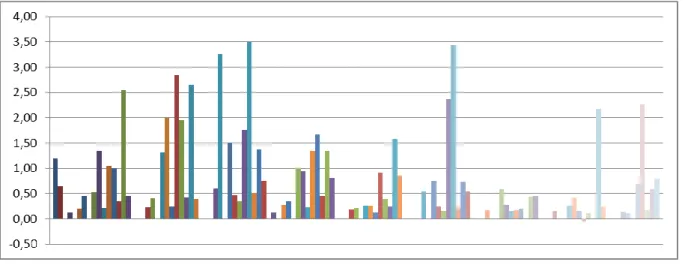
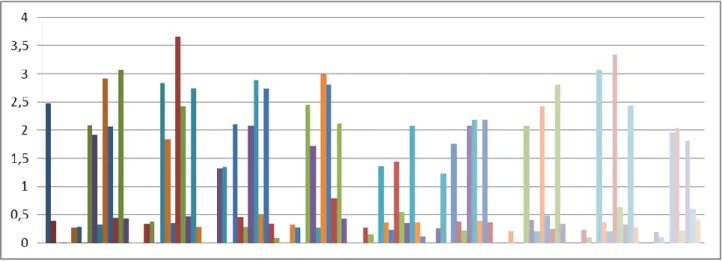
Data scatter across the map is caused by various operating conditions, such as wind speed and direction, rotation speed, etc.

Prediction
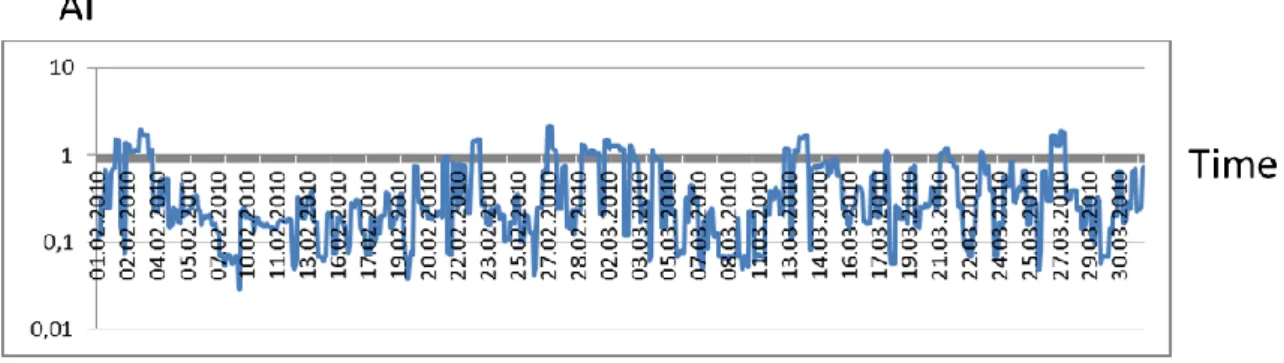
Analyzing the raw data, it was concluded that the anomaly was caused by a bearing fault on the high-speed shaft of the gearbox. The bearing was replaced in April 2009, after which the anomaly index dropped, but not always below 1.0.
First re-training
63 Due to the initialization process in the learning algorithm, classes in the upper left corner of the classifier map tend to represent symptoms with high values, and classes in the opposite corner with low values. By examining the classification of the anomaly data on the retrained classifier, it can be concluded that this data was used to train the classes in the upper left without any sample data from the initial dataset. An upward trend can be seen on the graph, indicating that the failure mode is becoming more severe.
Prior to January 20, 2009, all data was classified into the classes on the right side of the map.
Fault detection and progression
68 Figure 38: Distances between data samples from the centroids of the best matching class in marked (fault mode related) classes are increased as the fault progresses. The top number in the class gives the class index and the bottom number the amount of data samples used to train the class. It can be seen that a new set of data was used to train the classes in the upper left corner of the map.
72 Figure 43: Euclidean distances of data samples from the corresponding centers of gravity in classes 21 to 28 representing the most severe fault mode of the "GB02" data set.

Generalization
The gearbox was found to be in good condition, as evidenced by a very high membership for most of the data samples. There are a few sporadic anomalies, however, when data samples hit classes 44, 50, and 73, where the current maximum distance is very low. This was the result of many NaN values in the descriptor values of the original training data.
75 Figure 46: Classification map after initial training shows the distribution of training data samples in different classes.
Improving the classifier
It is also clear that there are other data patterns that represent failure modes in the training data. 78 data samples related to failure modes, but we can only select 3561 data samples that hit the upper left class in the second layer for retraining. Looking at the class weight vectors in the lower right quarter of the map in Figure 48, we can see a great similarity.
It should be noted that class 4 can be smaller and larger depending on the adjacent class data in the upper right and lower left quarters.

Evaluation of the confidence level of prediction
The conclusion is that there is a high probability that the prediction by the classifier is correct. The confidence of the classifier to predict different normal modes of operation is highly dependent on the amount and variation of data samples used for training. This ability can be demonstrated by introducing into the classifier a set of data samples from a different but similar error condition to the .
In some cases, the classifier did not predict the failure mode, but instead detected an anomaly.

PROCESS STATES IN CONDITION PREDICTION
- Process state
- Determination of process classes
- Determination cause-effect relationship
- Prediction based on the process states
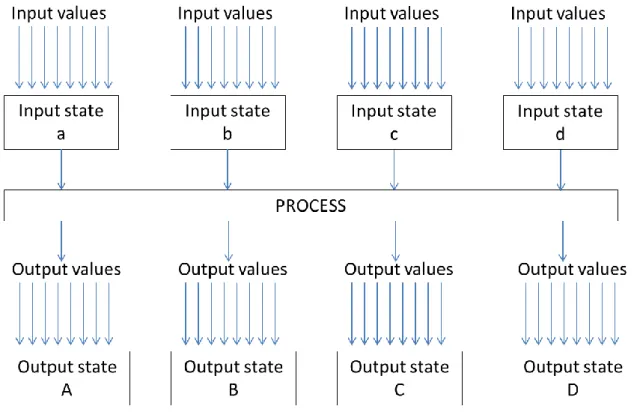
Similarly, input and output classes can be formed to represent combinations of input and output values. The same classification principle that was described in Chapter 4 can be used to handle input and output data. Similarly, process output can be monitored by output values, which form different output states.
The relationship between the input and output class is not always clear, but using past experience some input classes can be labeled as unfavorable or harmful, because they are known to lead to adverse process classes.
FUTURE DEVELOPMENTS
On the other hand, the search process does not need to be fast in the prediction of samples. In fact, we really wouldn't be interested in the least significant decimals of the symptom values. Most users of the condition monitoring systems will not be interested in the classification itself, but a simple interface to display the predicted class and its label.
97 For those users who are really interested in the organization of a classification, an informative LED display can be useful (Figure 56).

CONCLUSIONS
It would be tempting to find out whether the predictions can be further generalized to involve other industrial gearboxes. In general, more research is needed to find out which monitored items can be combined in the same group, where the same classification rules apply. Most likely, not only the machine type is important, but the type of operation is an influential factor in determining, if the machines can be generalized in the same group of items.
The process condition is known to have a significant influence on the vibration response of a workpiece.
Paper presented at the International Conference on Prognostics and Heath Management, Denver, CO. ed), Diagnostics and Prognostics of Engineering Systems: Methods and Techniques. Paper presented at the International Conference on Prognostics and Heath Management, Denver, CO. 1996), Self Learning Method in the Condition Monitoring and Diagnostics of Rotating Machines, FI102857, Helsinki, Finland: Finnish Patent Office. Paper presented at the 17th International Congress and Exhibition on Condition Monitoring and Diagnostic Engineering Management (COMADEM 2004 International), Cambridge, UK.