The history project - home storage, load shifting and flexibility Smart district in aspern - self-learning systems that optimize energy consumption City-zen - the virtual power plant and the Vehicle2Grid project. When mapping the smart-ready level of the built environment in the 28 EU member states, 12 essential characteristics were defined. The Smart-ready level corresponds to the nZEB rules (W/mK), while the lowest score is given to countries with a higher average U-value (W/mK).
The smart-ready level is equal to existing nZEB examples (kWh/m while a lower score is given to countries with an average kWh/m2 higher than 248, which is similar to the final energy consumption of a building from the post-war period in Europe [19]. The smart-ready level is equal to a society where almost all residents have a healthy living and working environment. The smart-ready level is set to be equal to ' a full deployment of smart meters.
The smart-ready level equates to a highly connected society, in which virtually all buildings are connected to the internet. The smart-ready level is equivalent to a framework that is commercially open for demand response. The smart-ready level is equivalent to an analysis of the flexibility of the energy system [22], where their medium-term regime (of 50% variable renewable energy) requires storage, demand flexibility and a dynamic energy market (i.e. smart buildings).
The level of readiness for smart technology is the same as the ambitious scenario of the European heating plan for the energy future of Europe [24].
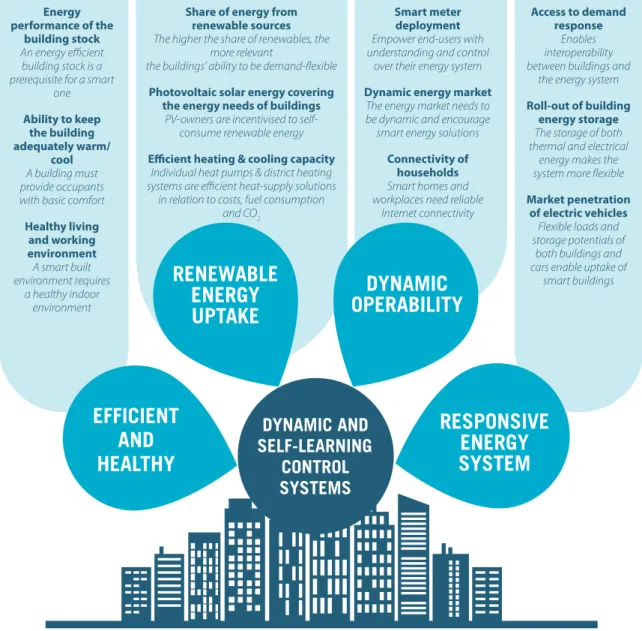
STATUS: SMART-READINESS OF THE BUILT ENVIRONMENT
IS EUROPE READY FOR SMART BUILDINGS?
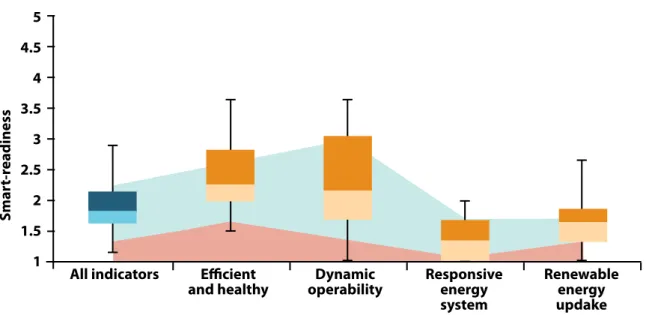
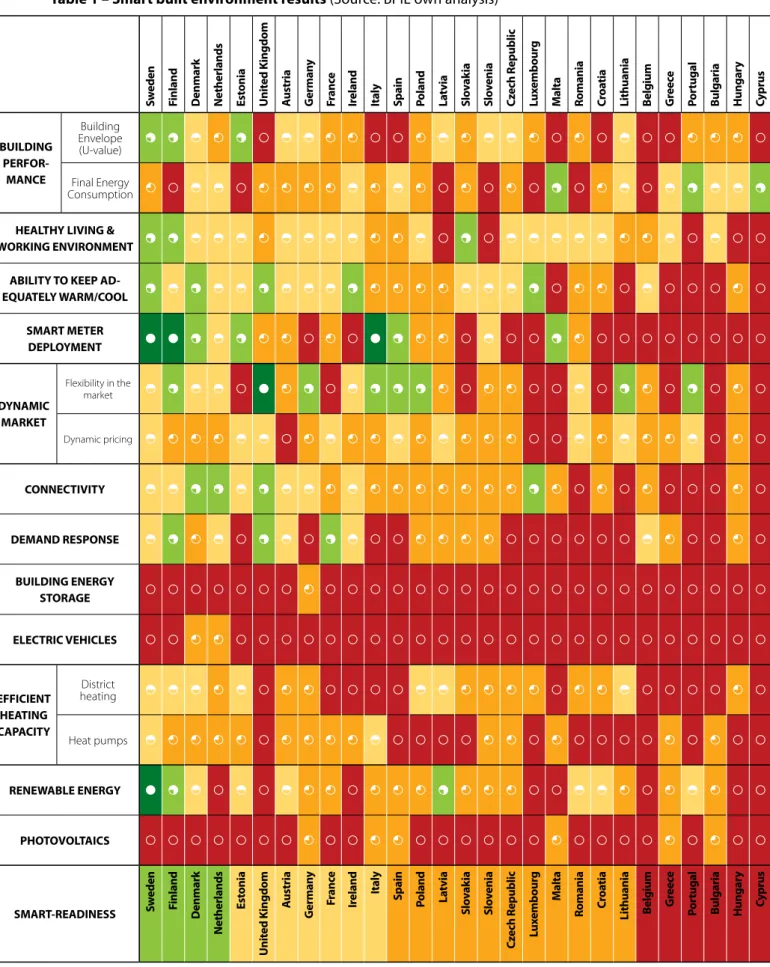
The boxplot below shows the average score for all countries divided into the four categories (described in Figure 2). The light blue and red colors in the background illustrate the average score among the top five and the bottom five countries, respectively. The figure shows that the big difference between the countries can be found under the categories efficient and healthy and dynamic operation.
This can be explained by the fact that the top countries have more insulated and healthier buildings, better smart infrastructure (smart meters and connectivity) and better prepared regulatory frameworks (demand response and dynamic pricing). The average score for the categories responsive energy system and renewable energy absorption varies from low to very low. The overall modest score illustrates that the EU has a major infrastructure challenge to ensure that the building stock is future-proofed and contributes to climate change mitigation and adaptation.
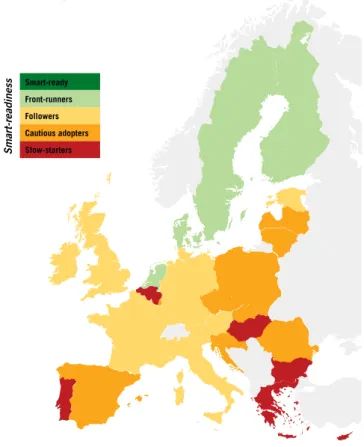
Sweden, Finland, Denmark and the Netherlands are the leading countries, thanks to progressive policies such as the roll-out of smart meters and investments in renewable energy. But even in these countries there is room for improvement, due to the rather closed markets for demand response and the lack of market penetration for building energy storage capacity. Most slow starters score low on all indicators except final energy consumption, which can be explained by climate conditions and financial constraints, rather than by highly developed energy efficiency measures.
This is confirmed by the low score for the same countries in the indicator's ability to adequately retain warmth/cooling. The overall low result can be partly explained by rigid regulatory frameworks (see demand response and market flexibility), lack of investment (see energy performance of buildings and smart meters), but also by the recent market penetration of some from the indicators, such as such as energy storage in buildings, electric vehicles and demand response. Energy conservation in buildings and electric vehicles are the two indicators with the lowest overall score.
However, interest in these solutions is growing rapidly, characterized by falling prices and an increase in service offerings. In the case of electric vehicles, the Netherlands is at the forefront with almost 10% of newly registered vehicles being electric, while Germany - through a building energy storage program - has managed to greatly increase the market share of smart and environmentally friendly alternatives . . Sweden Sweden Finland Denmark Netherlands Netherlands Estonia Estonia United Kingdom United Kingdom Austria Austria Germany Germany France France Ireland Ireland Italy Spain Spain Poland Poland Latvia Slovakia Slovakia Slovenia Slovenia Czech Republic Czech Republic Luxembourg Luxembourg Malta Malta Romania Romania Croatia Croatia Lithuania Lithuania Bulgaria Bulgaria Portugal Bulgaria Bulgaria Bulgaria Hungary Cyprus Cyprus.
FOUR KEY INDICATORS UNDER THE SPOTLIGHT
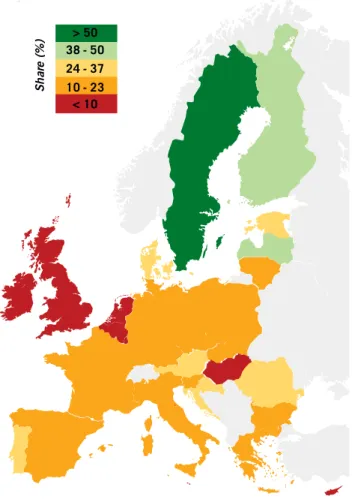
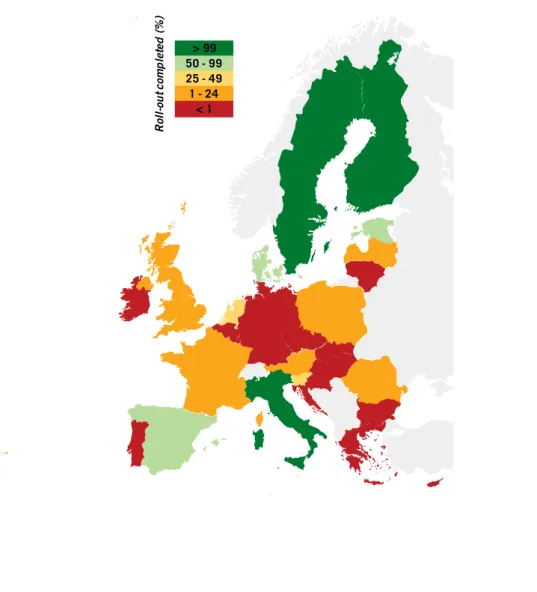
The following figures illustrate how poor the energy performance of the European building stock is, both in terms of designed and actual energy use. Very often, this behavior leads to the calculated final energy demand and the actual measured final energy demand being very different. The EU “aims to replace at least 80% of electricity meters with smart meters by 2020, wherever it is cost-effective to do so” [25].
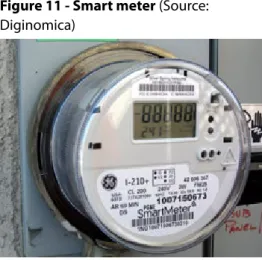
A smart meter is an electronic device that registers energy consumption and should enable two-way7 communication between the consumer and the utility company. Accurate measurement of energy consumption to obtain real-time data on energy consumed is a prerequisite for valorizing demand response services. Without smart meters that allow end-users – in particular residential and commercial users – to be compensated for the savings achieved through demand response actions, the market will lose its main driver and the full use of demand response may be blocked.
Sweden, Finland and Italy have completed the roll-out of smart meters – over 95% of homes are equipped with smart meters. The early adopters – Sweden and Italy – are currently preparing an upgrade of their smart meters. Demand response is an important enabler of security of supply, integration of renewables, increased competition in the market and empowerment of end users.
Industrial, commercial and residential end-users could engage in demand response by taking various actions: temporarily reducing energy consumption without changing consumption in other periods (e.g. lowering indoor temperatures), shifting energy demand to other time periods (e.g. a building before peak periods ) or temporarily use onsite production instead of energy from the grid (eg production from renewable energy sources). The results reflect the Smart Energy Demand Coalition's (SEDC) assessment [8] of "consumer8 access to demand response" in 149 EU Member States and the Joint Research Center's (JRC) [9] qualitative status assessment of demand response in all 28 Member States. SEDC's reviews the regulatory framework in all countries and assesses how open the market is to demand responses (from commercially active to closed), while the JRC analyzes the state of national regulation regarding the application of Article 15.8 of the Energy Efficiency Directive.
Their study evaluates, among other things, the acceptance of market demand response (which allows consumer load) and the status of legalization and enabling of demand aggregation. Rather, it is an assessment of the amount of renewable energy in the energy system, as more also means that the market and public authorities will encourage increased demand flexibility and smart control. The European average in 2014 was 16%, on track towards the EU's renewable energy targets of 20% in 2020 and 27% in 2030, although a decarbonised building stock will require a much higher proportion of renewable energy.
![Figure 6 - Building envelope (U-value of building envelope for residential and non-residential buildings) (Source: EU Building Stock Observatory [2])](https://thumb-eu.123doks.com/thumbv2/9pdfco/19306990.0/18.892.110.774.660.1171/building-envelope-building-residential-residential-buildings-building-observatory.webp)
SMART LEGISLATION FOR A SMART BUILDING STOCK
KFW PUSH FOR PV HOME-STORAGE SOLUTIONS IN GERMANY
SWEDEN HAS ALREADY FINISHED THE DEPLOYMENT OF SMART METERS
FRANCE IS OPENING UP FOR DEMAND RESPONSE
DISTRICT HEATING IN DENMARK BRINGS ENERGY SECURITY, RENEWABLES AND SMART CITIES
HEAT PUMPS IN FINLAND
AMSTERDAM IS BOOSTING THE ROLL-OUT OF ELECTRIC VEHICLES
SMART CASE STUDIES
SMART OFFICE BUILDINGS
THE STORY PROJECT - RESIDENTIAL STORAGE, LOAD SHIFTING AND FLEXIBILITY
SMART DISTRICT OF ASPERN – SELF-LEARNING SYSTEMS OPTIMISING ENERGY USE
CITY-ZEN – THE VIRTUAL POWER PLANT AND VEHICLE2GRID PROJECT
SUPERMARKET AND DISTRICT HEATING CONNECTIVITY
ENERGY STORAGE AND EFFICIENCY FOR A SMART HOTEL
INTELLIGENT FAÇADE
CONCLUSION
KEY TAKEAWAYS FROM THIS REPORT
BIBLIOGRAPHY
34] Amsterdam Round Table Foundation, “EVolution - Electric vehicles in Europe: preparing for a new phase?”, [Online] Available: http://www.mckinsey. 38] Aspern Smart City Research, "Aspern Smart City Research - Energy Research Shapes the Future of Energy", vol. 43] Multifunctional Energy Efficient Facade System (MEEFS), “Second Reporting Period - Publishable Progress Summary”, [Online] Available: http://.
44] European Commission, "Commission proposes new rules for consumer-centric clean energy transition," [Online] Available: http://ec.europa. 45] European Commission, "Directive of the European Parliament and of the Council - amending Directive 2010/31/EU on the energy performance of buildings," no.
![Figure 9 shows the level of demand response availability across the EU. The scores reflect the Smart Energy Demand Coalition’s (SEDC) assessment [8] of “consumer 8 access to demand response” in 14 9 EU Member States and the Joint Research Centre’s (JRC](https://thumb-eu.123doks.com/thumbv2/9pdfco/19306990.0/20.892.173.722.584.1146/figure-response-availability-coalition-assessment-consumer-response-research.webp)