Higher carotid-radial pulse wave velocity is associated with non-melancholic depressive symptoms in men - findings from the Helsinki Birth Cohort Study. Non-melancholic depressive symptoms are associated with above-average fat mass index in the Helsinki Birth Cohort Study.
Overview of Depressive Symptoms
Subtypes of Depressive Symptoms
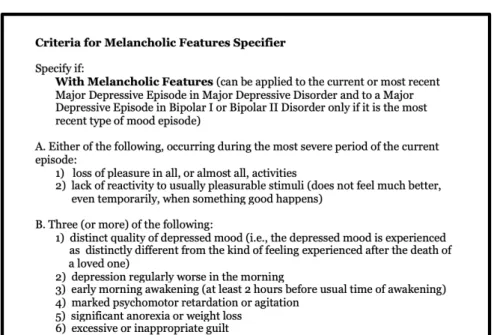
MDD can be classified as psychotic, with catatonic features, with melancholic features, with atypical features, or with postpartum onset (American Psychiatric Association, 1998). Postpartum onset will not be discussed here, as it has to do with timing rather than specific symptoms displayed.
Grouping into Melancholic and Non-Melancholic Subgroups
Epidemiology of Depressive Symptoms
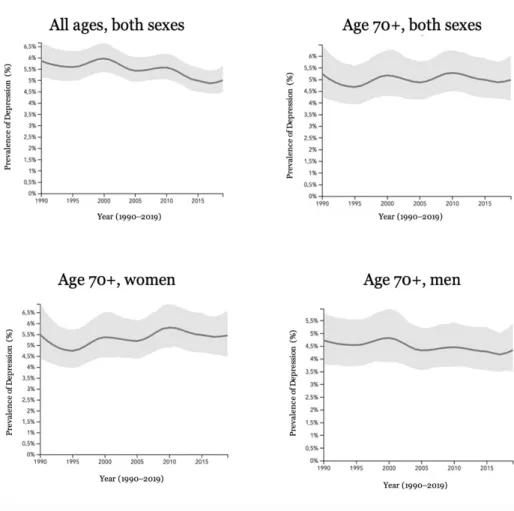
Prevalence and Burden of Disease
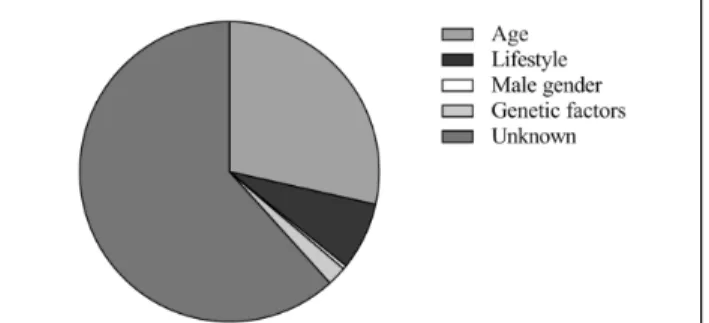
Sociodemographics of Depressive Symptoms
On the other hand, it has also been suggested that depression may be more common among younger individuals and that neither income nor education has any effect on depression (Markkula et al., 2017). Globally, depression has been found to be more common in high-income countries (Bromet et al., 2011).
Epidemiology of Depressive Subtypes
However, a study in the United States found a significant difference in the prevalence of depression between ethnicities, with African American, Asian, and Hispanic adults showing lower odds of MDD than white people (Hasin et al., 2018).
Detection of Depressive Symptoms
Diagnostic and Statistical Manual of Mental Disorders-IV
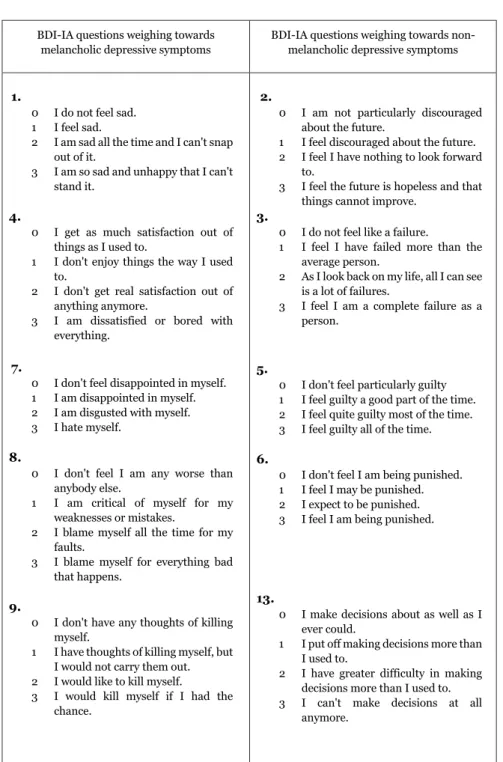
The Beck Depression Inventory
Pathophysiology of Depressive Symptoms
- Biological Dysregulations
- Hypothalamic-Pituitary-Adrenal-axis
- Glucose Metabolism
- Body Composition
- Inflammatory Pathways
- Vascular Factors
- Genetics
- Environmental and Psychological Factors
- Lifestyle choices
- Smoking
- Alcohol
- Physical Activity
Furthermore, a causal relationship between cortisol and depression has been suggested in Cushing syndrome (Milano et al., 2020). Even at subclinical levels of depression, the association with CVD is evident (Harshfield et al., 2020).
Novel Aspects of Pathophysiology of Depressive Symptoms
- Depressive Symptoms and Advanced Glycation End
- Advanced Glycation End Products
- Underlying Mechanisms
- Subtypes of Depressive Symptoms and Advanced
- Depressive Symptoms and Pulse Wave Velocity
- Depressive Symptoms and Body Composition
- Body Composition
- Underlying Mechanisms
- Subtypes of Depressive Symptoms and Body
- Depressive Symptoms and Glucose Metabolism
- Impaired Glucose Regulation
- Underlying Mechanisms
- Subtypes of Depressive Symptoms and Glucose
- Depressive Symptoms and Mortality
- Depressive Symptoms and All-Cause Mortality
- Underlying Mechanisms
- Subtypes of Depressive Symptoms and Mortality
Depression and depressive symptoms have been shown to be associated with arterial stiffening (Onete et al., 2018). Some gender differences have been shown in the relationship between depression and body composition (Luppino et al., 2010).
Helsinki Birth Cohort Study
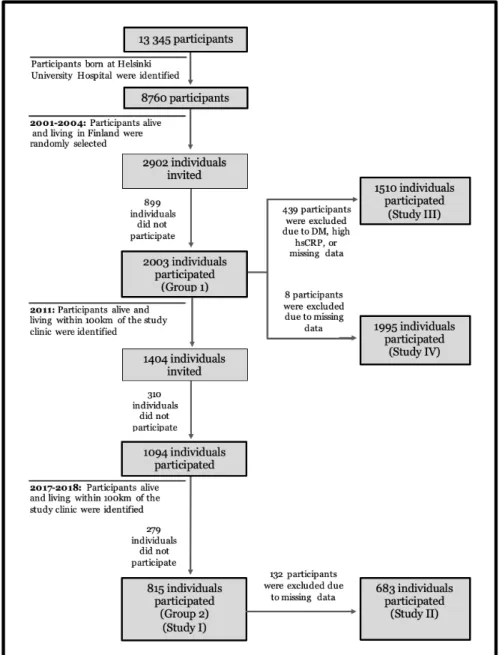
Study Participants
Methods
- Questionnaires
- Depressive Symptoms
- Sociodemographic Factors
- Lifestyle Factors
- Health and Medication
- Physical Examination
- Blood Pressure
- Height, Weight, Body Mass Index
- Advanced Glycation End Product Measurements and
- Pulse Wave Velocity Measurements and Analysis
- Body Composition Measurement and Analysis
- Laboratory Measurements
- Mortality
Criteria B.3, B.5, and B.6 are represented by the BDI-IA questions regarding changes in sleep, appetite and weight changes, and feelings of punishment, respectively. The initial study using this categorization method (Seppälä et al., 2010) used both the BDI-IA and the Mini International Neuropsychiatric Interview (MINI) (Sheehan et al., 1998). This supports the use of the BDI-IA method for categorizing depressive subtypes, as its use has been validated by this comparison (Seppälä et al., 2010).
The five-question MHI-5 was used in Study I to screen for mood disorders and was compared with BDI-IA scores for validity. The MHI-5 addresses feelings of nervousness, calmness, happiness, feelings of frustration, and inability to be happy (Rumpf et al., 2001). Questions are rated on a Likert scale and standardized to a 0-100 scale using linear transformation (Rumpf et al., 2001).
MHI-5 scores were compared with BDI-IA scores to validate the measurement of depressive symptoms. Metabolic equivalent task (MET) values were assigned to each type of activity based on available databases (1 MET = 3.5 ml O2/kg/min) (Ainsworth et al., 2011).
Statistical Analyses
Ethics
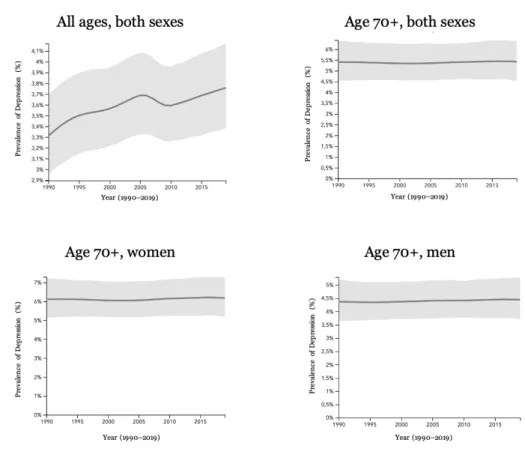
Prevalence of Depressive Symptoms
Within the depressed group of study III, 75% of women and 53% of men belonged to the NMeD group, and 25% of women and 47% of men to the MeD group, respectively. No difference was found in the gender distribution between subjects without depressive symptoms and MeD symptoms (Studies III and IV). There was a significant difference in depressive distribution between genders (Study I), with depressive symptoms being more common in women than in men (p<0.001).
No difference in gender distribution was found between the MeD group and the non-depressed group. No significant differences were noted when comparing the entire depressed group with the non-depressed group with regard to blood pressure, plasma glucose, hsCRP, BMI, smoking status and prevalence of DM (Study II). However, when the depressed participants were separated into depressive subtypes, Study III found that both depressed subgroups had higher prevalence of CVD than the non-depressed, and the NMeD group also had more lung disease than the non-depressed group.
In Study IV, the NMeD group had more CVD, lung disease, and diabetes than the non-depressed group, but no differences were found for cancer or between the other groups. Depressive symptoms were also associated with lower LTPA (p=0.002), lower likelihood of cohabitation (p=0.045), and lower likelihood of financial satisfaction (p<0.001).

Advanced Glycation End Products and Depressive Symptoms (Study I)
Subtypes of Depressive Symptoms and Advanced Glycation End
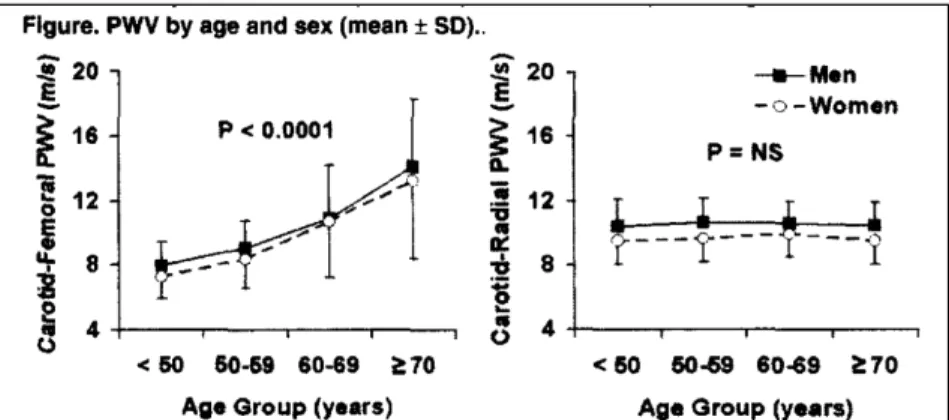
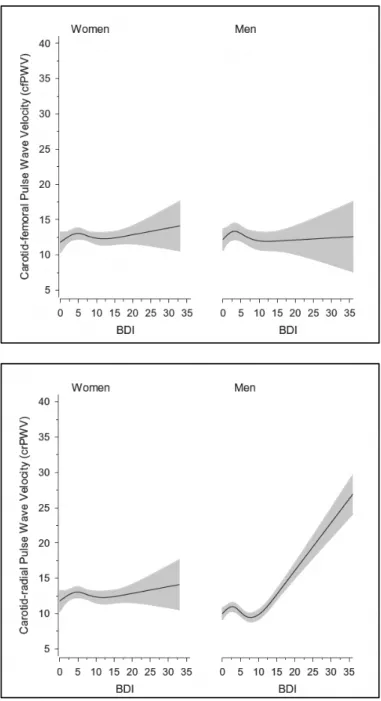
Pulse Wave Velocity and Depressive Symptoms (Study II)
Pulse Wave Velocity in Non-Melancholic Depressive Men
CCI=Charlson comorbidity index, cfPWV=carotid-femoral pulse wave velocity, crPWV=carotid-radial pulse wave velocity, DS=depressive subtypes, NMeD=non-melancholic depressed, MAP=mean arterial pressure, <10depressed, MeD=melancholic <10 BDI-IA points= non-depressive.
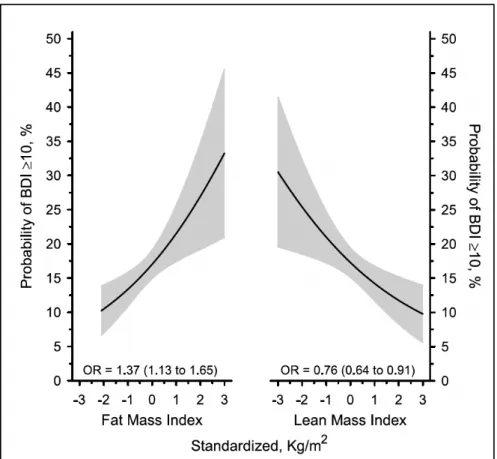
Body Composition and Depressive Symptoms (Study III)
Non-Melancholic Depressive Symptoms and Body Composition
Melancholic Depressive Symptoms and Body Composition
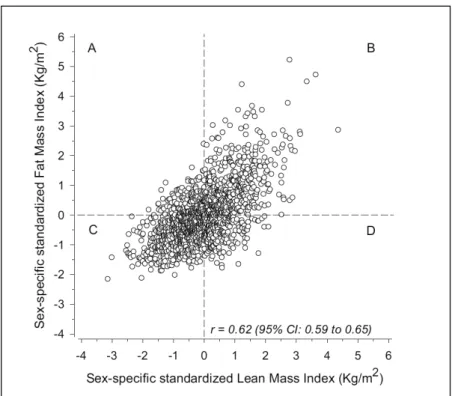
FMI = fat mass index, LMI = lean mass index, NMeD = non-melancholic depression, MeD = melancholic depression.
Glucose Metabolism, Body Composition, and Depressive Symptoms
All-Cause Mortality and Depressive Symptoms (Study IV)
Causes of Death
The highest percentage of deaths are caused by neoplasms (C00-D48), both when looking at each depressive subgroup separately and overall. The same applies to diseases of the circulation (I00-I99), which are the second most frequent cause of death. The other categories for causes of death were certain infectious and parasitic diseases (A00-B99), diseases of the blood and blood-forming organs and certain diseases involving the immune mechanism (D50-D89), endocrine, nutritional and metabolic diseases (E00-E90), mental, behavioral and neurodevelopmental disorders (F00-F99), diseases of the nervous system (G00-G99), diseases of the respiratory system (J00-J99), diseases of the digestive system (K00-K93), symptoms, signs and abnormal clinical and laboratory findings, not elsewhere classified (R00-R99), and external causes of morbidity (V01-Y98).
Standardized Mortality Ratio
Focusing on AGEs, PWV, body composition, glucose metabolism and mortality in individuals from the HBCS, certain differences between the two depressive subtypes were established. MeD symptoms appear to be more closely related to AGE and mortality, while NMeD symptoms are more closely related to PWV, body composition and glucose metabolism. The differences in pathophysiology may suggest that the depressive subtypes are caused by different pathology or even represent different disease processes with similar depressive symptoms.
Participants
Methods
- Assessment of Depressive Symptoms
- The Beck Depression Inventory
- Self-Reported Questionnaires
- Clinical and Laboratory Measurements
- Mortality
The BDI was originally intended for use as a tool by professionals (Beck et al., 1961). In addition, other psychiatric symptoms such as anxiety have been found to be detected when using the BDI as a screening tool for depression (Kotiaho et al., 2019). As discussed in the Methods section, the BDI-IA omits two of the DSM-IV criteria for the melancholic specifier.
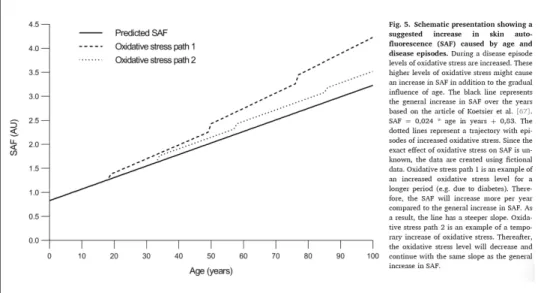
Considering that depressive symptoms in studies I-IV are defined on the basis of self-reports, it would not be expected that self-reported psychomotor symptoms would be accurately reported even if they had been examined. However, even DSM-IV does not require that all criteria be met for each specifier to be applicable. SAF measurements of AGEs have been validated for use by previous studies (Meerwaldt et al., 2004; van Dooren et al., 2017).
Each participant in Study I had non-pigmented skin as recommended for SAF readings (Meerwaldt et al., 2004). Participants were divided into four groups based on combinations of LMI and FMI in order to be able to compare said groups among themselves.
Results
- Prevalence of Depressive Symptoms
- Depressive Subgroups
- Sociodemographic and Lifestyle Factors Associated with
- Advanced Glycation End Products and Depressive Symptoms
- Pulse Wave Velocity and Depressive Symptoms (Study II)
- Body Composition and Depressive Symptoms (Study III)
- Glucose Metabolism and Depressive Symptoms (Study III)
- All-Cause Mortality and Depressive Symptoms (Study IV)
The effect of lifestyle factors on depressive symptoms has been shown to be minimal (Penninx et al., 2013). Vascular factors and depression have been suggested to influence AGEs (Spauwen et al., 2015). The formation of AGEs causes vascular stiffness (Sell & Monnier, 2012), which in turn is known to be associated with depression and depressive symptoms (Onete et al., 2018).
However, it has been suggested that as a measure of comorbidities it is significantly more reliable in younger individuals (Emmerink et al., 2018). It has been suggested that no differences in cfPWV exist between depressed groups for either gender at ages above 60 years (Onete et al., 2018). Aging has been suggested to enhance the relationship between PWV and inflammation (Zanoli et al., 2018).
This makes sense as metabolism is known to be more closely linked to NMeD (Lamers et al., 2013; Penninx et al., 2013). This finding is consistent with previous research that has shown that metabolic factors are more closely associated with NMeD symptoms (Lamers et al., 2013).
Strengths and Limitations
It is possible that some level of survival bias appears in the thesis population. Participants are all older, and some of the sickest individuals may have already died or may not have chosen to participate due to poor health. This opens the door to the possibility that the study participants were healthier than the average person.
This may also mean that some of the people who were in the worst health were unable to have their AGEs or PWVs measured, and were therefore eliminated due to missing data. The nature of the grouping is complicated as there is no precise or globally agreed upon way to categorize individuals into these subtypes. The methods used in the thesis have been widely used in HBCS as well as in other studies in Finland.
However, if others were to categorize individuals using the same diagnoses and the same symptoms, they may decide to place more weight on some factors than others, possibly leading to slightly different categorization than the one used in this thesis. . The fact that the method used in this thesis has been widely used in different populations gives it some strength.
Implications for Future Research
Gender differences in subtypes of depression by first incidence and age of onset: a follow-up of the Lundby population. The health and productivity cost burden of the “Top 10” physical and mental health problems affecting six major US organizations of the stress system and its dysregulation in melancholic and atypical depression: high versus low CRH/NE states.
Accuracy of self-reported smoking: A systematic review of the relationship between self-reported and cotinine-assessed smoking status. Influence of central-peripheral arterial stiffness gradient on the timing and amplitude of wave reflections. 2007 Guidelines for Management of Arterial Hypertension: The Task Force for Management of Arterial Hypertension of the European Society of Hypertension (ESH) and the European Society of Cardiology (ESC).
CHARGE Inflammation Working Group and Major Depressive Disorder Working Group for Psychiatric Genomics. Prevalence of depression in people with impaired glucose metabolism or undiagnosed diabetes: A systematic review and meta-analysis of the European Depression in Diabetes (EDID) Research. Applicability of the Beck Depression Inventory as a screening method for depression among the general population in Finland.
The Mini-International Neuropsychiatric Interview (M.I.N.I.): The development and validation of a structured diagnostic psychiatric interview for DSM-IV and ICD-10.