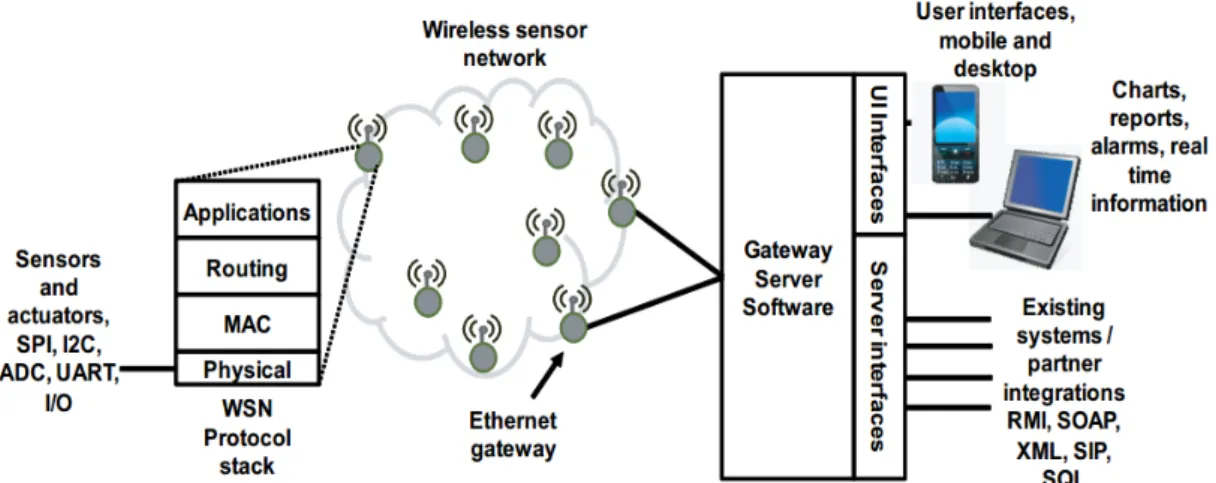
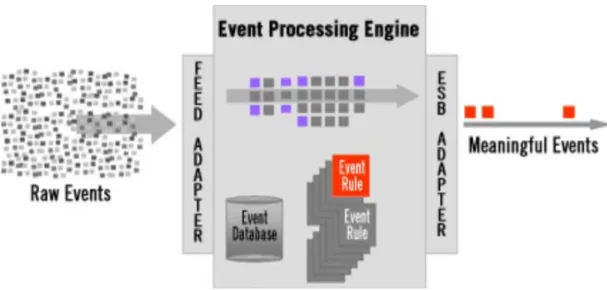
通过 TCP/IP 连接。原始数据通过用户定义的过滤器传递。过滤掉不相关的数据,并对相关数据进行分组。当数据满足预定条件时,启动相关数据处理机制。
Introduction
- Background
- Objectives
- Research methodology
- Thesis outline
Traditionally, the task of monitoring the building's energy consumption performance is fulfilled by the building automation system (BAS). In the first part, the standard for evaluating lighting energy consumption in commercial buildings is described.
Literature and Technology Review
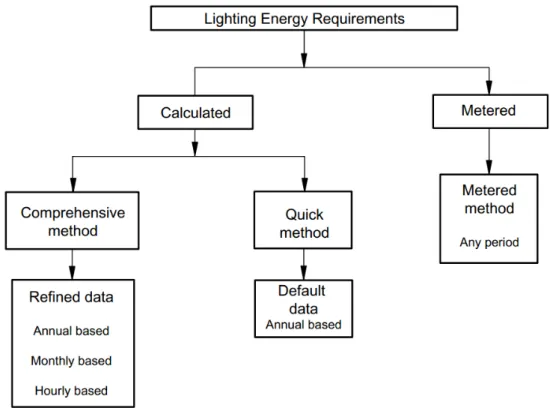
Concept of energy consumption standard
Methodology of energy consumption standard
Fc is the constant illuminance factor, tD is the use of daylight, Fo is the occupancy factor, FD is the daylight factor, tN is the non-daylight use. 7 From the standard BS EN 15193:2007 provides the default value of daytime use, non-daytime use and annual working hours.
Characteristic indicator of energy consumption standard
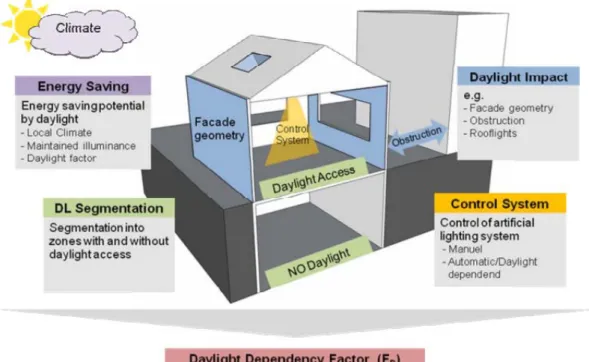
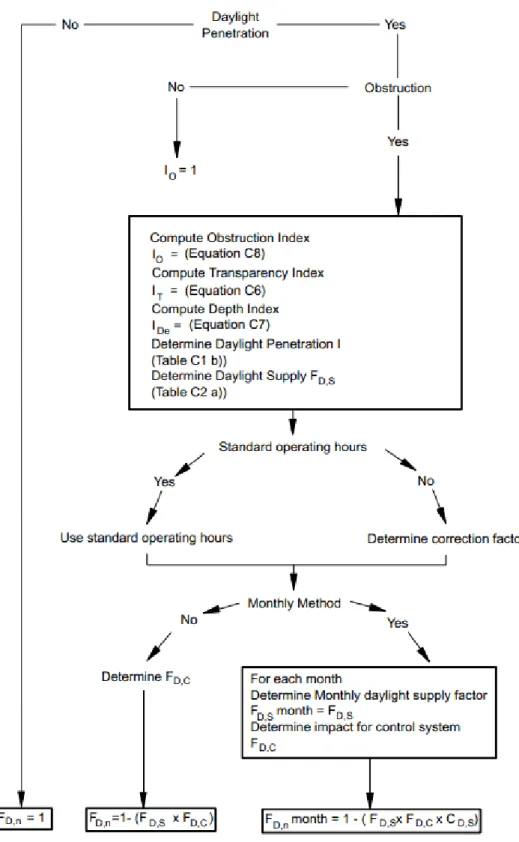
- Daylight dependent artificial lighting control factor
- Determination of daylight supply factor
- Determination of the daylight dependency factor
- Determine of occupancy dependency factor
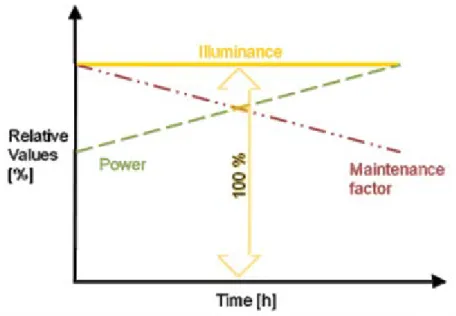
- Determination of constant illuminance factor
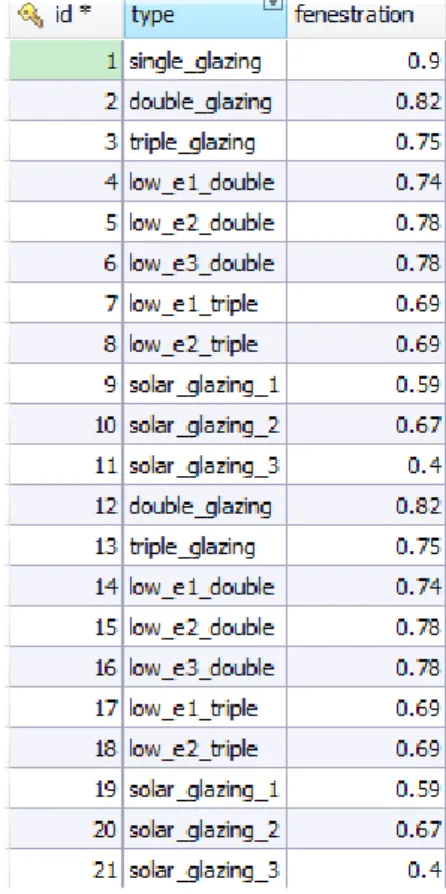
The direct hemispheric transfer of the fenestration factor is defined by Table 3, which is stored in the database. The daylight dependence factor is a function of the daylight factor and the control factor of the control factor of daylight-dependent artificial lighting.
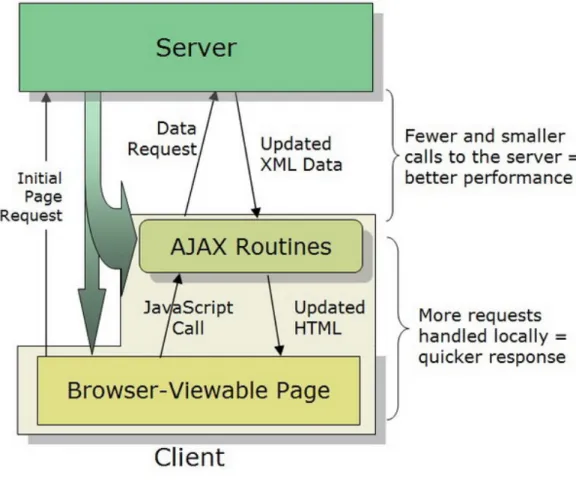
Web Service
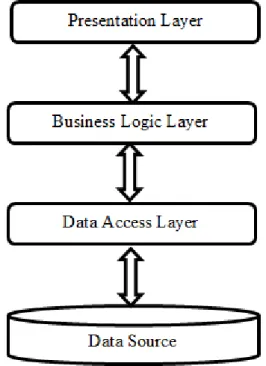
- Three tier architecture
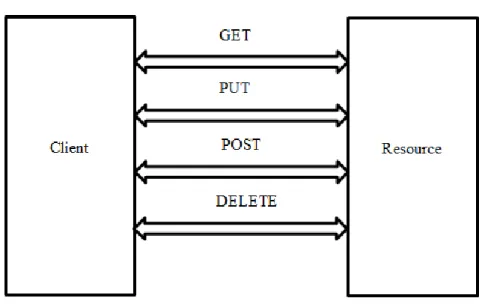
- Introduction to representational state transfer
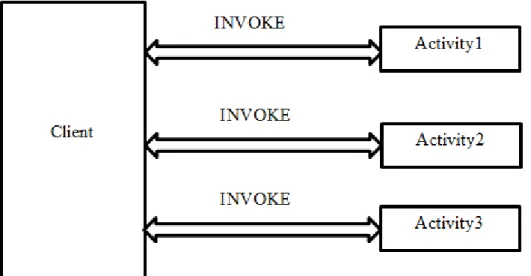
- Introduction to simple object access protocol
- Comparison between REST and SOAP
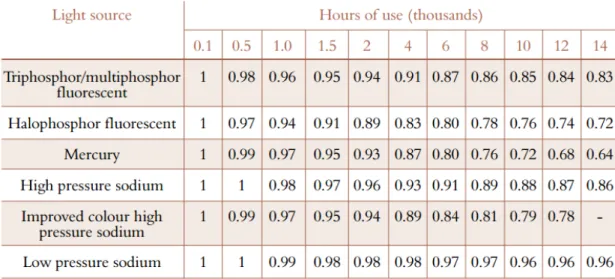
22 influence of room index, fixture type and clean interval on room surface maintenance factor can be seen from Table 13 [17]. Due to object-relational impedance mismatch, the data is exchanged between different formats, and the action of crating, deleting, updating and searching can be achieved. The advantage of this protocol is that application can be deployed on different hardware platforms with different operating systems, since the exchange message is XML file.
The process of message processing is that the content of the header must be properly handled, and then the message content of the body part can be read. The representation of each state includes links that can be used in the future when the customer decides to start a new transition. In the contract, the extensibility of SOAP is highly valued, which leads to the fact that the application can be easily modified and integrated with a new component.
Related work
Research method
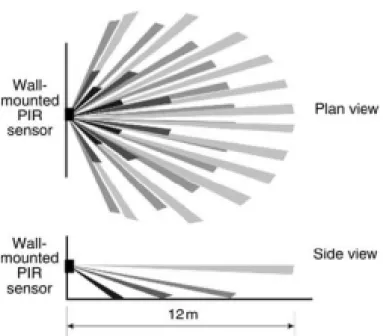
Occupancy sensor
Illuminance sensor
Wireless sensor network
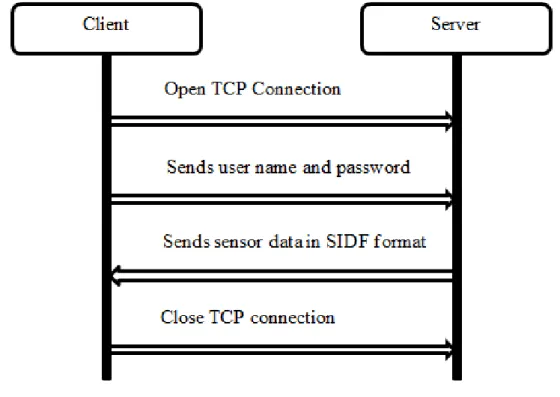
31 In order to receive sensor data from the company, the connection between the client side and the server is first established. The server runs on the company's computer and has a socket that listens for requests from the client. On the client side, it will try to connect to the server with the default server address, port number and password set by the company.
After the connection is established, the server will create a new socket bound to the same port, allowing the server to handle the request from the client side, continue to listen, and search for a new client. At this point, the client can send a request to the server, and in turn, the server will send a response back to the client with the associated data. The transferred messages are in XML format, which is shown in Program 3.1.
Event Processing
- Event processing engine
- Introduction to implementation of event processing engine
Normally reference or threshold value is stored in the database, event processing engine keeps comparing between real time values and reference one. It is based on real-time event driven architecture and is used to trigger action specified in plain old java object (POJO) if specific requirement is met. The principle of Esper is based on the second method, the events stored in the database are the only relevant event.
The information source, format, content, and relationship between entity events are used to define the event flow. Specifying the event format representation and EPL declaration is the final step to complete the construction of the Esper application. There are two ways to define pattern detection, one is EPL pattern declaration, the other is match recognition.
Data base connection
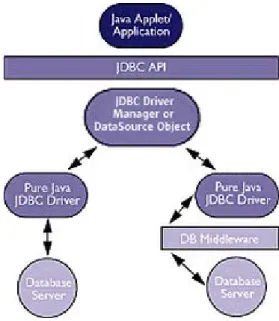
- Java database connectivity
- Hibernate framework
For reusability, prepared statement is customized as it is cached and can be executed repeatedly. The Hibernate mapping file responsible for mapping the properties of the POJO to columns in the table is created. JDBC drivers are also included in the classpath as they are independent of each other.
Within a session, the operation of adding, deleting, updating and querying object can be performed and the result remains. The Hibernate session can be extracted from the SessionFactory and the codes are linked together so that the functionality of Hibernate can be accessed from the Java application. The advantage of Hibernate can be further exploited by supporting the Spring framework, which offers persistence object support.
Web application structure analysis
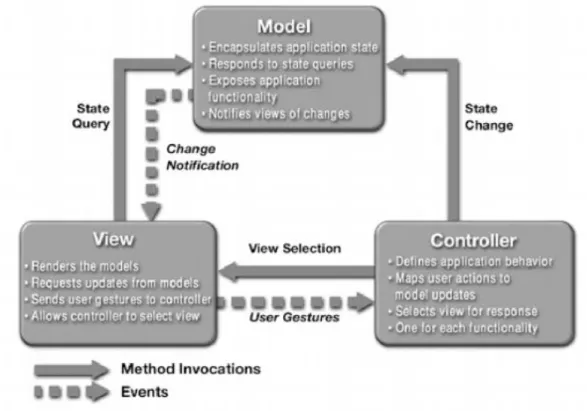
- Model-view-control structure
- Struts web application
- Struts 2 web application
- Spring model-view-control
- Web application structure comparison
- Integration of Spring framework with Hibernate framework
After this data manipulation, the result can be forwarded to another resource using action or the logical name of the path to another page stored in ActionForward. The target page can be found according to the style store in the ActionForward of the servlet to complete the response process. In the Struts framework, it has its own controller, which can be integrated with model and view from other technology.
The handler method in the controller class is marked by @RequestMapping and the request passing through controller can be directed to the correct handler method by handler mapping. Spring is more than just presentation layer framework, it is a complete J2EE framework and can be integrated with other framework. With the help of Spring framework, all those objects are registered in IOC container and the property of objects can be easily configured.
Spring Web Service
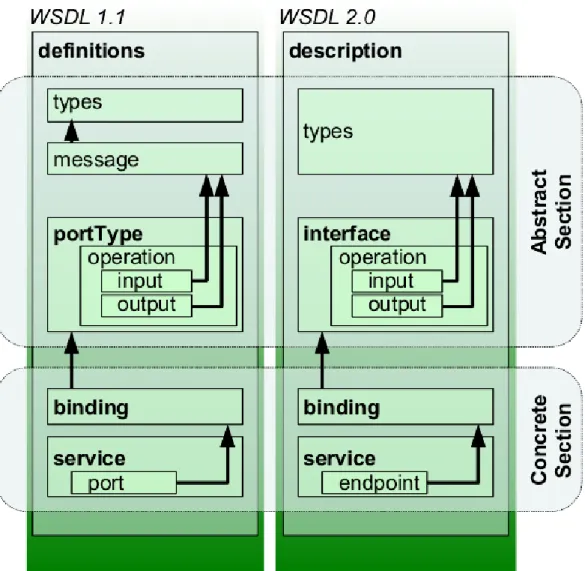
- Web service definition language
- Java architecture for XML binding
- Inversion of control
- Spring web service
The combination of XML and Java offers the possibility of exchanging data on different platforms, since XML is a standard for transferring messages over a distributed system, and the Java language provides a platform for portable applications. Getter and setter methods inside classes are used to define element and attribute properties. After demarshaling, a java object representing the XML message is created, as shown in Figure 20 [40].
Dependency injection is used to join the independent object to the loosely linked entity. There are several key components defined in Spring Web service on the server side, such as MessageDispatcher and Endpoint. The MessageDispatcher capability is the combination of DispatcherServlet and MessageDispather, which is configured in the web.xml file to delegate the mapping relationship.
Presentation technology
- Java server pages
- jQuery
- Tiles
- Google chart
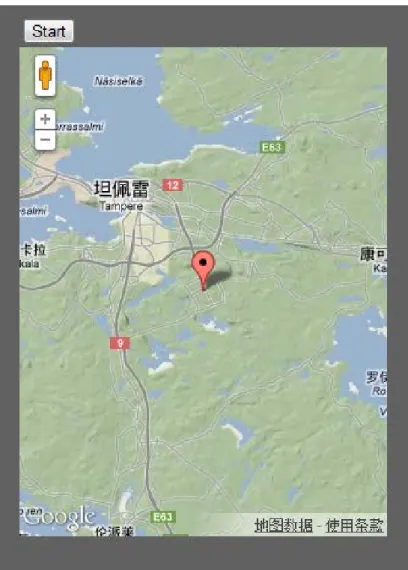
- Google Map
Web pages with similar structure and different content of each section in different situations can be designed by the implementation of Tiles. The data table value is derived from the database and accesses the Spring MVC business layer. In the map library, several charts are represented as JavaScript classes and can be easily displayed on a web page.
Using the Google Maps Javascript API, the user can integrate the Google map into any web page or application. On the map layout, div element named by map_canvas is defined and the location is determined which is used to hold the Google Map. Then the Google Map object is created and the entire map is initialized when the web page loads.
Result
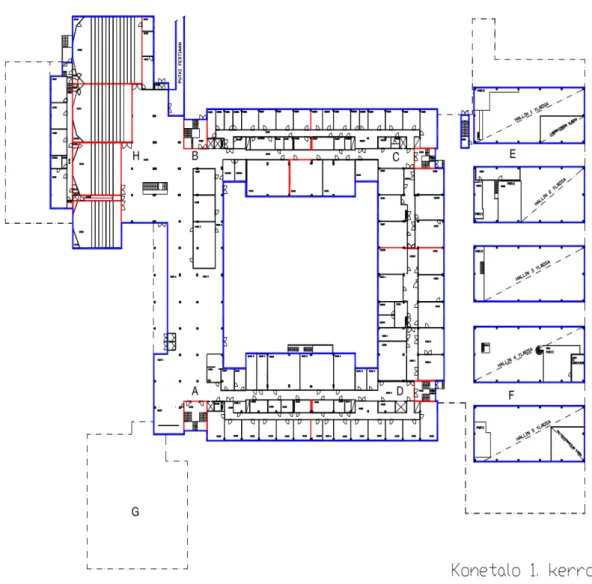
Introduction to test bed
This room is accessed by the student and used to use the computer for daily study. This room is open throughout the day and the user can enter and exit freely, so the activity pattern in this room changes over time. A sensor array mounted on the wall to monitor the light level of that space, and an activity sensor is used to detect activity.
Activity sensors are installed on the inside of this chamber, minimizing environmental interference. The illuminance sensor is installed at the level of the working plane and ensures an accurate measurement result. Highly sensitive activity can detect slight movements in this space and cause the lighting system to turn on immediately.
Event processing of wireless sensor network
The result of a preliminary investigation collects all information from all sensors. But not all activity sensors are interesting for the purpose of the project, because the preliminary data has no logical connection. As for the illuminance sensor, the instantaneous value change of the illuminance must be detected.
If the second event is detected and the third event does not occur, all the first events are tied to the second event and the match pattern will restart in the next round. Within a room, more than one activity sensor or light sensor can be output, message mixing phenomena can lead to wrong result. As for the automatic control scheme, the starting condition is the activity sensor with positive instantaneous change.
Implementation of Web application
The room number, lighting energy consumption, parasitic energy consumption, total energy consumption and energy indicator are listed in this table. Information on lighting energy consumption, parasitic energy consumption, total energy consumption and energy indicator is dynamically displayed. Theoretically, the energy consumption in the room depends on the dimensional characteristics, external lighting conditions and activity pattern.
When the user is directed to the visualization page, the energy consumption of different control schemes is compared. This fluctuation around benchmarking can be contributed to the calculation of the benchmark value, which is the average energy consumption over the whole month. 66 Figure 33 shows the monitored energy consumption of different control schemes per hour by means of a column chart.
Conclusions
Conclusion on the thesis work
The sensor can be easily reinstalled to another position according to the measurement requirement, as wireless communication eliminates hard wiring. Web application can allow any user to access the monitoring interface as long as the user can connect to the Internet. In the next step, the extraction of information about actual energy consumption from field devices is implemented by wireless sensor network and communication.
Energy performance of different schemes is recorded in the graph, which can be used as a reference for optmail control scheme design. Historical data can also be retrieved to study past activity pattern and user behavior. The actual energy consumption is accurately simulated by the web application and displays the activity pattern.
Future work
The implemented system provides detailed information on energy consumption in commercial buildings on an hourly and daily basis. Greater demands have been placed on the lighting system, as energy consumption is not the only factor to be taken into account. Energy consumption in commercial buildings mainly consists of lighting, heating, ventilation and air conditioning.
A comprehensive study of the energy consumption of commercial buildings with a wireless sensor network can be a very promising field of research in the future. 8]B.Anderson, "CEN/BT WG 173 EPBD Version V5-Explanation of the general relationship between the various CEN standards and the Energy Performance of Buildings Directive (EPBD) ("Umbrella Document")", December 2005. Manual for string = " select A .act_room as room, A.sensor_type_act as sensor_type, A.act_time as time, A.act_start as value, A.
APPENDIX A – Script for activity sensors
APPENDIX B – Script for illuminance sensors
APPENDIX C – Script for instantaneous value of activity sensor
APPENDIX D – Script for instantaneous value of illuminance sensor
APPENDIX E – Script for configuration of delay time
APPENDIX F – Script for energy consumption by manual control
APPENDIX G – Script for energy consumption by automatic control
APPENDIX H – Script for energy consumption by manual-automatic control