This report examines the problems of customer relationship management (CRM), especially customer segmentation and customer profiling, and how data mining tools are used to support the decision making. The growing interests in data mining tools have also fueled the growth of the data mining tools market.
![Figure 1: Communication with customers, B2B & B2C [Price99].](https://thumb-eu.123doks.com/thumbv2/9pdfco/19363941.0/7.918.286.601.316.510/figure-1-communication-customers-b2b-amp-b2c-price99.webp)
Customer segmentation
Customer segmentation is a term used to describe the process of dividing customers into homogeneous groups based on common characteristics (habits, tastes, etc.). Customer profiling describes customers by characteristics such as age, income and lifestyle. Intuition: While data can be very informative, marketers must continually develop segmentation hypotheses to identify the "right" data to analyze.
Customer profiling
In particular, the use of too many segmentation variables can be confusing, resulting in segments that are not suitable for making managerial decisions. Furthermore, effective segmentation strategies will influence the behavior of the customers they influence; necessitating revision and reclassification of customers.
Data collection and preparation
Classification variables
How much branding advertising is needed to make a group of customers aware of the offering.
Descriptor variables
Data preparation
Model building
- Data sampling
- Training, testing and validating the model
- Model deployment
- Updating the model
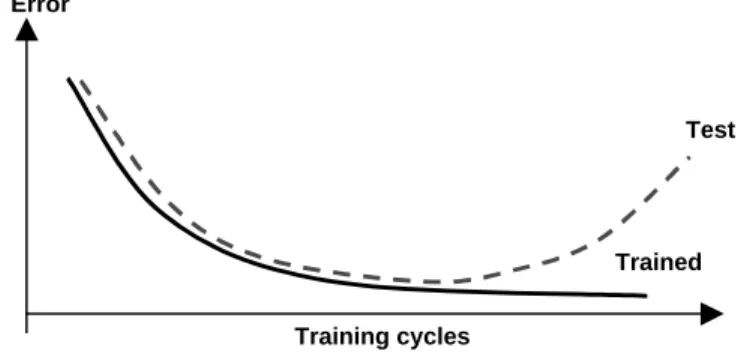
The validation set is often used from the data to assess the accuracy of the final model by comparing predictions from the model with known results. The control set is used (optionally) in some techniques during model building to control over-training.
Introduction
Monitoring models require constant revalidation of the model on new data to assess whether the model is still appropriate. There are several data mining methods (see reviews [HAS94, CHY96, GG99, Hall99]), and the decision of which to use can be determined by the quality of the data, the situation, and the goal.
K-Nearest neighbors
- Definition
- Algorithm
- Illustration
- Advantages/Disadvantages
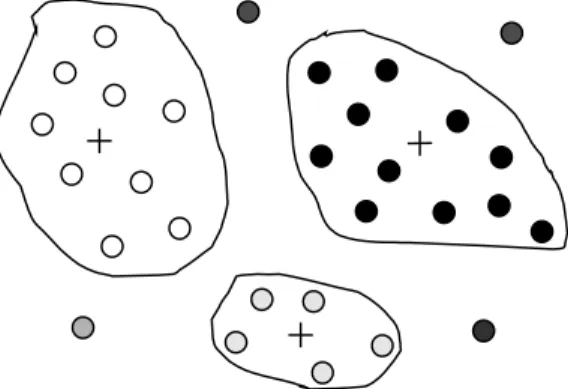
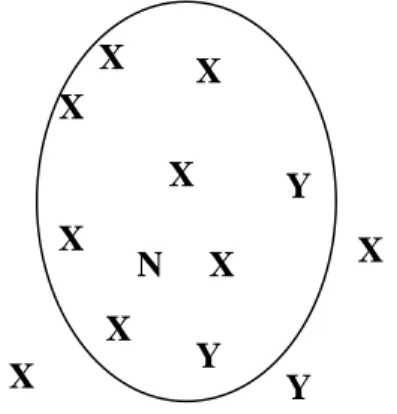
The algorithm calculates the distance of the new case to each case in the training data. Thus, the new case is assigned to the same class to which most similar cases belong (Figure 7).
SOM
Definition
Algorithm
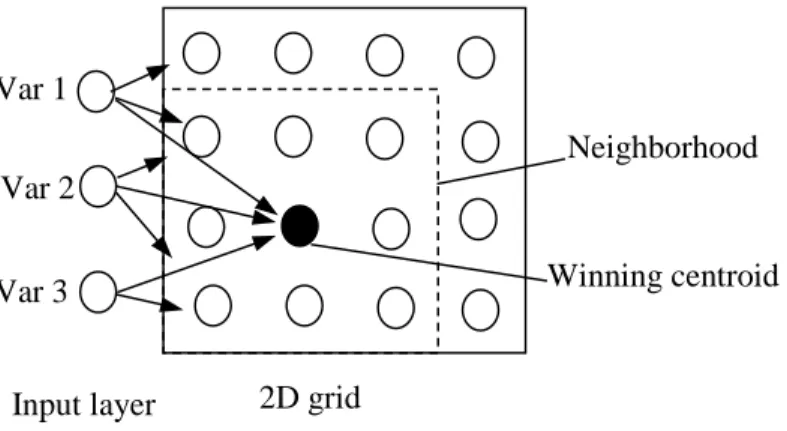
Reduce the size of the neighborhood and repeat the process until the neighborhood only includes the winning center. The cluster centroid closest to this client point is chosen to be the cluster center.
Advantages/Disadvantages
Use the "neighbor" function to identify neighboring centroids and move them to the data point;. In this way, the clustering starts as a very general process and continues to become more and more localized as the neighborhood decreases (Figure 8). At first approach, SOM is a technique that is quite difficult to handle and its outputs are not always easy to interpret.
Artificial neural networks
- Definition
- Terminology
- Illustration
- Advantages/Disadvantages
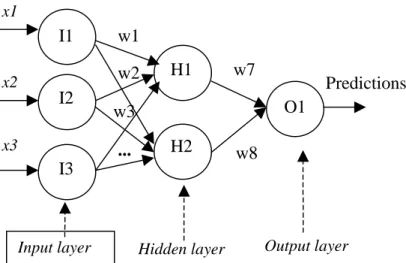
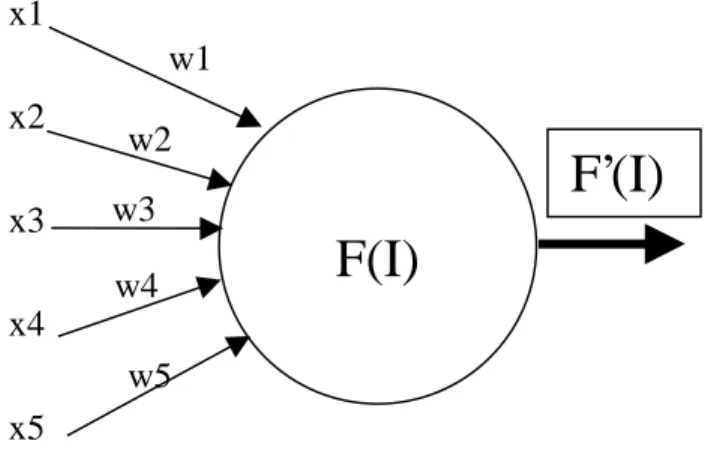
The activity of the input units represents the raw information fed into the network. The activity of each hidden unit is determined by the activities of the input units and the weights on the connections between the input and the hidden units (Figure 10). The behavior of the output units depends on the activity of the hidden units and the weights between the hidden and output units.
The hidden layer allows the network to recognize more patterns, so the number of hidden nodes often increases with the number of inputs and the complexity of the problem.
Decision trees
- Definition and terminology
- Tree induction
- Understanding the output
- Different decision algorithms
- Illustration
- Advantages/Disadvantages
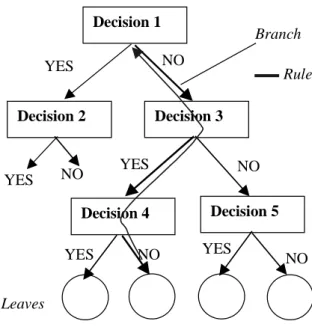
The training process that creates the decision tree is called induction and requires a small number of passes through the training set. Most decision tree algorithms go through two phases: a tree-growing (split) phase followed by a pruning phase. Commonly implemented decision tree algorithms include Chi-square automatic interaction detection (CHAID), classification and regression trees (CART), C4.5, and C5.0.
In addition, most decision tree algorithms require continuous data to be grouped or converted to categorical data.
Association rules discovery
- Definition and terminology
- Data format
- Algorithm
- Illustration
1% presence of A and B together is support and 80% is confidence rule. Only the following three items are defined as frequent, as they appear in more than 30% of transactions. The candidate pooling algorithm for large itemsets is critical to the performance of the algorithm.
It is the generation of the large 2-item sets that is the key to improving the performance of the algorithm.

Sequential patterns discovery
- Definition
- Time series
- Algorithm
- Illustration 1
- Illustration 2
- Advantages/Disadvantages
This example is taken in [Joshi97] with a customer sequence database shown below in Table 1. Here, the customer sequences are in transformed form where each transaction is replaced by the set of itemsets involved in the transaction and sets of items have been mapped to integers. The first pass over the database, done in the item set phase, produced sequences of length 1 (contains one item) shown in Table 16.
The major sequences along with their support at the end of the second, third and fourth passes are also shown in the following tables.

Other data mining methods
Which DM technology to use?
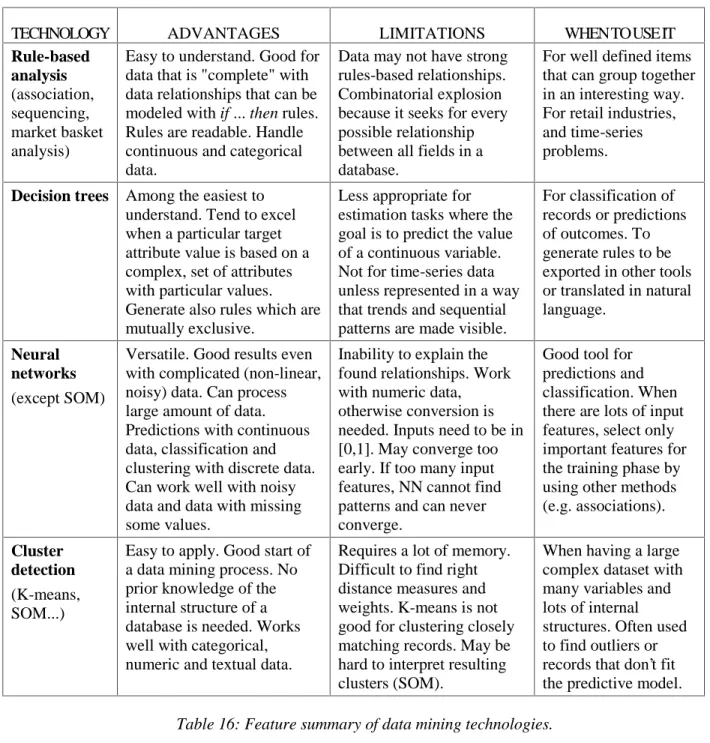
Furthermore, many of the associations sought and relationships found are not interesting and may never occur in reality. Since data mining is a knowledge discovery process, even when dealing with only one problem, it can be useful to have multiple algorithms at hand. In addition, different techniques may be needed at different stages of the data mining process.
In this case, the software will choose the best technology for the problem or can compare the results of the different technologies.
Internet marketing
Customer attraction with association
Web mining is the process of discovering and analyzing information from the World Wide Web [CMS97]. Web content mining deals with the discovery and organization of web-based information (eg, electronic libraries), and web usage mining addresses the problem of analyzing behavioral patterns from data collected about Internet users. In the following, when we refer to Web mining, it is the same as using the web.
Customer retention with sequential patterns
Cross-sales and attribute-orientated induction
Web data collection
Pageview is the number of requests of an entire web page, independent of the number of elements on that page. Ad clicks count the number of Internet users who visit the advertising company's website by clicking on the advertising object. Ad viewing time measures how long and advertisement is in the visible part of the browser window, and can therefore be seen by the Internet user.
It collects the IP address of the Internet user's computer, the type of browser he/she has, the URL of the visited page on which the web bug is located, the time the web bug was viewed, and a previously determined value of cookies.
Web data processing
View Time measures the time the internet user spends on a website (measured by a JavaScript code placed on the web page). While most of the data is generated by the way the Internet works (e.g. access to log files) or by analyzing the generated data (e.g. number of hits), some others are acquired using some specifically designed tools, eg. Another use of web bugs is to provide an independent count of how many people have visited a particular website.
Web bugs are also used to collect statistics about the use of the web browser at various places on the Internet.
Discovering association rules
In e-commerce, typical fields may contain the following: (CustomerKey, ProductKey, LocationKey, DateKey, SessionKey) as well as some statistical summary information (Quantity, TotalPrice, ClickThroughRate) [BM98]. After that, the log data is converted into a form suitable for a specific data mining task. For example, if 80% of the clients who accessed /company/Page1.html and /company/Page2.html also accessed /company/file1.html, but only 30% of those who accessed /company/Page3.html also accessed /company /products.html.
This observation may suggest that this information should be moved to a higher level (eg company.html) to increase access to file2.html (Figure 16.
Discovering time sequences and sequential patterns
In e-commerce, discovering the rules of the association can help develop effective marketing strategies, as well as an indication of how to better organize the organization's web space. Discovering consistent patterns in web server access logs allows web-based organizations to predict user visitation patterns and helps target ads to groups of users based on these patterns.
Classification and clustering
Clustering web data
Illustration
This is true for 3 out of 5 number of visits, so the support for this rule is 60 percent. Beauty pages will always go to the Planning Department to find out how far in advance of the wedding to order a dress, or when to make an appointment with the makeup artist. However, if we look at the reverse of the rule, If Planning, then Fashion & Beauty , the confidence is lower.
How long does it take to perform discovery on a large database? . c) Can the system run in parallel on a multi-processor server? .. a) Does the system only work on a single table or can it analyze multiple tables? . b) Does the system need to perform a large join to access all our tables? . c) If it works on a single table, how can we feed it our existing data schema?

New segment of potential loan customers
Because of these facts, there are few public examples of profiling and the companies involved often want to remain anonymous. 39% of people in the group had business and personal bank accounts. The group accounted for 27% of the 11% of customers classified by the decision tree as likely to respond to a home equity loan offer.
After more analysis, Bank of America produced new marketing materials for a campaign and resulted in more than double the initial acceptance rate for residential offers.
Predicting customer churn
When we applied the model to data from April 1998, we noticed that the number of customers in each segment often changed compared to data from March 1998. Due to the marketing program, the churn rate decreased in the first months. The churn rate of customers who responded to the promotion was very low (1.6% for a particular network), but the churn rate of non-responders was much higher (30.1%) than in the control group (17.1%). .
Since the marketing campaign was successful in reducing respondent attrition, it was planned to use data mining to predict both the probability of attrition and response to the offer.
The most profitable customers of online bookseller
Clustering means grouping data according to customer similarity without a predefined objective. We have to mention that within the same technology there may still be some variations in the data mining techniques, sometimes due to the specificity of the problems for which the tools are tailored. Short version in Proceedings of the 4th European Conference on Principles of Data Mining and Knowledge Discovery (PKDD'00), Lyon, France, September 2000.
Livny, "BIRCH: A New Data Clustering Algorithm and its Applications", Data Mining and Knowledge Discovery, vol.
![Figure 3: The information gathered into the historical database about the customer would be used to build a model of customer behavior and could be used to predict which customers would be likely to respond to the new catalog [Thearling00].](https://thumb-eu.123doks.com/thumbv2/9pdfco/19363941.0/13.918.228.655.683.956/information-gathered-historical-database-customer-customer-customers-thearling00.webp)

