Science Arts & Métiers (SAM)
is an open access repository that collects the work of Arts et Métiers Institute of Technology researchers and makes it freely available over the web where possible.
This is an author-deposited version published in: https://sam.ensam.eu Handle ID: .http://hdl.handle.net/10985/21115
To cite this version :
S. JÉGOU, M. TEODORESCU, L. BARRALLIER, F. GUITTONNEAU - Influence of oxidizing and Nitriding parameters on nitrogen concentration of electrical steels - Materials Characterization - Vol. 182, p.111529 - 2021
Materials Characterization
Influence of Oxidizing and Nitriding Parameters on Nitrogen Concentration of Electrical Steels
--Manuscript Draft--
Manuscript Number: MATERIALSCHAR-D-21-01879R1
Article Type: Review article
Keywords: Electrical Steel; oxidizing; Nitriding; DIFFUSION; Phase Transformations
Corresponding Author: Sébastien Jégou
Arts et Metiers Institute of Technology Aix-en-Provence, FRANCE
First Author: Sébastien Jégou
Order of Authors: Sébastien Jégou
Mihaela Teodorescu Laurent Barrallier Fabrice Guittonneau
Abstract: The influence of oxidizing and nitriding parameters on the nitrogen concentration of grain-oriented electrical steels preliminary to the development of the final Goss texture was explored. Results show that the nitrogen enrichment is driven by a ferrite to austenite transformation during thermochemical treatments. Such a transformation is promoted by (i) a redistribution of ferrite-forming elements close to the surface during oxidizing prior to nitriding, (ii) the oxygen content within the oxide layer prior to nitriding, (iii) the temperature of oxidizing and nitriding, and (iv) the nitrogen enrichment during nitriding. Optimization of the nitrogen content, and thus the precipitation kinetics of alloying elements nitrides (e.g. inhibitors) required for the development of the final Goss texture can be controlled by an optimization of the oxide layer growth, the temperatures and gas mixture of nitriding.
Suggested Reviewers: Thierry Czerwiec
[email protected] Philippe Jacquet
[email protected] Luc Pichon
[email protected] Sebastien Dubent
[email protected] Response to Reviewers:
Highlights
The nitrided layer of electrical steels is coincident with the oxide layer The nitrogen content increases with the decrease of the nitriding temperature Oxidizing induces a redistribution of heavy elements (Si, Cr, Mn, Al) The nitrogen enrichment is driven by a ferrite to austenite transformation The austenite transformation is promoted by diffusing Si, O and N Highlights
Influence of Oxidizing and Nitriding Parameters on Nitrogen Concentration of
1
Electrical Steels
2
3
S. Jégou1, M. Teodorescu2, L. Barrallier1, F. Guittonneau1
4 5
1 Arts et Metiers Institute of Technology, MSMP, HESAM Université, F-13617 Aix-en-Provence,
6
France
7
2 thyssenkrupp Electrical Steel UGO, Isbergues, France
8 9
[email protected], [email protected], [email protected],
10
11 12
13
Corresponding author: S.Jégou, [email protected], Arts et Metiers Institute of Technology,
14
MSMP, HESAM Université, F-13617 Aix-en-Provence, France
15 16
17
Abstract
18
The influence of oxidizing and nitriding parameters on the nitrogen concentration of grain-oriented
19
electrical steels preliminary to the development of the final Goss texture was explored. Results show
20
that the nitrogen enrichment is driven by a ferrite to austenite transformation during thermochemical
21
treatments. Such a transformation is promoted by (i) a redistribution of ferrite-forming elements close
22
to the surface during oxidizing prior to nitriding, (ii) the oxygen content within the oxide layer prior to
23
nitriding, (iii) the temperature of oxidizing and nitriding, and (iv) the nitrogen enrichment during
24
nitriding. Optimization of the nitrogen content, and thus the precipitation kinetics of alloying elements
25
nitrides (e.g. inhibitors) required for the development of the final Goss texture can be controlled by an
26
optimization of the oxide layer growth, the temperatures and gas mixture of nitriding.
27 28 29
Keywords
30
Electrical steel, oxidizing, nitriding, diffusion, phase transformations
31
32 33
1. Introduction
34
The evolution of environmental concerns in the last decay has been pushing electrical conversion
35
systems to new developments and challenging optimizations. In case of electrical transformers, a
36
complex process route leads to decrease core lost and increase the magnetic permeability [1-3]. A
37
succession of hot and cold rolling, thermochemical surface and heat treatments have been optimized to
38
manufacture so called “grain-oriented” (GO) electrical steels. The quality of the final crystallographic
39
texture, e.g. Goss texture, directly drives the electrical performances. Goss texture, {110}<001>,
40
develops due to an abnormal grain growth thanks to, at least, the presence of grain-growth inhibitors
41
within the microstructure such as MnS precipitates and alloying elements nitrides MN (M = Si, Al,
42
Manuscript File Click here to view linked References
Cr…) [4-8]. Optimizing such a complex process route appears time consuming, costly and complex,
43
especially because the magnetic properties can only be measured when the entire process route was
44
accomplished.
45
In case of MN inhibitors, three nitriding treatments have been optimized to promote such a
46
precipitation: (i) inherent nitriding from nitrogen available in the materials from casting [5], (ii)
47
equilibrium nitriding from reaction of dinitrogen N2 during the last heat treatment during which the
48
Goss texture develops [10-11] and (iii) non-equilibrium nitriding from reaction of ammonia NH3 in-
49
line after the oxidizing treatment [8-9]. Inherent and equilibrium nitriding do not promote a high
50
enough adsorption of nitrogen by the steel, leading to non-optimized fraction of inhibitors to promote
51
the Goss texture [9]. Development of the non-equilibrium nitriding treatment regarding the magnetic
52
properties has been reached identifying the acceptable range of nitrogen concentration for an efficient
53
abnormal grain growth, the corresponding temperature of nitriding, and the range of ammonia to
54
dihydrogen ratio to use in order to get satisfying precipitation of inhibitors [12-13]. Prior to nitriding,
55
oxidizing aims decarburizing electrical steels as well as the later growth of an insulated layer (glass
56
film) [14-16]. Studies were carried out on the structure of the oxides’ layer and on influence of process
57
parameters on oxides’ layer properties. [17-18]. However, details about the nitriding kinetics, and
58
most of all on the influence of the oxide layer on nitriding kinetics, and thus on the nitrogen
59
enrichment and on control of the precipitation of inhibitors are missing in the literature [19-25].
60
The present work aims to study the influence of oxidizing and nitriding parameters on the nitrogen
61
adsorption and diffusion kinetics right before the development of the final Goss texture.
62 63
2. Experimental
64
2.1. Materials
65
The material is a silicon iron-based alloy used for grain-oriented electrical steel.
66
Samples of 30x30x0.2 mm3 were provided by thyssenkrupp Electrical Steel for investigations.
67
Sensitive analysis of annealing parameters was performed through laboratory trails and experimental
68
measurements. Conditions of oxidizing are chosen to promote both oxidizing and decarburizing in a
69
single step. The dew point (TDP controlled by H2O vapour and a chilled mirror hygrometer) and
70
temperature (TO) of oxidizing prior to nitriding stage were varied from 40 to 70°C and from 840°C to
71
900°C respectively. Samples have then been nitrided in a gas mixture using H2, N2 and NH3, at various
72
temperatures (TN), from 770°C to 930°C. The nitriding potential (defined by the fraction of both NH3
73
and H2) was kept fixed to a usual low value used for electrical steels according to industrial practice
74
because of the complexity to control low nitriding potential in industrial conditions especially at such
75
high temperature (higher than 600 °C). Cases without nitriding were as well considered in order to
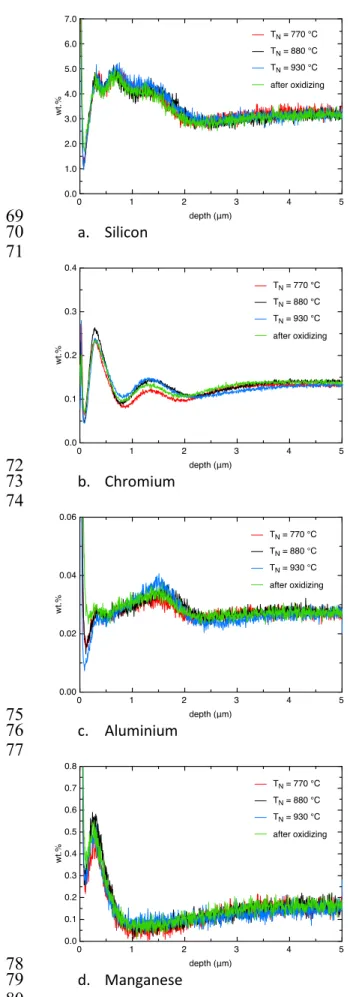
76
dissociate the various parameters influences. The studied GO samples had the following main
77
chemical composition 3.1 wt.% Si, 0.028 wt.%Al, 0.15 wt.% Mn, 0.0095 wt.% N and almost no C, the
78
samples being already decarburised before the experimental measurements.
79
80
2.2. Materials characterization
81
The microstructure was observed by scanning electron microscopy (SEM) using a Jeol JSM-7001F
82
microscope and backscatter electrons mode. Prior to observations, ionic polishing (Ar+ ions, 4 kV)
83
was performed on each transversal cut using a Jeol Cross Section Polisher.
84
Chemical analysis was carried out by glow discharge optical emission spectroscopy (GDOES) using a
85
Profiler 2 device from Horiba. The surface of interest was around 4 mm in diameter parallel to the
86
surface of the sheet. The RF power, gas pressure and time of analysis were set to 35 W, 680 Pa and
87
300 s respectively, that corresponds to a depth of erosion of approximatively 15 µm. Errors on
88
chemical analysis are expected to be less than 10 %, and were less than 2 and 1 % for nitrogen and
89
silicon respectively on a standard.
90
X-ray diffraction phase analyses were performed at room temperature using a Siemens D500
91
diffractometer, an Elphyse linear detector and the chromium Kα radiation. The diffraction angle 2θ
92
was varied from 40 to 140°, that corresponds to a penetration depth of 2 to 6 µm in the ferritic matrix.
93 94
2.3. Thermodynamics calculations
95
Thermodynamics calculations were performed using Thermo-Calc version 2021a, TCFE Steels/Fe-
96
alloys database version 07 and TC-Python [26].
97 98
3. Results
99
100
3.1. Microstructure observation
101
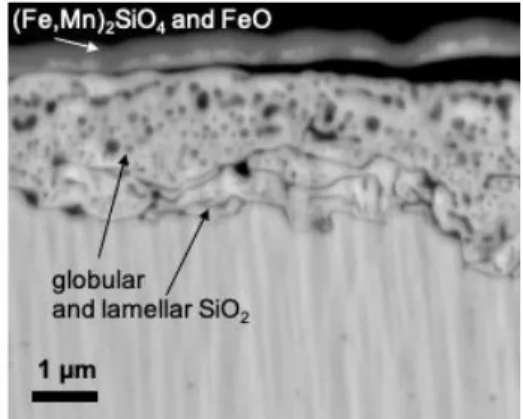
Figure 1 shows an example of the microstructure after oxidizing and nitriding observed by SEM using
102
the backscattered electron mode. The outer surface is characterized by an oxide layer of
103
approximatively 2 µm thickness. The oxide layer is divided in two sublayers, one subscale at the
104
extreme surface of nearly 0.5 µm thickness composed of Fe2SiO4 and FeO oxides and one of
105
approximatively 1.5 µm composed of globular followed by lamellar SiO2 oxides [27]. All the samples
106
present similar type of composition, but their distribution, volume fraction and inner properties could
107
be different depending on the process parameters. The detailed analysis of the oxides’ layer
108
components and their properties is not the main focus of this paper, the related results will be part of
109
another paper.
110 111
3.2. Chemical analysis
112
Oxygen and nitrogen in-depth profiles were obtained from GDOES analysis. Figure 2 gives a
113
comparison of contents prior to thermochemical treatments, after oxidizing, and with and without gas
114
nitriding. The effective depth of oxygen diffusion is approximatively 2.5 µm. The oxygen content is
115
maximum at the extreme surface and then decreases, following an internal oxidation diffusion
116
behaviour, to reach a null concentration at 2.5 µm below the surface in agreement with the SEM
117
observations given on Figure 1 for this particular case. The diffusion of nitrogen atoms tends to make
118
the diffusion process of oxygen atoms to continue during nitriding. The nitrogen content in-depth
119
profile exhibits a non-obvious evolution as a function of the depth. It is maximum at the extreme
120
surface, decreases to a minimum of nearly 0.65 wt.% at a depth of 0.5 µm, increases up to 0.8 wt.% at
121
1.0 µm depth before abruptly decreasing toward the core content (below 0.03 wt.% according to the
122
sensitivity of present GDOES analysis). The effective diffusion depth of nitrogen atoms is in
123
agreements with the one of oxygen. The nitrogen content in the oxide layer highly overestimates the
124
content within the final product that gives a good secondary recrystallization [12].
125
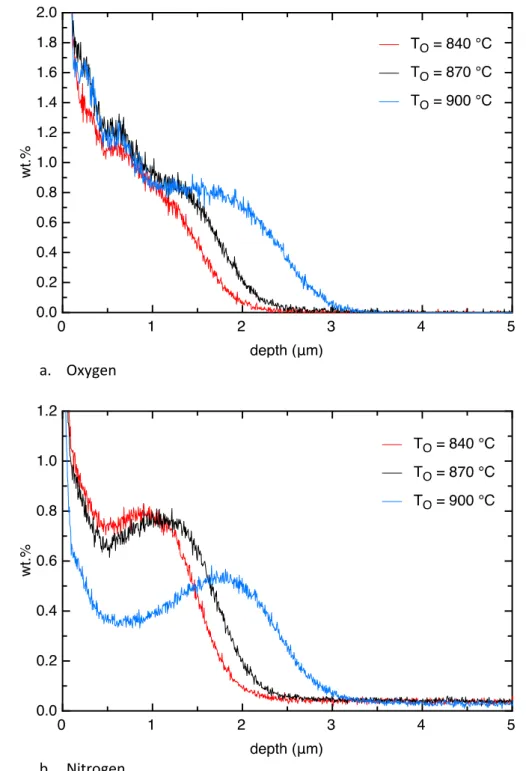
The affected depth by oxygen atoms increases when the dew point (TDP) and oxidizing (TO)
126
temperature increase (Figures 3 and 4). The evolution of the content of oxygen as a function of the
127
depth are all similar, characterized by a maximum fraction close to the extreme surface that decreases
128
to a null content within the core. As previously, nitrogen atoms are largely located through the entire
129
oxide layer. The higher the temperature, the lower and deeper the nitrogen enrichment is, and, the
130
lower and deeper the minimum content of nitrogen is. It reaches 0.45 and 0.35 wt.% at a depth of
131
0.65 µm for a dew point and oxidizing temperatures of 70 and 900 °C respectively (Figure 3.b and
132
4.b). For low dew point (40 °C), no variation of nitrogen content is observed within the oxide layer. In
133
contrast, a significant decrease of the nitrogen enrichment is noted when the oxidizing temperature is
134
increasing from 840 to 900 °C.
135
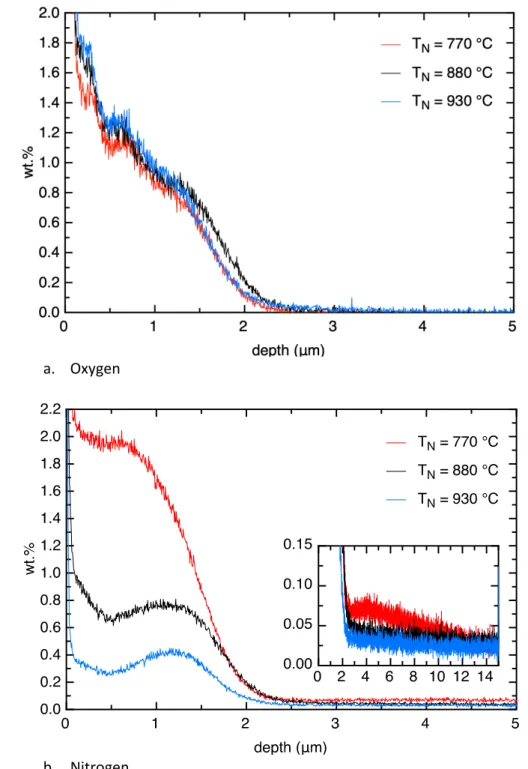
Figure 5 shows the influence of the nitriding temperature (TN) on the case depth. No significant change
136
is observed in case of the oxide layer growth. The evolution of the nitrogen content shows similar
137
profiles for all temperatures with a minimum of the nitrogen fraction at a depth of nearly 0.5 µm
138
below the surface. However, increasing the nitriding temperature involves a significant decrease of the
139
nitrogen enrichment through the oxide layer. The fraction of nitrogen reaches almost 2.0 wt.% at
140
770 °C whereas 0.5 wt.% are barely achieved at 930 °C.
141
By considering the GDOES detection limit of nitrogen atoms (0.03 wt.%), a diffusion zone of nitrogen
142
in α-Fe ferrite below the oxide layer is observed to a depth of 12 µm. All the diffusion zones look
143
similar below the oxide layer with a nitrogen fraction ranging from 0.05 down to 0.03 wt.% except at
144
the low nitriding temperature of 770 °C in case of which the nitrogen fraction ranges from 0.075 down
145
to 0.03 wt.% (Figure 5.b).
146
One objective of oxidizing prior to nitriding is to decarburize the sample in order to achieve a
147
minimum content required to maximize the abnormal secondary recrystallisation. Figure 6 gives
148
examples of the carbon content in-depth profiles. It is observed that the decarburization of the core
149
material is effective (0.04 down to 0.02 wt.%) whereas it induces a non-negligible enrichment of
150
carbon in the oxide layer for all samples. According to the affected depth, such enrichment may be
151
attributed to the presence of (Fe,Mn)2SiO4 and FeO close to the surface in the oxide layer (Figure 1).
152
Despite the GDOES detection limit of carbon (from 0.003 to 0.01 wt.%), these measurements must be
153
considered with precautions because of possible pollution of the surface due to cleaning for instance.
154
More investigations are required to address the carbon enrichment of the oxide layer during oxidizing.
155
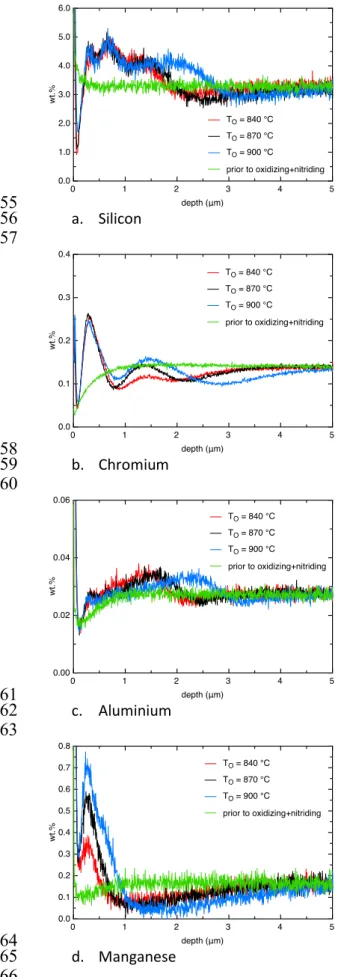
The chemical composition of some alloying elements is given on Figure 7 and 8 as a function of the
156
depth below the surface and the temperatures of oxidizing and nitriding respectively. The same
157
complex tendency as a function of the depth below the surface is observed for all elements. All
158
elements are characterized by a depletion close to the outer surface, an increase of the content
159
followed by a depletion at greater depth. The redistribution of alloying elements is observed at more
160
profound depth when the thickness on the oxide layer increases (Figures 3 and 4). The silicon content
161
is almost constant within the oxide layer and higher than in the core, but some profile variations are
162
noted mostly induced by the change in dew point. Such redistribution of alloying elements through the
163
oxidized surface is at least influenced by the oxidizing treatments (Figure 7) and nitriding does not
164
modify them (Figure 8).
165
Finally, the total nitrogen uptake into the oxide layer can significantly vary by a factor 4 when
166
increasing the nitriding temperature from 770 to 930 °C (Figure 5) whereas no significant change in
167
the redistribution of carbon nor heavy elements is observed (Figures 6 and 8).
168 169
3.3. X-ray diffraction
170
Figure 9 gives the phase analyses carried out at the surface of samples as a function of the nitriding
171
temperature, as well as after decarburizing. Austenite is identified after nitriding but not present prior
172
to nitriding, or in a too low volume fraction or crystallite size. The lower the nitriding temperature, the
173
higher the volume fraction of austenite is. To complement these results, a tempering was performed,
174
subsequent to nitriding, for one minute at the nitriding temperatures tested previously and followed by
175
water quenching. The tempered samples confirm the presence of retained austenite at room
176
temperature after nitriding.
177 178
3.4. Thermodynamic calculations
179
Figure 10 gives the Fe-Si-N-2.0wt.%O isopleth diagrams at 750 and 950 °C and possible phase
180
transformations at a depth of nearly 0.1 µm. Results show that a ferrite to austenite transformation
181
may occur during oxidizing and nitriding. It is due to the depletion of silicon but also to the
182
enrichment of both oxygen and nitrogen. As a consequence, the transformation is expected to be
183
promoted close to the outer surface according to GDOES analysis. Moreover the transformation is
184
thermally activated enabling the presence of austenite for higher Si content and thus deeper within the
185
oxide layer.
186
Figure 11 gives the thermodynamic calculations as a function of the chemical composition of samples
187
after nitriding at three different temperatures as measured by GDOES. Results show that austenite is
188
present in the oxy-nitrided layer as deep as 1.0 µm. At 770 °C, the nitrogen enrichment significantly
189
stabilizes the austenitic phase as compared to without nitriding at the same temperature between 0.2
190
and 1.0 µm in depth (Figure 11.c).
191
The fraction of silicon nitrides within the oxi-nitrided layer increases when the temperature of
192
nitriding decreases and must be related to an increase of the nitrogen uptake.
193
The fraction of oxides does not depend on the nitrogen content and stay nearly unchanged when
194
comparing samples with and without nitriding. In addition, all calculations show that the nature of the
195
silicon oxide may change according to the temperature of both oxidizing and nitriding. Below 850 °C,
196
silicon oxides are quartz like but change to tridymite at higher temperature.
197 198
4. Discussion
199
Chemical characterizations of a GO electrical steel after oxidizing and nitriding show that the kinetics
200
of nitrogen adsorption and diffusion highly depends on the oxide layer growth, on the oxygen and
201
carbon content, on the complex redistribution of heavy elements (such as Si, Cr, Al, Mn), as well as on
202
the temperature of the heat treatments. The nitrogen content in-depth profile exhibits a non-obvious
203
evolution as a function of the depth, with a minimum of nitrogen within the oxide layer.
204
The higher the temperatures of oxidizing and nitriding, the deeper the diffusion of nitrogen and the
205
lower the maximum of nitrogen in the oxide layer are (Figures 4 and 5 respectively). Nitrogen
206
diffusion is characterized, as mentioned, by a minimum fraction of nitrogen within the oxide layer
207
(close to a depth of 0.5 µm), that is even more pronounced when the oxide layer is thick. The nitrogen
208
uptake does not appear depending in first approximation on the fraction and redistribution of elements
209
such as silicon, chromium, aluminium or manganese (Figures 7 and 8). However this observation
210
reflects the fact that, prior to nitriding, a similar redistribution of elements between oxides and matrix
211
is obtained, for the range of the variations of the decarburizing (oxidizing) temperature considered.
212
But any change in the silicon or aluminium redistribution between the matrix and oxides during
213
oxidizing is obviously expected to play a role on the formation of silicon and aluminium nitrides and
214
thus on the level of the nitrogen uptake during nitriding.
215
Chemical analyses revealed that oxidizing leads to a decrease of the carbon content within the core
216
material thanks to the decarburizing atmosphere during oxidizing, but results in a carbon enrichment
217
of the oxide layer prior to nitriding (Figure 6). Heavy elements also exhibit a complex redistribution
218
through the oxide layer prior to nitriding (Figures 7 and 8), consistent with the literature using the
219
same chemical analysis method [27]. These redistributions of already present elements are influenced
220
by the conditions of oxidizing and not affected by those of nitriding.
221
Thermodynamic calculations of temperature isopleths for given oxygen content or using compositions
222
as measured by GDOES show that a ferrite to austenite transformation may occur within the oxide
223
layer during nitriding (Figure 10). The higher the oxygen content and temperature, the lower the
224
transformation point from ferrite to austenite is during nitriding. The ferrite to austenite transformation
225
is as a consequence promoted close to the surface in the oxide layer. Although the carbon fraction
226
measurement may need optimization for GDOES analysis, the presence of carbon content within the
227
oxide layer can promote such an austenitic transformation. Calculations confirm the present
228
experimental observations of retained austenite by XRD at the surface of samples (Figure 9).
229
Austenite was also observed experimentally at the extreme surface of the oxide layer in other recent
230
works [16, 25]. The fraction of austenite increases in agreement with the nitrogen content according to
231
GDOES analysis and the Fe-N phase diagram [28]. Iron nitrides being more thermodynamically stable
232
than austenite at room temperature [28], tempering after nitriding must promote the decomposition of
233
austenite into ferrite and iron nitrides. It thus leads to no observation of austenite at room temperature
234
by XRD. However iron nitrides were not observed by XRD that suggests a low fraction of iron
235
nitrides or too small crystallites. More investigations are required.
236
The observation of a minimum of the nitrogen fraction in the oxide layer close to 0.5 µm below the
237
surface is in agreement with the transformation zone from ferrite to austenite according to
238
thermodynamic calculations (Figure 11).
239
The thermodynamic calculations let us assume that the austenitic transformation can be in competition
240
with the precipitation of silicon nitrides, and so, even more when the transformation point is low
241
(Figure 10). Although the nitrogen solubility limit in austenite is much higher than in ferrite, the
242
precipitation kinetics of alloying elements as nitrides, and so the nitrogen uptake, may be assumed
243
slower if the austenitic transformation occurs before the complete precipitation of nitrides. Moreover,
244
it has to be considered that the diffusion kinetics of nitrogen atoms in austenite is at least one hundred
245
times lower than in a ferritic matrix [29]. It thus leads to a decrease of the flow of nitrogen atoms at
246
the beginning of the oxide layer whereas the diffusion kinetics are much faster in the ferritic area at
247
greater depth.
248
As a consequence, the calculated gradient of austenite close to the surface is expected to result in a
249
depletion of nitrogen between the low diffusion kinetic area near the surface and the fast diffusion
250
kinetics area (ferrite zone) deeper in the oxide layer. The nitrogen enrichment being slower due to the
251
austenitic transformation prior to the complete precipitation of silicon nitrides at the surface, the
252
boundary conditions for diffusion in the ferritic zone deeper in the material must also change towards
253
lower value. Therefore, it induces a lower level of nitrogen in ferrite and a slower precipitation
254
kinetics of alloying elements as nitrides deeper in the oxide layer.
255
According to thermodynamic calculations and the higher chemical affinity of both silicon and
256
aluminium with oxygen than nitrogen [30], the oxides already present before nitriding are supposed
257
not to take part in the precipitation of silicon and aluminium nitrides.
258
Calculations show that the nature of silicon oxides could also change during nitriding function of the
259
content of both oxygen and silicon, but also depending on the temperature of oxidizing and nitriding.
260
Similarly, the nature and fraction of iron-silicon oxide at the outer surface (e.g. (Fe,Mn)2SiO4 and/or
261
FeO) may play a role on the catalytic dissociation of ammonia and the nitrogen adsorption and uptake.
262
However present experimental results cannot conclude on any effect of such change of oxides on the
263
diffusion kinetics of nitrogen atoms during nitriding.
264
Finally, it is well known that the natural dissociation rate of ammonia NH3 into N2 and H2 gas mixture
265
increases exponentially with the temperature [31]. As a result, and considering perfect gas transfer to
266
the solid surface, the nitrogen fraction at the gas-solid interface available for adsorption into the solid
267
from the catalytic dissociation of ammonia at the solid surface naturally decreases and thus the
268
nitrogen enrichment within the oxide layer. Moreover, at the atmospheric pressure, the dissociation
269
rate of dinitrogen molecules N2 during nitriding cannot compensate the lack of nitrogen atoms from
270
the catalytic ammonia dissociation at the solid surface without increasing the pressure [31-33].
271 272
5. Conclusion
273
Influences of the conditions of oxidizing and nitriding on the nitrogen enrichment prior to the
274
development of the final Goss texture were explored in case of a grain-oriented electrical steel. The
275
nitrogen enrichment in the oxide layer can significantly overestimate the nitrogen content required for
276
the development of the final Goss texture. The nitrogen atoms are exclusively located within the about
277
2.5 µm thick oxide layer after nitriding. The nitrogen diffusion kinetics through the oxide layer
278
depends on a ferrite to austenite transformation during oxidizing and nitriding. The transformation
279
point decreases with (i) the increase of the fraction of oxygen, carbon and nitrogen atoms, (ii) the
280
depletion of heavy elements very close to the outer surface and (iii) the temperature increase.
281
The nitrogen content, that leads to the optimized precipitation of inhibitors required for the
282
development of the final Goss texture and the optimum magnetic properties, is driven by the oxidizing
283
and nitriding conditions that must be involving a ferrite to austenite transformation if not controlled.
284
The nitrogen enrichment, and thus the development of inhibitors, can obviously be optimized and
285
controlled depending on the conditions of oxidizing and nitriding. It arises that optimize the nitriding
286
potential through the gas mixture (NH3-N2-H2) could also be necessary in order to get the most
287
efficient thermochemical treatments conditions of electrical steels.
288 289 290
Data availability
291
The raw/processed data required to reproduce these findings cannot be shared at this time as 292
the data also forms part of an ongoing study 293
294 295
References
296
[1] Littmann M.F., Iron and Silicon-Iron Alloy, IEEE Transactions on Magnetics MAG-7(1) (1971)
297
48-69
298
[2] Taguchi S., Sakakura A., Matsumoto F., Takashima K., Kuroki K., The development of grain-
299
oriented silicon steel with high permeability, Journal of Magnetism and Magnetic Materials 2 (1976)
300
121-131
301
[3] Ushigami Y., Masui H., Okazaki Y., Suga Y., Takahashi N., Development of low-loss grain-
302
oriented silicon steel, Journal of Materials Engineering and Performance 5(3) (1996) 310-315
303
[4] Markuszewicz M., Groyecki J., Lassota J., Zawada A., Stability of inclusions and the formation
304
of secondary grains in silicon-iron alloys, Transactions of the Metallurgical Society of AIME 236
305
(1966) 196-200
306
[5] Fiedler H., A comparison of the use of aluminum and vanadium nitrides for making grain-
307
oriented silicon-iron, Journal of Applied Physics 38(3) (1967) 1098-1099
308
[6] Matsuoka T., Effect of impurities on the development of (110)[001] secondary recrystallization
309
texture in 3% silicon iron, Transactions ISIJ 7 (1967) 19-28
310
[7] Grenoble H.E., The role of solutes in the secondary recrystallization of silicon iron, IEEE
311
Transactions on Magnetics MAG-13(5) (1977) 1427-1432
312
[8] Ushigami Y., Nakayama T., Suga Y., Takahashi N., Influence of inhibitor intensity on
313
secondary recrystallization in Fe-3%Si alloy, Materials Science Forum 204-206 (1996) 599-604
314
[9] Takahashi N., Harase J., Recent development of technology of grain oriented silicon steel,
315
Materials Science Forum 204-206 (1996) 143-154
316
[10] Suga Y., Matsumoto F., Nakayama T., Japanese Patent, Application No.S57-165066 (1982)
317
[11] Konno T., Suga Y., Nakamura M., Komatsu H., Japanese Patent, Application No.S59-215827
318
(1984)
319
[12] Kobayashi H., Kuroki K., Minakuchi M., Yakashiro K., United States Patent 4,979,996 (1990)
320
[13] Ushigami Y., Nakayama T., Suga Y., Takahashi N., Influence of secondary recrystallization
321
temperature on secondary recrystallization texture in Fe-3%Si alloy, Materials Science Forum 204-
322
206 (1996) 605-610
323
[14] Yamazaki T., On the decarburization of silicon steel sheet, Transactions ISIJ 9 (1969) 66-75
324
[15] Block W.F., Jayaraman N., Reactions during decarburization annealing of electrical steel,
325
Materials Science and Technology 2 (1986) 22-27
326
[16] Wu X-l., Li X., Yang P., Jia Zh-w., Zhang H-l., Analysis of oxide layer structure in nitrided
327
grain-oriented silicone steel, International Journal of Minerals, Metallurgy and Materials, 26(12)
328
(2019) 1531-1538
329
[17] Lyudkovsky G., Preban A.G., Shapiro J.M., The influence of annealing conditions on the
330
internal oxidation and magnetic properties of silicon-aluminium bearing electrical steels, Journal of
331
Applied Physics 53(3) (1982) 2419-2421
332
[18] Cesar M.G.M.M., Mantel M.J., Effect of the temperature and dew point of the decarburization
333
process on the oxide subscale of a 3% silicon steel, Journal of Magnetism and Magnetic Materials
334
254-255 (2003) 337-339
335
[19] Kumano T., Haratani T., Fujii N., Effect of nitriding on grain-oriented steel bearing
336
aluminium, ISIJ International 45(1) (2005) 95-100
337
[20] Kumano T., Ohata Y., Fujii N., Ushigami Y., Takeshita T., Effect of nitriding on grain-
338
oriented steel bearing aluminium (the second study), Journal of Magnetism and Magnetic Materials
339
304 (2006) e602-e607
340
[21] Liao Ch-Ch., Hou Ch-K., Effect of nitriding time on secondary recrystallization behaviors and
341
magnetic properties of grain-oriented electrical steel, Journal of Magnetism Materials 322 (2010) 434-
342
343
442[22] Zeng G., Luo H., Li J., Gong J., Li X., Wang X., Experimental studies and numerical
344
simulation on the nitriding process of grain-oriented silicon steel, Acta Metallurgica Sinica 53(6)
345
(2017) 743-750
346
[23] Wen P., Luo H., Zeng G., Li J., Huang J., Yan B., In-situ measurement and numerical
347
simulation of nitriding kinetics of grain-oriented silicon steel, International Journal of Hydrogen
348
Energy 42 (2017) 10901-10910
349
[24] Vilela T.J.S., Faria Fonseca A.J., Costa Paolinelli S., Barros Cota A., Simultaneous
350
decarburizing and nitriding : effects on structure and magnetic properties of 3% Si grain-oriented
351
electrical steel, REM, International Engineering Journal 71(4) (2018) 599-604
352
[25] Guo Q., Li X., Gong P., Nutter J., Rainforth W.M., Luo H., Why does nitriding of grain-
353
oriented silicon steel become slower at higher temperature? Steel Research International (2021)
354
2000545
355
[26] Andersson J.O., Helander T., Höglund L., Shi P.F., and Sundman B., Thermo-Calc and
356
DICTRA, Computational tools for materials science, Calphad, 26 (2002) 273-312
357
[27] Sehoon Jung, Min Serk Kwon, Seung Bin Kim, Kwang Soo Shin, Characterization of
358
chemical information and morphology for in-depth oxide layers in decarburized electrical steel with
359
glow discharge sputtering, Surf. Interface Anal. 45 (2013) 1119-1128
360
[28] Wriedt H.A., Gokcen N.A., Nafziger R.H., The Fe-N (Iron-Nitrogen) System, Bulletin of
361
Alloy Phase Diagrams 8(4) (1987) 355-377
362
[29] Fast J.D., Verrijp M.B., Diffusion of nitrogen in iron, Journal of the Iron and Steel Institute
363
176 (1954) 24-27
364
[30] P.J. Linstrom and W.G. Mallard, Eds., NIST Chemistry WebBook, NIST Standard Reference
365
Database Number 69, National Institute of Standards and Technology, Gaithersburg MD, 20899,
366
https://doi.org/10.18434/T4D303
367
[31] Schulz G., Schaefer H., Untersuchung der Bildungsgleichgewichte des Ammoniaks und
368
Trideuteroammoniaks, Berichte der Bunsengesellschaft für physikalische Chemie 70(1) (1966) 21-27
369
[32] Grabke H.J., Reaktionen von Ammoniak, Stickstoff und Wasserstoff an der Oberfläche von
370
Eisen I. Zur Kinetik der Nitrierung von Eisen mit NH3‐ H2‐ Gemischen und der Denitrierung,
371
Berichte der Bunsengesellschaft für physikalische Chemie 72(4) (1968) 533-541
372
[33] Grabke H.J., Reaktion von Ammoniak, Stickstoff und Wasserstoff an der Oberfläche von
373
Eisen II. Zur Kinetik der Nitrierung von Eisen mit N2 und der Desorption von N2, Berichte der
374
Bunsengesellschaft für physikalische Chemie 72(4) (1968) 541-548
375
376
377
1 2
Figure 1: SEM micrography in backscattered mode of a GO electrical steel after oxidizing (TDP = 60 3
°C, TO = 870 °C) and nitriding (TN = 880 °C).
4 5 6 7
Figure Click here to access/download;Figure;Article_v09_Figures.docx
8 a. Oxygen 10 9
11 b. Nitrogen 12
13
Figure 2: GDOES chemical analyses of GO electrical steel prior to oxidizing and nitriding, after 14
oxidizing, and with and without gas nitriding. (a) oxygen and (b) nitrogen in-depth content profiles.
15 16 17
18 a. Oxygen 19
20
21
b. Nitrogen 22
23
Figure 3: GDOES chemical analyses of GO electrical steel. Influence of the dew point (TDP) of 24
oxidizing on (a) oxygen and (b) nitrogen in-depth content profiles.
25 26 27
28 a. Oxygen 29 30
31 b. Nitrogen 32
33
Figure 4: GDOES chemical analyses of GO electrical steel. Influence of the oxidizing temperature 34
(TO) on (a) oxygen and (b) nitrogen in-depth content profiles.
35 36 37
38 a. Oxygen 39
40
41 b. Nitrogen 42
43
Figure 5: GDOES chemical analyses of GO electrical steel. Influence of the nitriding temperature (TN) 44
on (a) oxygen and (b) nitrogen in-depth content profiles.
45 46 47
48 49
Figure 6: Carbon in-depth profiles from GDOES chemical analyses of GO electrical steel. Comparison 50
of the carbon content at different steps of thermochemical treatments and influence of the temperature 51
of oxidizing (TO) and nitriding (TN).
52 53 54
55 a. Silicon 56
57
58 b. Chromium 59 60
61 c. Aluminium 62
63
64
d. Manganese 65
66
Figure 7: GDOES chemical analyses of GO electrical steel. Influence of the oxidizing temperature 67
(TO) on (a) silicon, (b) chromium, (c) aluminium and (d) manganese in-depth content profiles.
68
69 a. Silicon 70 71
72
b. Chromium 73
74
75
c. Aluminium 76
77
78 d. Manganese 79
80
Figure 8: GDOES chemical analyses of GO electrical steel. Influence of the nitriding temperature (TN) 81
on (a) silicon, (b) chromium, (c) aluminium and (d) manganese in-depth content profiles.
82
83 a. After nitriding 84 85
86
b. Tempering after nitriding 87
88
Figure 9: XRD phase analyses of GO electrical steel. Influence of the (a) nitriding temperature (TN) 89
and (b) tempering after nitriding.
90 91 92
93 a.
94 95
96 b.
97 98
Figure 10: Isopleth diagrams of Fe-Si-N-2.0wt.%O at 750 and 950 °C. (a) phase fields given for 750 99
°C. (b) phase fields given for 950 °C.
100 101 102
103 a. 770 °C 104 105
106 b. 880 °C 107 108
109 c. 930 °C 110
111
Figure 11: Calculations of the phase fractions as a function of the nitrogen content in an electrical steel 112
according to GDOES analysis of the nitrided sample at (a) 770, (b) 880 and (c) 900 °C.
113 114 115