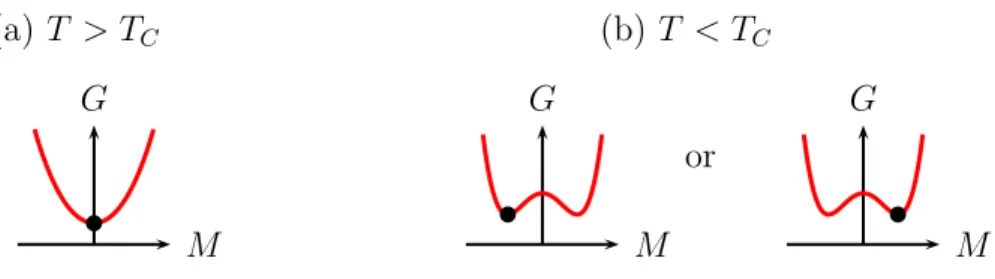
Landau assumed that the steady state is obtained by minimizing the potential with respect to the order parameter. In the case of a magnet, the form of the thermodynamic potential G is illustrated in fig.
Hill Plot of Uranium Compounds
Magnetism and superconductivity
Heavy Fermions
High temperature regime, single impurity behavior
Low temperature regime, Kondo lattice
Plan of this Thesis
- Material Preparation
- Crystal Growth in a Tetra-Arc Furnace
- High Temperature Annealing
- X-ray Laue Photograph
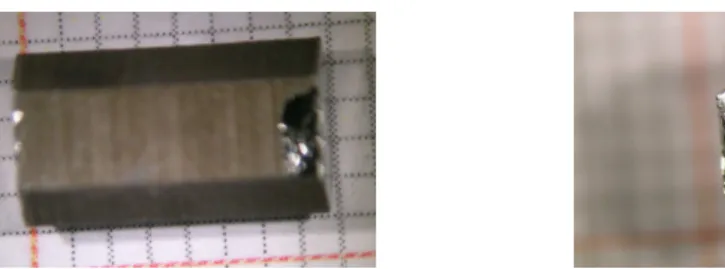
- Electro-Erosion Cutting
- Sample Polishing
For the first time, a magnetic field enhancement of superconductivity is observed with a bulk probe. 2.8, an example of a copy of the laboratory book for a UGe2#A3 crystal is shown.
Low Temperatures
The end of the capillary, which is a cold spot, is in contact with the chamber containing the exchange gas and the sample. The part in the neutron beam is made of aluminum, which in most cases is transparent to neutrons.
High Pressure
Piston Cylinder Cell
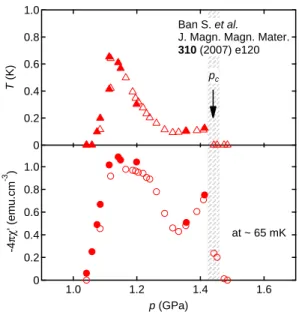
To avoid the effect of a small residual field, a small thermometer calibration error, or drift due to the definition of Tsc, the pressure is determined by comparing with the value at ambient pressure and using the pressure variation given in [ Bireckoven88 ]. No significant transition broadening is observed, indicating that the pressure gradient is less than 0.04 GPa.
![Figure 2.12: Piston cylinder cell used for thermal expansion on UGe 2 [Taufour11, Hardy09]](https://thumb-eu.123doks.com/thumbv2/1bibliocom/463426.69192/30.892.205.712.139.690/figure-piston-cylinder-cell-thermal-expansion-taufour11-hardy09.webp)
Diamond Anvil Cell
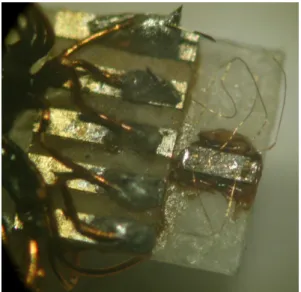
An attempt was made to set up another cell to measure AC sensitivity (see Figure 2.16), but the wires were grounded after the compressive load. In addition to the ruby, a small piece of tin (Sn) was used to determine the pressure.
AC Calorimetry under Pressure
Principle
The model must take into account the characteristic time of internal diffusion in the sample τint and the thermal conductivity of the sample κs [Sullivan68]. The sample with a specific heat C is coupled to a thermal bath at temperature TB through a thermal leak of conductivity KB.
Comparison with the Experiment
The anomaly at the superconducting transition can be observed at different frequencies of the excitation (see fig. 2.26). However, the increase of the frequency gives rise to the problem of internal thermalization in the sample.
Thermal Expansion under Pressure via Strain Gauges
Main Results Obtained with the New Crystals
URu 2 Si 2
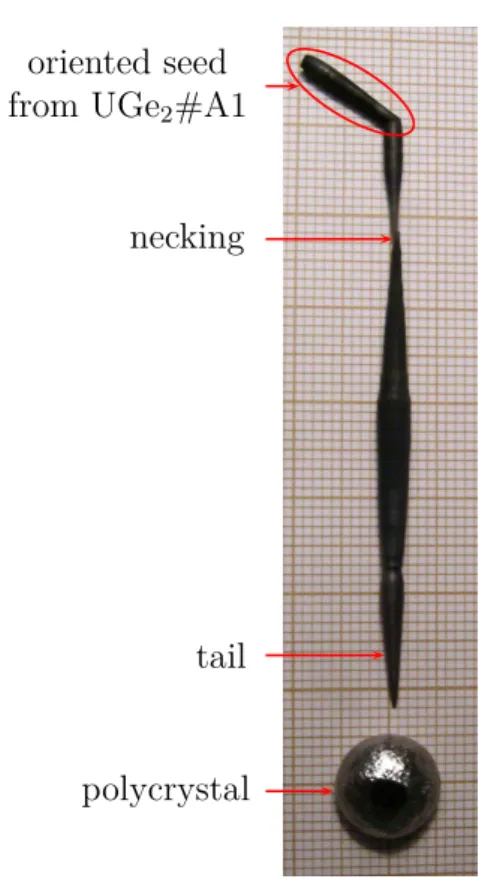
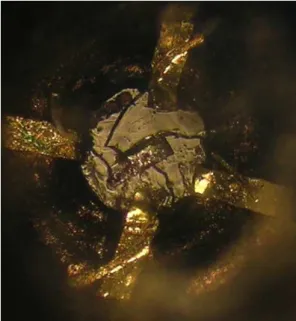
The experiment required growth of the crystals along the c-axis using an oriented seed (see Figure 2.32). While drawing the single crystal, the rod accidentally fell and melted again, but the arc discharges stopped almost immediately, leaving pieces of single crystals behind (see Fig. 2.38). Both resistivity and specific heat measurements show that the temperature T0 of the transition to the hidden order state is reduced from 17.5 K in the pure system to 16.7 K in a 9% Doped sample.
UCoGe
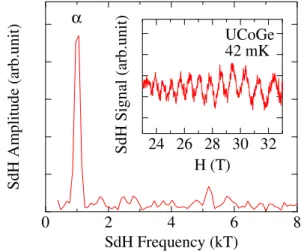
With a precise tuning of the magnetic field alignment, a much stronger anisotropy is observed (see fig. 2.45) [Aoki09b]. Another result arises from the high quality of the crystals: the first observation of quantum oscillations in UCoGe (see fig. 2.46). The main consequence of the misassignment of the crystal structure is that about 15 publications on the magnetic and electrical properties of UGe2 refer to the a axis instead of the cax and vice versa.
Anisotropic Ferromagnet
Itinerant Ferromagnet
In this section, the evidence for some delocalization of the f electrons at low temperature is reviewed. 9A comparison of the results of the Stoner model and the spin-fluctuation model can be found in [Mohn02], chapter 18. He found that for dU−U <3.4 Å, the ground state is paramagnetic which is interpreted by the overlap of the 5f orbitals.
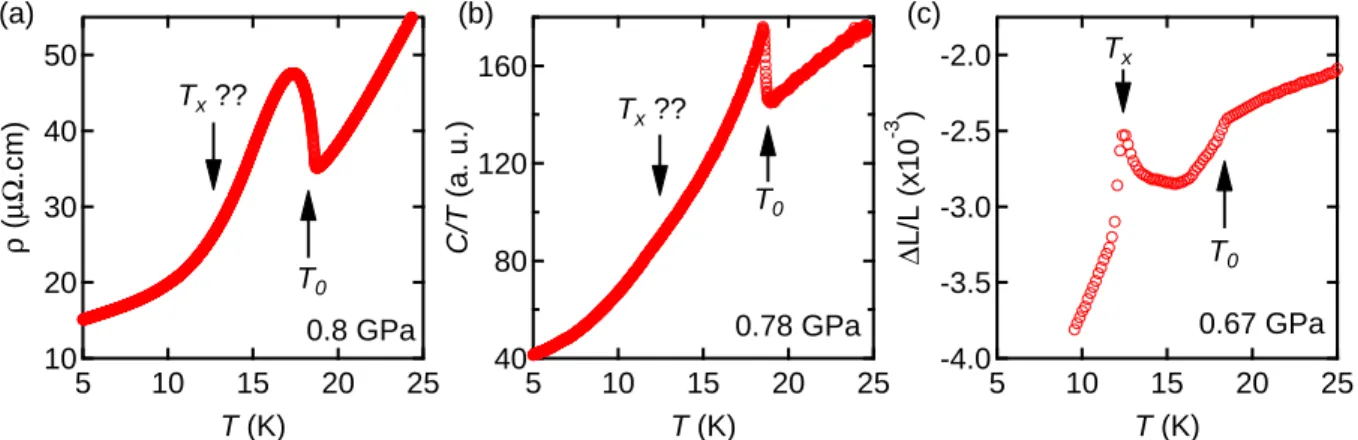
The T x Anomaly at Ambient Pressure
The p-T Phase Diagram
Measurements of the magnetization under pressure identified the Tx anomaly as a transition from a small torque phase FM1 to a large torque phase FM2. After 2002, adjustments have been made to the p-T superconducting phase diagram, which will be presented later. Measurements of magnetization under pressure showed that the ground state below the critical pressure px is a ferromagnetic phase with a magnetic moment of 1.5 µB/U.
Metamagnetism Between p x and p c
Different Scenarios for the T x Anomaly
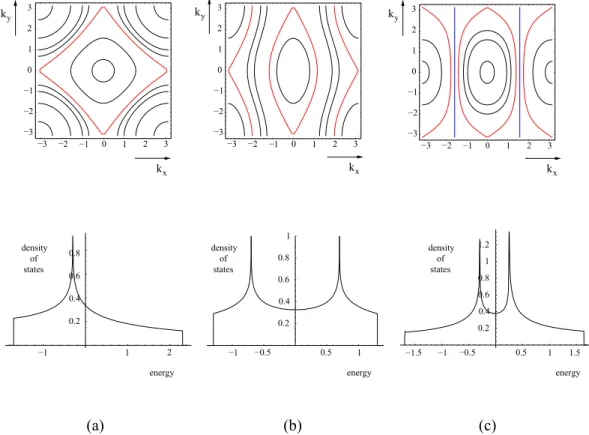
Another idea is that these two magnetic phases are related to singularities in the density of states [Sandeman03]. It has been shown that the low dimensionality of the band structure necessarily induces two peaks in the density of states (see fig. 3.12) [Sandeman02]. Such a sharp double point in the density of states near the Fermi energy EF can induce a first-order Stoner-type phase transition in the spin magnetization (see fig. 3.13).
First Order Transition at p c
Metamagnetism above p c
Fermi Surface Studies under Pressure
These phases can be observed at high pressure because they are induced by the magnetic field along an axis. These phases can be observed at high pressure because they are induced by the magnetic field along an axis.
![Figure 3.15: Pressure dependence of (a) the dHvA frequency and (b) the cyclotron mass detected for field along b axis [Settai02]](https://thumb-eu.123doks.com/thumbv2/1bibliocom/463426.69192/58.892.123.412.154.561/figure-pressure-dependence-frequency-cyclotron-detected-field-settai02.webp)
The Superconducting Phase
Bulk Superconductivity
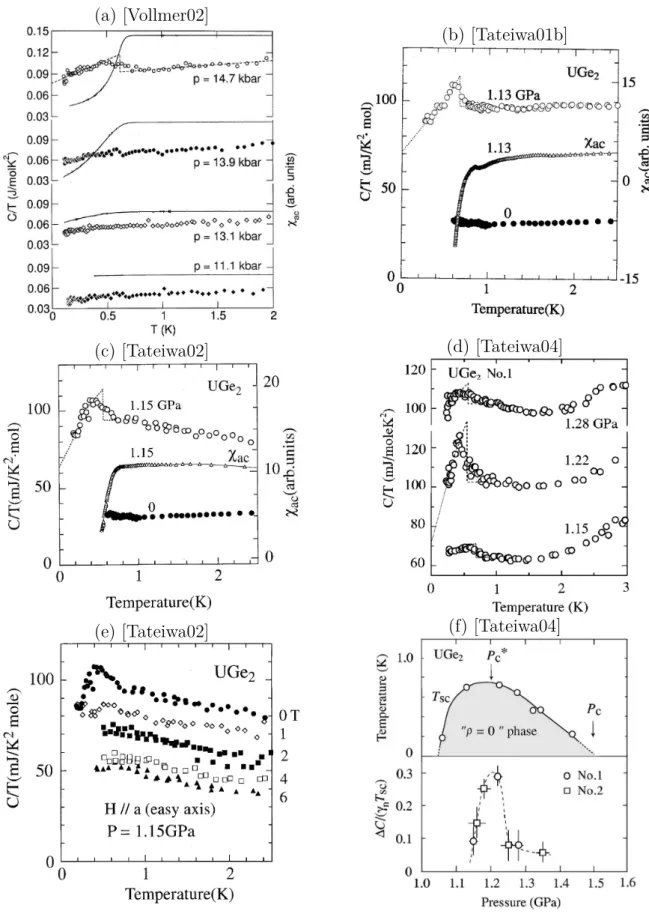
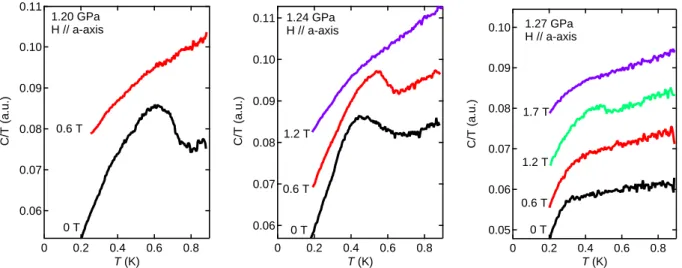
The temperature dependence of C/T is plotted at different pressures and in (a) to (d), and at different magnetic fields applied along the a-axis at 1.15 GPa in (e).
Evidence for the Coexistence of Ferromagnetism and Superconduc-
Non-BCS Superconductivity
Such a property can be described in a strong coupling scenario with high values of the coupling parameter λ. A simplified model of the coupling spectrum [Bulaevskii88], which neglects the gap anisotropy, can fit the experimental data for Hcc2 only if the Pauli limit20 is excluded from the calculation [Sheikin01]. Such an absence of the Pauli limit in UGe2 is consistent with certain spin triplet states.
Influence of the FM1-FM2 Transition
To date, the strongest evidence supporting p-wave superconductivity comes from studies of the upper critical field Hc2 [Sheikin01]. In a magnetic field acting along the easy axis of magnetization, the a-axis, reversible behavior is observed in Hca2. This suggests that the large increase in quasiparticle mass is associated with superconductivity, as observed in many heavy fermionic compounds.
No Superconductivity in the Paramagnetic Phase ?
Several theories have been proposed to explain a first-order PM-FM transition, including magnetoelastic coupling, effects of excitations on the Fermi surface, specific shape of the density of states, and singularities of the Fermi surface. Theories dealing with the magnetoelastic coupling or with excitations at the Fermi surface seem more general than those that consider special features of the density of states or the Fermi surface. However, the general behavior of the change from the second to the first order of the PM-FM transition is accompanied by a wide variety of fascinating phenomena.
Direct Consequence of a First Order Transition
In CoS2, the Curie temperature can be tuned from 122 K to 0 K by doping Se and the PM-FM transition becomes first order in Co(S1−xSex)2 [Goto97]. Thus, it is clear that the metamagnetism observed above pTCP arises from the first-order nature of the PM-FM transition. The evolution of the CEP temperature with pressure and magnetic field can be predicted from various theories of the first-order PM-FM transition.
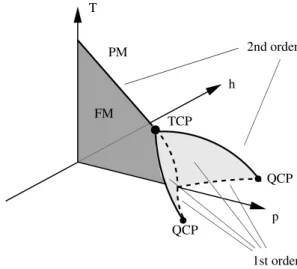
Motivations
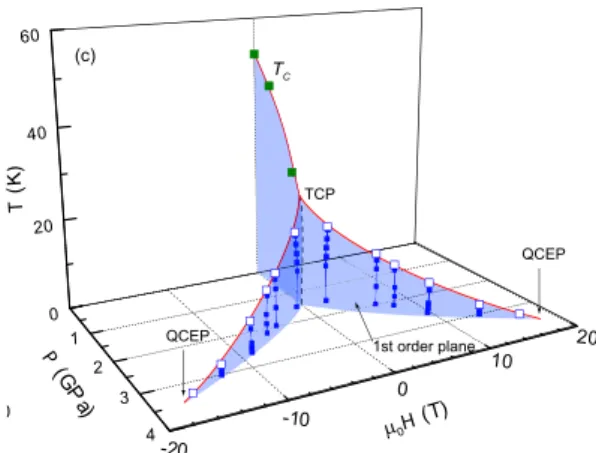
The point where the transition changes from second order to first order is called a tricritical point (TCP). A consequence of the change of order at TCP is that the first-order PM-FM transition at low temperature is field-induced over pTCP if the magnetic field is applied along the easy magnetization axis. At higher temperature, the field-induced first-order PM-FM transition terminates at a critical endpoint (CEP), above which a crossover regime is observed.
Two Ways to Determine the Wing Structure Phase Diagram
Pink lines represent several experimental paths, temperature sweeps or field sweeps, to determine the wing boundary position (red line). This is why it was first discovered using temperature sweeps and is presented in the following section 4.1.4.
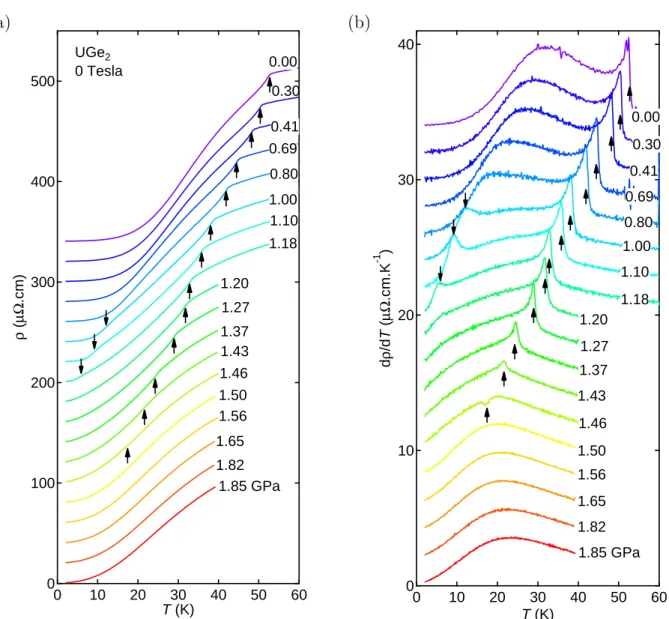
Results of the Resistivity Measurements by Temperature Sweep
ForH > HCP,dρ/dT decreases smoothly with magnetic field, as a crossover of the PM-FM1 transition. Lines are continuous in the case of the first-order transition and dashed in the case of the crossover. 4.5(d) and 4.6, where solid lines show the evolution of the negative anomalies (minimum) and dashed lines follow the positive ones (peak).
Results of the Hall Effect Measurements by Field Sweep
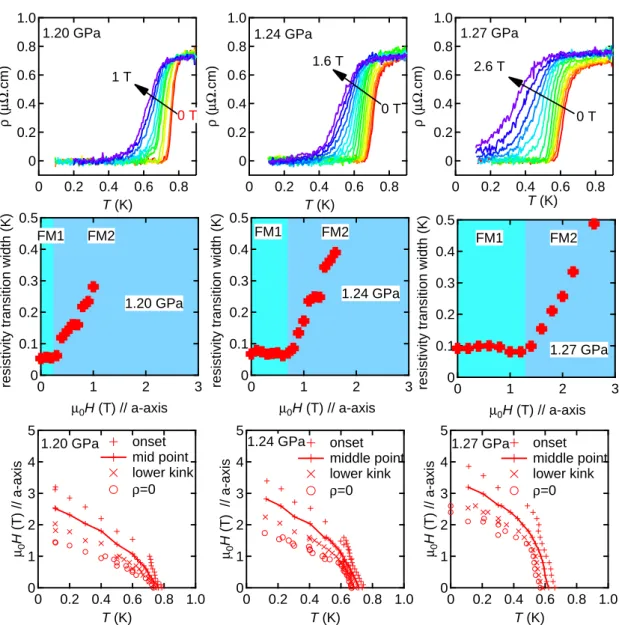
The separation at TC between the two regimes is therefore the critical endpoint (CEP) of the first-order transition. These results present the first determination of the phase diagram of the wing structure of the TCP to the immediate vicinity of the QCEP. The width of the transition, determined by the intersection of linear guidelines, as illustrated in (b), is plotted as a function of temperature in (d).
Critical Behavior on Approaching the QCEP
The temperature dependence of the resistance differs in the 3 phases: paramagnetic (PM), FM1 and FM2. For example in UCoAl, the γ-term of the specific heat decreases at the PM-FM transition [Matsuda00]. As suggested from Hall resistance measurements, as the QCEP approaches, the step jump of the A coefficient at the PM-FM transition changes to a peak (see fig.
Theories
More recently, changes in the topology of the Fermi surface from Lifshitz transitions have been considered. Lifshitz transitions correspond to the collapse of a neck of the Fermi surface or the emergence/disappearance of a Fermi pocket. Instead of the expected QCEP, a marginal quantum critical point (MQCP) will exist, from which a quantum critical line (QCL) will appear, replacing the.
Other Systems and Future Studies
TCP represents the tricritical point, where the critical line ends at B = 0 and the transition becomes first order at B = 0 below the tricritical temperature. The dashed lines were considered a crossover based on the picture of the QCEP [Yamaji07]. Thermopower measurements can test this theory, as a jump of the thermoelectric power is expected at a Lifshitz transition [Vaks81].
The Critical End Point of the FM1-FM2 Transition
- Motivations
- Results at H=0 : First Order Nature of the FM1-FM2 Transition,
- Comparison with the Results at Ambient Pressure
- Evolution of T CEP in Magnetic Field : the FM1-FM2 Wings
- Comparison with the PM-FM1 Wings
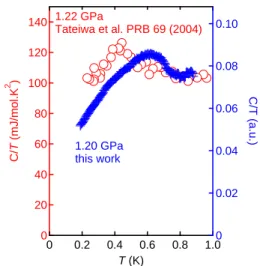
In section 3.11.1, it has been presented that the main part of the superconductivity has been reported by two specific heat measurements [Tateiwa04, Vollmer02]. New AC calorimetry measurements to confirm the bulk of the superconductivity in the FM2 phase are still needed. Finally, it has been presented in section 3.11.4 that resistivity measurements in the FM1 phase with magnetic field applied along the a-axis reveal a re-entry of the superconductivity [Sheikin01, Huxley01].
Determination of Tsc and of the Transition Width in the Specific Heat
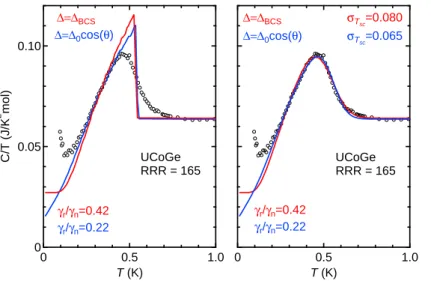
It has also been explained taking into account a higher Tsc in the FM2 than in the FM1 phase[Huxley03b]. However, these measurements will be complicated by the large nuclear contribution in the specific heat. It can be seen that the downward curvature in the weak coupling case develops into an upward curvature.
Broad Resistive Transition in the FM2 Phase
From Resistivity Measurements
In the case of UGe2 it is an increase in magnetic moment without any reorientation. In all three cases an increase in the effective mass at the reorientation field HR is observed (see Fig. 5.21 [Hardy11]). After the experimental results on UCoGe (see section 2.6.2), the influence of the magnetic field on the pair interaction was taken into account [Mineev11a].
Tesla below p x
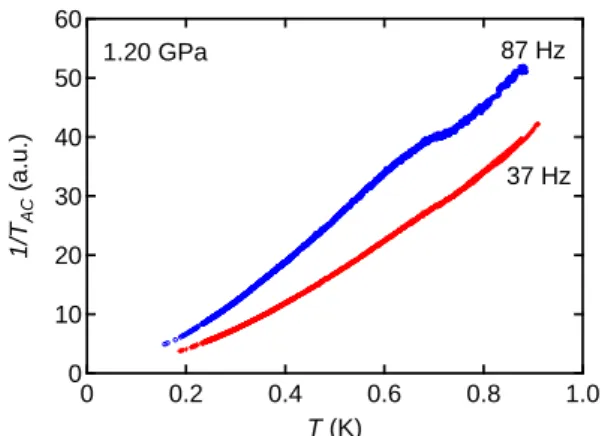
From AC Calorimetry Measurements
Since both curves are qualitatively the same, it appears that the small value of the specific heat jump does not arise from the AC calorimetry technique. 5.10(a), the superconducting specific heat anomaly is rapidly suppressed under a magnetic field of 1.20 GPa. We note that the superconducting transition cannot be detected in our AC calorimetry measurement once the distribution of Tsc exceeds 150 mK.
Discussion
One can conclude that the superconducting transition observed in the FM2 phase is due to impurity phases of FM1. In the first case, the transition will remain broad, but will be observed in a smaller pressure range in the FM2 phase. This may arise due to non-mass superconductivity or due to the fact that Tsc is strongly pressure dependent in the FM2 phase.
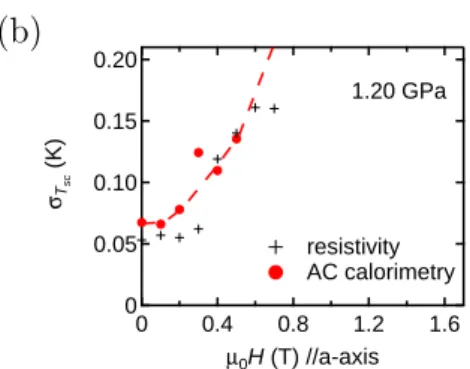
Bulk Evidence for a Field Enhanced Superconductivity
- Magnetic Field Dependence
- Discussion
So far, a shift of the Fermi surface to HR has not been reported in URhGe and UCoGe (no measurements reported). However, it can be roughly estimated from the ratio of the internal fieldHint over the critical field Hc2. Furthermore, we have been able to follow the evolution of the TCP under an applied magnetic field H parallel to the magnetization axis.
![Figure 1.2: Hill plot for uranium compounds. Modified from [Hill70] and [Aoki00].](https://thumb-eu.123doks.com/thumbv2/1bibliocom/463426.69192/14.892.131.762.551.954/figure-hill-plot-uranium-compounds-modified-hill70-aoki00.webp)