Characterization and development of dissolved organic matter in acidic forest soils and its influence on the mobility of major and trace species. Biotic and abiotic factors that regulate the chemical composition of colloidal and dissolved fractions in soil solutions and their mobility.
Identification des mécanismes de fractionnement isotopique du Ca dans les solutions d'un sol forestier: apport des ultrafiltrations et du
Site de prélèvement et échantillonnage 165 3. Méthodes de filtration et d’analyses 166
Identification des mécanismes de fractionnement isotopique du Ca dans les solutions de sols forestiers : apport de l'ultrafiltration et.
Impact of bacterial activity on Sr and Ca isotopic compositions
87Sr/86Sr and δ44/40Ca) in soil solutions (the Strengbach CZO) 201
Introduction Générale
L’un d’eux est lié à la composition de la fraction colloïdale des solutions du sol ainsi qu’à son influence sur le transport des éléments principaux et traces dans le sol. Afin d'apporter des réponses sur l'importance de la fraction colloïdale dans le processus de transport des éléments majeurs et traces dans les solutions du sol, un profil de sol et les solutions de sol correspondantes ont été échantillonnés.
Matériels et Méthodes
Matériels et Méthodes
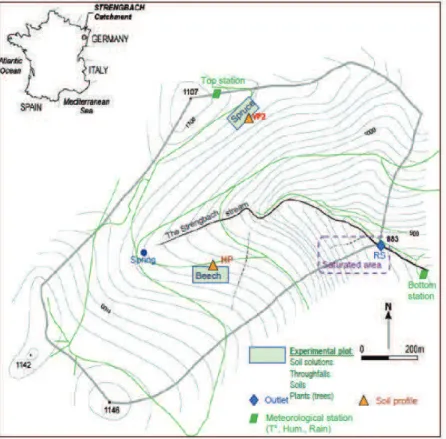
- Site d'étude: Le Bassin versant du Strengbach
- Echantillonnage
- Préparation des échantillons
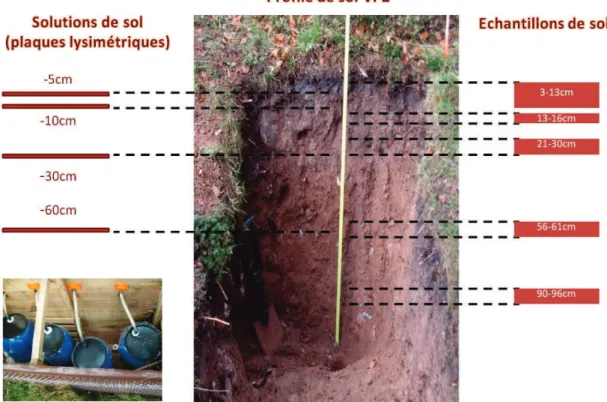
Le bassin versant comporte deux parcelles expérimentales équipées de plaques lysimétriques, de gouttières de récupération et de profils de sol. Le profil de sol VP2 étudié dans cette thèse a été échantillonné depuis la surface jusqu'à une profondeur de 1 mètre.
Solution de sol 0.2µm
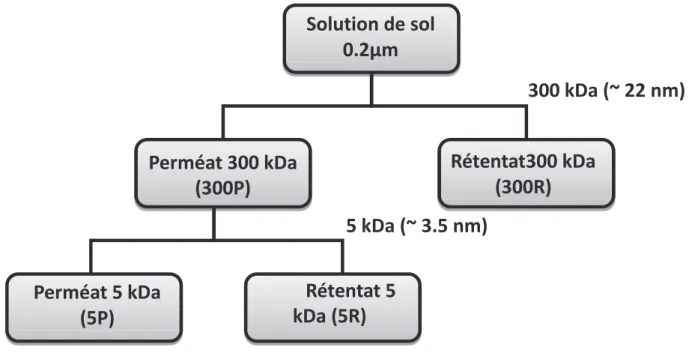
Les solutions de sol filtrées à 0,2 µm sont ultrafiltrées à 300 kDa pour obtenir un rétentat (300R) correspondant à la fraction colloïdale comprise entre 300 kDa et 0,2 µm (grande fraction colloïdale) et un perméat (300P) correspondant à la fraction inférieure à 300 kDa. Ensuite, la fraction 300P est ultrafiltrée à 5 kDa pour obtenir le rétentat (5R), qui correspond à la fraction colloïdale comprise entre 5 kDa et 300 kDa (petite fraction colloïdale), et le perméat (5P), qui correspond à la fraction dissoute dans notre étude. (Figure 4).
Perméat 300 kDa (300P)
Faute de volume, deux échantillons prélevés à 60 cm de profondeur n'ont été ultra-filtrés qu'à 5 kDa. 2013), différents paramètres dus à la procédure d'ultrafiltration tangentielle doivent être pris en compte pour le déterminer.
Rétentat300 kDa (300R)
300 kDa (~ 22 nm)
5 kDa (~ 3.5 nm)
Analyses physicochimiques et isotopiques
La mesure du rapport isotopique 87Sr/86Sr de solutions de sol filtrées et ultrafiltrées à 0,2 µm a été réalisée sur un TIMS Triton (spectromètre de masse à thermo-ionisation) (Thermo Fisher Scientific©). Par la suite, la composition isotopique du Ca de l'échantillon initial (filtré à 0,2 µm), les fractions colloïdales et dissoutes ont été mesurées selon le même protocole que les échantillons.
Characterization and evolution of dissolved organic matter in acidic
Matière organique dans le profil de sol VP2
Résumé
Ces différentes affinités pour les groupes fonctionnels organiques du DOC expliquent certains aspects du comportement des éléments traces dans les solutions du sol et le profil du sol, ainsi que la compétition entre éléments traces complexés au Corgo. Les résultats de cette étude sont importants pour comprendre la mobilité et la migration des polluants (tels que les métaux lourds ou les radionucléides) ainsi que des nutriments dans les écosystèmes naturels.
Abstract
Introduction
In the case of a forest soil, it arises mainly from the decomposition of litter, which controls the amount of organic matter (Berg et al., 2000). Leaching by rain, runoff and then soil solutions allows the soluble organic matter (dissolved organic carbon; DOC) to migrate downward into the soil (Kalbitz et al., 2000).
The sampling site
The acidification of the soil is linked to natural acidification (podzolization process), and to the introduction of acidic atmospheric deposits. The acidity causes the decrease in the buffer capacity of the soil and accelerates weathering.
Materials and methods
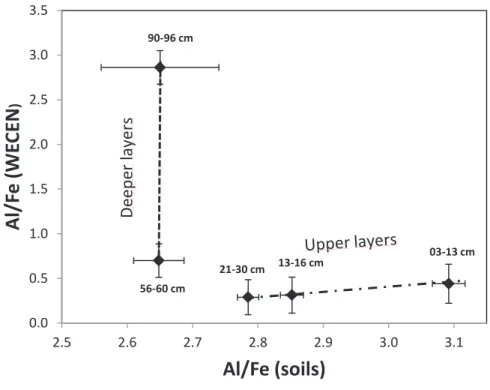
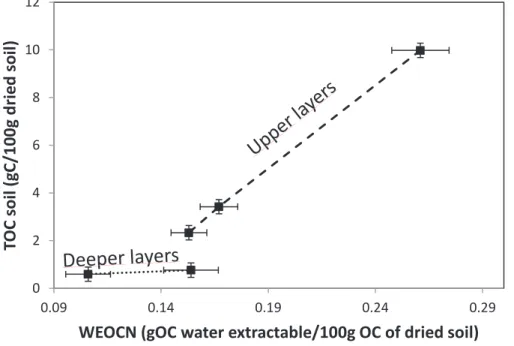
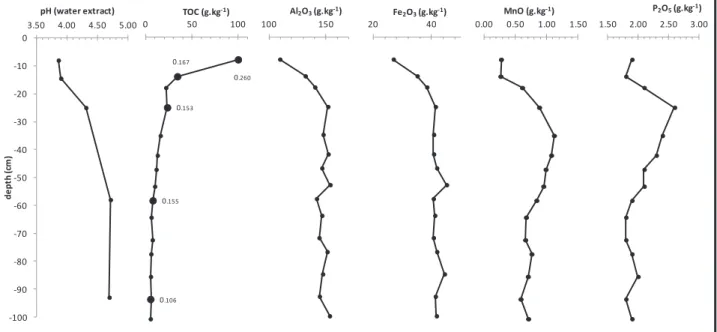
To compare the WEOC for the different depths of the soil profile, it was normalized (WEOCN %) to the amount of Total Organic Carbon (TOC) in the soil. To compare the WECE of soil from different depths of the profile, it has been normalized (WECEN %) to the total amount of element X present in the soil.
Results
According to Demiate et al., the cm-1 band could correspond to the bending vibration of the carboxylate ion. The bands between 1265 cm-1 and 1200 cm-1 correspond to the stretching vibration of the C–O bond in lignin-derived aryl methyl ether (Schwanninger et al., 2004).
Discussion
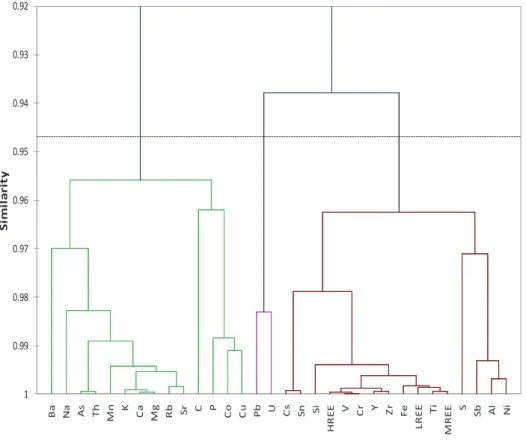
At low pH, Th forms complexes with OM (Reiller et al., 2002); Complexation with carboxylic acid is inherently electrostatic (Bismondo et al, 2003) and can increase Th mobility in the upper soil compartment. Iron and Al are not part of the same pool in the upper OM-enriched soil compartment (Fig.8) suggesting that they are bound to DOC with different binding sites (Cabaniss, 1992; Nierop et al., 2002). ).
Al/Fe (soils)
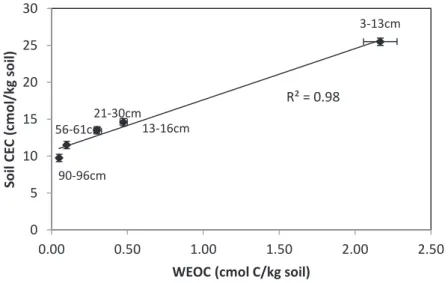
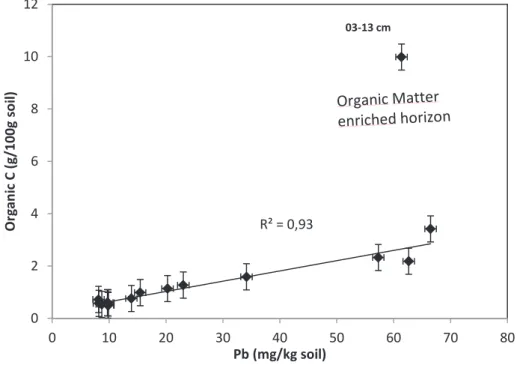
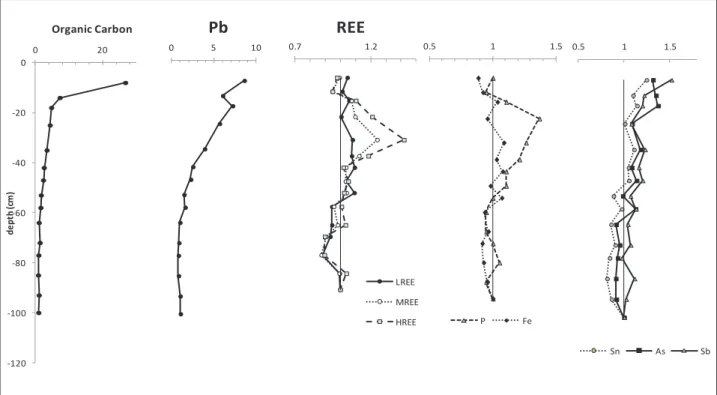
The correlations in Fig.10 and 11 also highlight, in agreement with Sipos et al. 2005), the importance of Fe oxyhydroxides and OM for the stabilization of Pb in soils. Other studies indicate that Pb is preferably coordinated with a carboxylic acid function of DOM (Kurková et al., 2004; . Cornard and Lapouge 2007).
WECE N P WECE N Fe
Atmospheric Pb enters the labile soil basin potentially in the soluble form (PbSO4), contributes to soil-soil solute exchange (Izquierdo et al., 2012) and moves faster than the less soluble Pb oxides or oxyhydroxides that form complexes organo-metallic with OM soils or precipitates. As a function of these parameters, Pb can show different mobility and migration rates in soil, a phenomenon previously observed for atmospherically derived Pb in soils of the Strengbach watershed ( Stille et al., 2011 ).
WECE N Pb
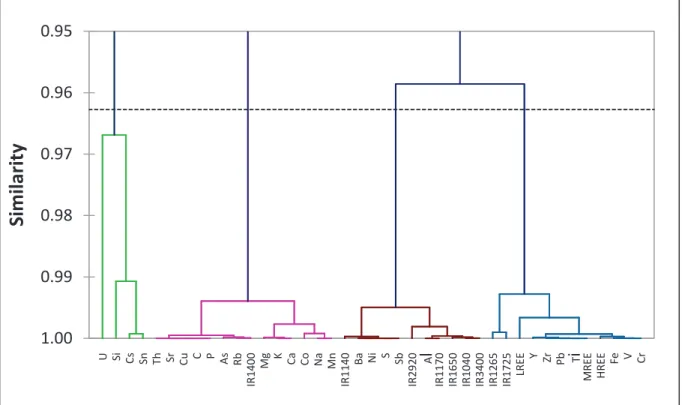
The immobilization of LREE close to the surface can be controlled by the precipitation of secondary REE-bearing minerals (Braun and Pagel, 1994) such as florencite or rhabdophan, as observed in soils of the Strengbach catchment (Stille et al., 2009). Thus, LREE are more available for co-precipitation with secondary minerals (e.g. observed rhabdophane in Stille et al. 2009) throughout the soil profile, whereas HREE and MREE are preferentially bound to aromatic compounds; The HREE distribution within the soil profile corresponds to the aromaticity, which reaches a maximum value at 30 cm depth (Table 3 and Fig. 3). 13, showing the variations of WECEN for Al and Fe as a function of WECEN LREE and HREE, confirms the observations of Marsac et al.
These results also agree with the distribution pattern of REE in soil solutions from the same site, which are depleted in LREE at greater depth (Stille et al., 2009).
Soil solutions (SS) of the Strengbach Catchment
The WECEN values for Al and corresponding LREE of samples from the OM-enriched soil space plot below the extrapolation line and point to the competition between Al and LREE.
SS ΣREE
SS LREE UCC / SS
WE) S ΣREE
S LREE UCC / S
Conclusion
The resulting change in DOC is accompanied by a change in the behavior of trace elements. Indeed, HAC WECEN in the OM-enriched region reveals relationships between trace element behavior and organic functional group variation. Lead is preferentially bound to the carboxylic acid function of DOC, which is mainly present in the topsoil.
The comparison between soil solutions and WEOM fractions highlights similarities and differences in trace element behavior.
Dissolved and leached organic matter in soil: a review on the impact of land use and management practices. Dissolved organic matter composition in forest soil solutions: changes caused by seasons and passage through mineral soil. A comparative characterization of dissolved organic matter using original water samples and isolated humic substances.
Characterization of organic matter in a northern hardwood forest soil by 13C NMR spectroscopy and chemical methods.
Factors controlling the chemical composition of colloidal and
Facteurs contrôlant la composition des solutions de sol
- Sampling site
The colloidal and dissolved fractions of the soil solutions have been obtained by tangential flow ultrafiltration. The biochemical processes thus affect the composition of the soil solutions and more specifically the concentration of. These parameters affect the nature of the colloidal or dissolved phases in the soil solutions and thus the transport at the soil/soil solution interface.
The main objective of this study was to elucidate transport by colloidal and dissolved phases in the first meter of soil.

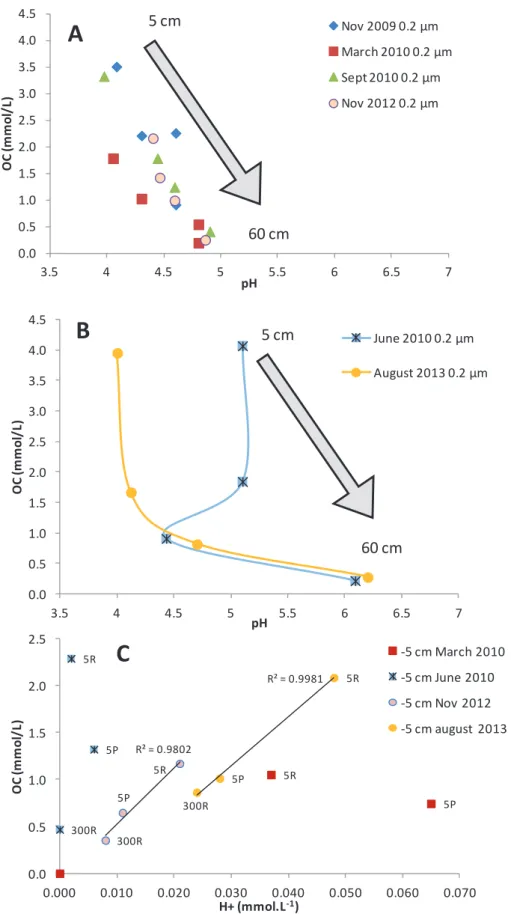
The Specific Ultraviolet Absorbance at 254nm (SUVA254) is determined by UV absorbance of the soil solution samples at 254nm normalized to the OC concentration in mg C.L-1. This parameter was determined for the different samples and allows the variation of the aromatic character for all colloidal and dissolved fractions. Figures 3A and 3B show the variation of the pH as a function of OC for the 0.2 µm samples and Figure 3C that of the H+ concentration as a function of the OC for some UF samples.
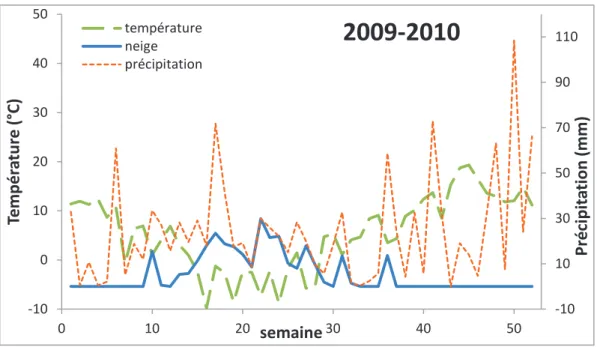
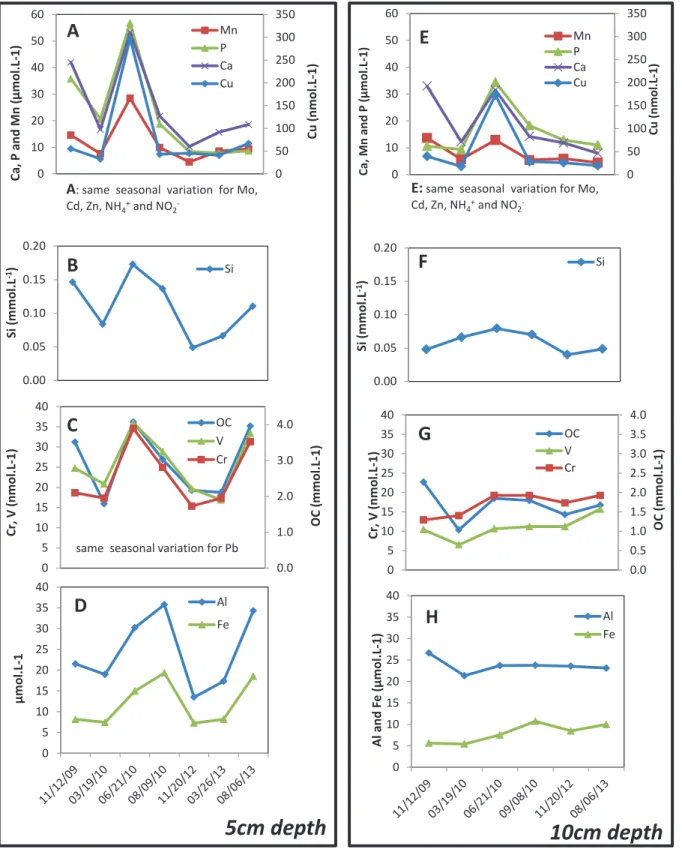
They fluctuate as a function of the season in the upper soil compartment and decrease with depth (Electronic Appendix E.A.T3 and Fig 4) as previously observed (Kaiser et al., 2001; . Verstraeten et al., 2014).
Facteurs contrôlant la composition des solutions de sol
- A. Figure 2: Correlation between Pb and OC in soil solutions
- A. Figure 4: Correlation between V and OC in soil solutions
- Conclusions
In the specific case of the samples collected during the anoxic events (November 2009 and June 2010), the aromaticity/OC ratio for these different fractions is lower compared to the other samples (not shown). This phenomenon has also been observed by Pokrovsky et al. 2010) for Ca in the study of the Severnaya Dvina River. A study of ultrafiltered forest floor solutions also indicates a seasonal variation of Al concentration in the <1 kDa fraction (Umemura et al., 2003).
According to Shaheen et al. 2014), V and Cr show different mobility dynamics in the soil solutions due to the different kinetic redox reactions.
Comportement des REE à l’interface eau-sol
A comparative study of the soil profile, soil water extracts, and soil solutions shows that (Eu*/Eu)DS. Clay and aromatic organic matter in soil are enriched at 30 cm depth (Gangloff et al., 2014b). In addition, the (Ce*/Ce)DS values of the aqueous extracts are lower than those of the soil solutions.
The weathering and reprecipitation of these phosphates controls part of the REE dynamics between soil solutions and soil (Stille et al., 2009). At the same time, Yb (HREE) is adsorbed from the soil solutions to the soil through aromatic organic compounds. The comparative study of the soil profile, soil water extracts and soil solutions shows that (1) the (Eu*/Eu)DS anomaly reflects weathering of plagioclase in the micropores and the migration of the released Eu to the macropores, (2) (Ce*/Ce) DS anomaly, is stabilized by the humic acid's electron shuttling (aromaticity) and only provides information on the redox conditions in the deeper soil horizons depleted of humic acid and finally (3) the HREE enrichment in the deeper soil solutions is the result of the partial dissolution of secondary minerals in the upper soil horizons (above 30 cm depth).
Mécanismes de fractionnement isotopiques du Ca
- Site de prélèvement et échantillonnage
- Méthodes de filtration et d’analyses
- Résultats
Les concentrations de Ca et de Sr dans les solutions de sol filtrées à 0,2 µm varient en conséquence jusqu'à 10 cm de profondeur. Selon la nature et la densité des fonctions organiques, le Ca se répartit entre la fraction colloïdale et la fraction dissoute. Ca et Sr sont complexés au Corga de la fraction dissoute (5P), et une partie restante est sous forme ionique Ca2+ et Sr2+.
Ce phénomène a également été observé par Pokrovsky et al. 2010) dans l'étude de la fraction colloïdale de la rivière Severnaya Dvina.
![Table 1b: Enrichment factors (normalization to Zr and the soil from 100cm depth, i.e. [(X i /Zr i )/(X 100 /Zr 100 )] )](https://thumb-eu.123doks.com/thumbv2/1bibliocom/467074.71658/51.1263.110.1152.126.570/table-enrichment-factors-normalization-zr-soil-100cm-depth.webp)