The purpose of the campaign was to study oxidation processes, atmospheric chemistry and composition of a number of species primarily in the marine boundary layer. AMS provides online real-time measurements of the mass of non-refractory components of aerosol particles as a function of their size (Jayne et al., 2000; Allan et al., 2003a,b; Jimenez et al., 2003). In this study, we present detailed information on aerosol sampling at Mace Head with state-of-the-art instrumentation show-.
In this paper we describe the full period when ATOFMS was operating, with special emphasis on the part of the period when. In Europe, during the MINOS campaign (Crete, August 2001), an Aerodyne aerosol mass spectrometer and a single particle mass spectrometer (SPLAT) were run together (Schneider et al., 2004), although the preliminary state of development of SPLAT did not allow a complete comparison. The sampling efficiency of ATOFMS is approximately proportional to the third power of the diameter (Allen et al., 2000).
The unique feature of ATOFMS is that it can provide information on real-time changes in the size-resolved mixing state (internal/external) of the single particle being sampled. Here, the particles are deposited on the hot surface, and the volatile and semi-volatile components of the aerosol evaporate. In the ToF mode, the quadrupole mass spectrometer is set to scan preselected fragment ions and measure their mass as a function of particle size.
In MS mode, the average chemical composition of the non-refractory aerosol components is determined by scanning the full mass spectrum (1–300 m/z units) with the quadrupole mass spectrometer.
ACPD
Results
The reader is requested to also refer to Dall'Osto et al. 2004), where a detailed analysis of the ATOFMS data obtained by manual classification of single particle mass spectra can be found. As expected, sea salt was the most important class, accounting for 69.2% of the particles generating mass spectra. It is important to note that the efficiency of ATOFMS is very different for different types of particles.
Group 1C is characterized by peaks of NaxClyNOz, while group 1F. The temporal trends of these classes are in agreement with those presented in Dall'Osto et al. 2004), where a detailed analysis of the types of mass spectra of individual particles belonging to these clusters can be found. The difference in the percentage of the main class of sea salt (class number 1 in Table 2) between the two different classifications is mainly due to this cluster. Due to the lack of negative spectra, this cluster was placed in the unclassified part of the manual classification.
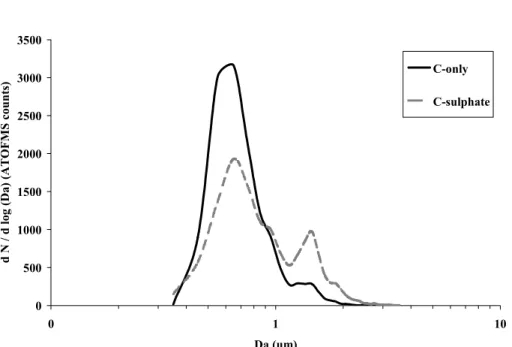
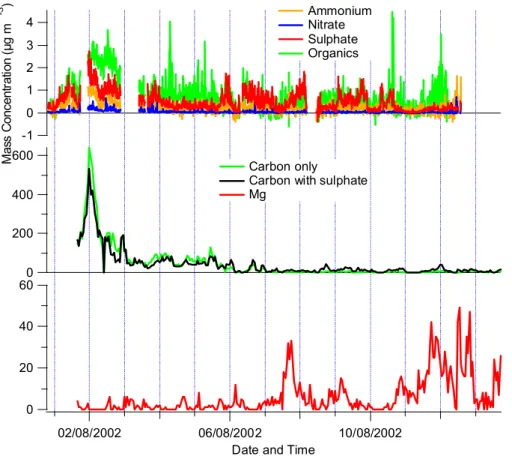
The overall behavior of the particles was largely very similar to other MBL experiments performed with AMS (Allan et al., 2004; Topping et al., 2004), in that sulfate and organics dominated loadings roughly equal in general to the mean concentrations. However, there are uncertainties associated with the size distribution inferred in our study, which result from the extreme inefficiency of the standard ATOFMS input at very small particle sizes (making the scaling factor uncertain) and which would be resolved by using of an aerodynamic lens. introduction (Su et al., 2004). 11, about 1000 nm diameter, has an increase in organic content compared to sulfate in the two pure cases, which would be consistent with the hypothesis that Mg is an indicator of the presence of organic species in sea salt particles.
Since the transmission efficiency of the lens used in AMS falls above 600 nm and is close to zero at 2 µm (Jayne et al., 2000), it is likely that a significant fraction of the organic load in this mode is in. ATOFMS efficiency for the finest size fractions (0.06–0.25 µm) reported by O'Dowd et al. 2004) is very low, which means that most of the particles in this size range are missed. It may be that this carbon contribution is due to the biogenic particles, but due to the limitation of ATOFMS efficiency and the absence of single particle information from AMS, it is not possible to draw conclusions about this.
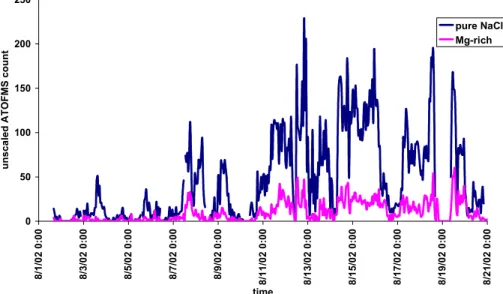
The highest concentrations of Mg-rich particles (relative to the total number of fresh sea salt particles) were recorded during periods of intense rain, regardless of wind speed. To better understand the importance of the Mg-rich particles, ART 2a was performed only on particles with m/z 24. Due to the frequent occurrence of the peak at m/z 24, most of the classes are similar to those .
Two of the clusters were essentially the same, with only a small difference in intensity. The majority of the unclassified particles (cluster 4D) presented only one or two distinguishable m/z signals (m/z 23 [Na]+ and/or m/z 39 [K]+) in the positive spectrum and none in the negative.
Conclusion
Instead, it appears to correlate with the total number of particles detected, most of which are assigned to the main sea salt class. Amines are another type of group that presents characteristic peaks, such as m/z 58 and m/z 86 (Angelino et al., 2001). The ATOFMS is very sensitive to alkali metal cations (Gross et al., 2000), and since sodium and potassium are present in great abundance. in sea salt particles, it is not surprising that these are the only peaks visible in some spectra.
Moffet, R., Shields, L., Berntsen, J., et al.: Characterization of an Ambient Coarse Particle Concentrator used for human exposure studies: Aerosol size distributions, chemical composition and concentration enrichment, Aerosol Sci. Raes, F., Van Dingenen, R., Vignati, E., et al.: Formation and cycle of aerosols in the global troposphere, Atmos. McFiggans, G., et al.: Aerosol chemical characteristics from sampling conducted on Jeju Island, Korea during ACE Asia, Atmos.
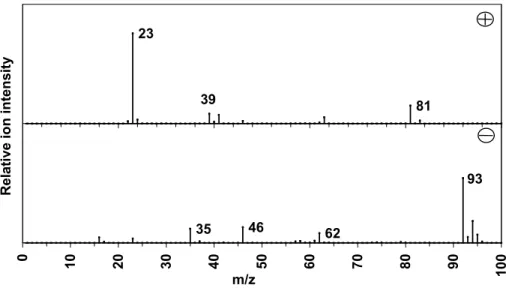
Yadav, R., Saoud, K., Rasouli, F., et al.: Examination of cigarette smoke aerosol using time-of-flight mass spectrometry, J. 29 Figure 1: ART-2a cluster (1D) positive (plus) and negative ( minus) ion mass spectra of particles attributed to sodium chloride-rich with a strong peak at m/z – 93, probably sea salt particles reacted with nitric acid. Note ART-2a spectra omit minor peaks, which are presented in full spectra in Dall'Osto et al.
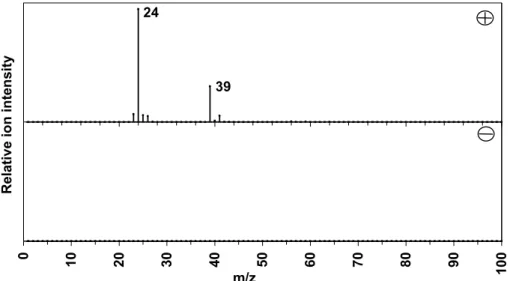
Group ART-2a (1D) positive (plus) and negative (minus) ion mass spectra of particles attributed to sodium chloride rich with a strong peak at m/z−93, likely to be salt particles of the sea reacted with nitric acid. Cluster ART-2a (1E) positive (plus) and negative (minus) particle mass spectra attributed to Mg-rich particles. Aerosol time-of-flight mass spectrometry (ATOFMS) positive (plus) and negative (minus) one-particle ion mass spectra attributed to Mg-rich particles (cluster 1E).
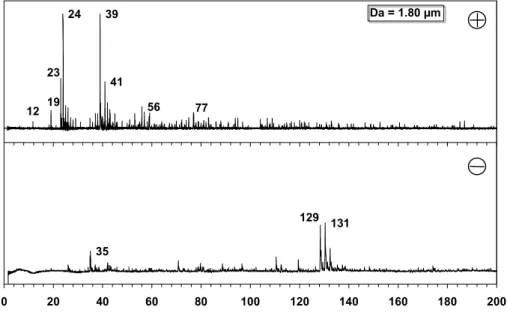
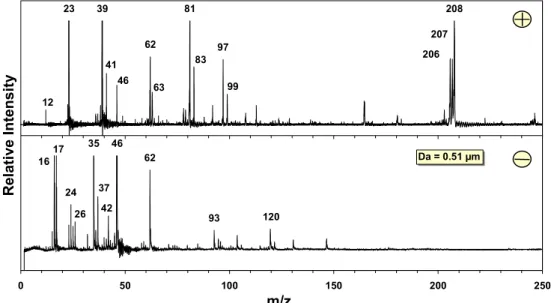
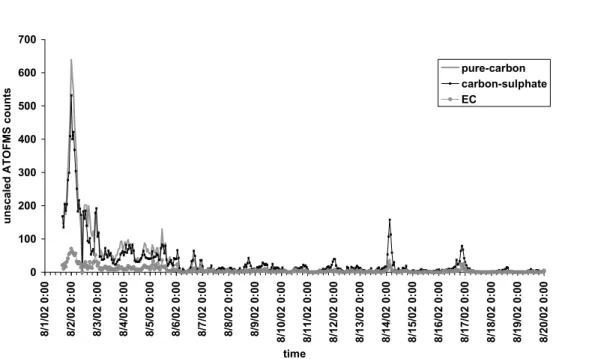
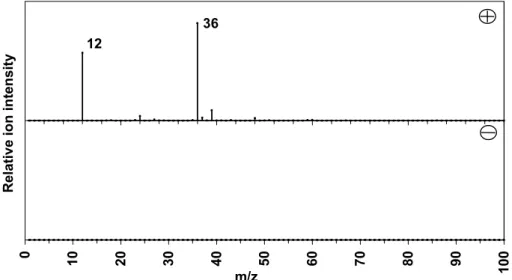
Positive (plus) and negative (minus) ion mass spectrum of a single particle of a 1.06 µm particle detected during a pollution event. Positive (plus) and negative (minus) ion mass spectrum of a single particle of a 1.06 µm particle detected during a pollution event. 32 Figure 7: Positive (plus) and negative (minus) cluster mass spectrum of ART-2a (2A) particles assigned to the carbon-only cluster.
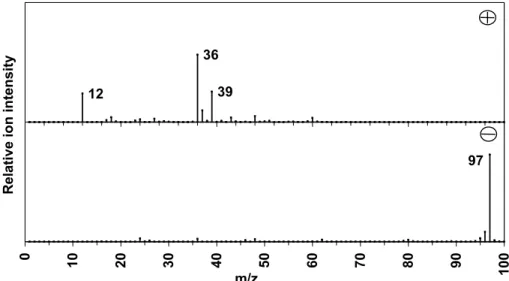
ART-2a cluster (2A) positive (plus) and negative (minus) particle mass spectra attributed to carbon-only cluster. ART-2a cluster (2B) positive (plus) and negative (minus) particle mass spectra attributed to carbon sulfate cluster.