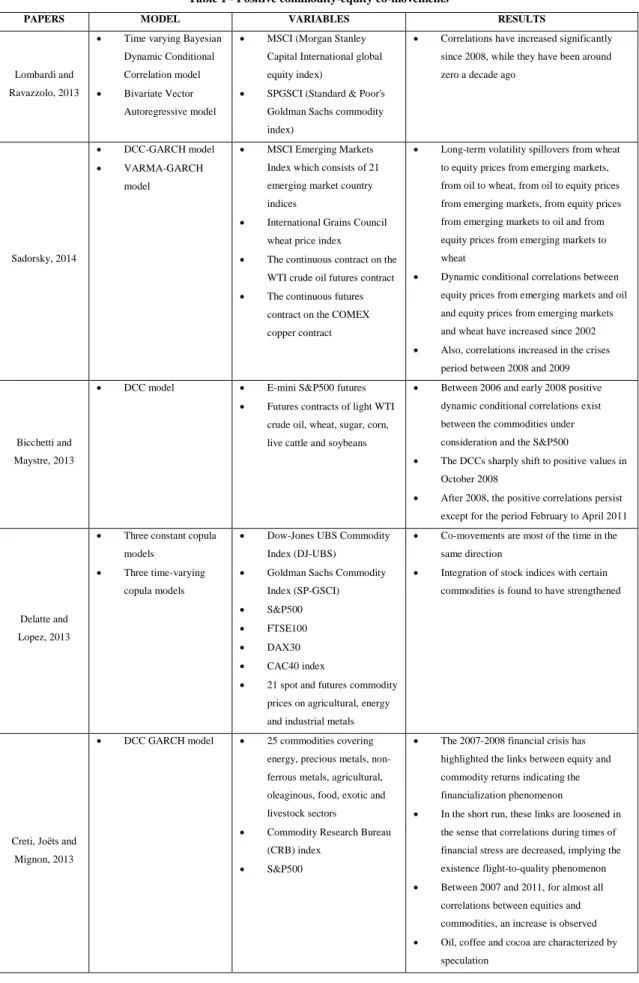
To our knowledge, there is only one study in the literature that tests flight-to-quality from stocks to commodities. Since no co-integration is found, the first differences of the data are used in the VAR model. In this thesis, we investigate the presence of flight-to-quality effects from stocks to commodities.
However, flight-to-quality from stocks to commodities has not been further explored in the literature. Regarding the methodologies for testing for flight-to-quality, there have been a few different approaches in the literature. It is worth noting that the methodology implemented in the study of Chan, Treepongkaruna, Brooks and Gray (2011), namely the Markov regime switching model is not considered the most suitable for testing flight-to-quality events according to Durand, Junker and Szimayer (2010).
Quality flight events in regime switching models are evident in the regime of negative correlations between the assets considered. In the literature another approach to testing the quality of the flight in quality is also the local correlation approach. There are different approaches in the literature to directly test for flight quality, as mentioned above.
Furthermore, infection incidents are identified and differentiated in Billion and Caporina's (2010) paper from flight to quality.
Data
Methodology
𝐹9𝑡 marks the first differences in the exchange rate of the dollar, which approximates the Japanese yen to one US dollar. Another problem with the rotating window technique is determining the correct window length. Having estimated the rolling window correlations and dynamic conditional correlations between equity returns and commodity residuals from equation (1), we rely on the formal definition of year-to-quality given in Baur and Lucey's paper to identify year-to-quality events.
According to this definition, the flight of quality from stocks to commodities is defined as a decrease in the correlation coefficient and a simultaneous decline in stock markets. So we can see the date of the year-quality event and the sliding window correlation value in that particular date. Therefore, we can see the date of the flight event in the quality as well as the value of the dynamic conditional correlation in that particular date.
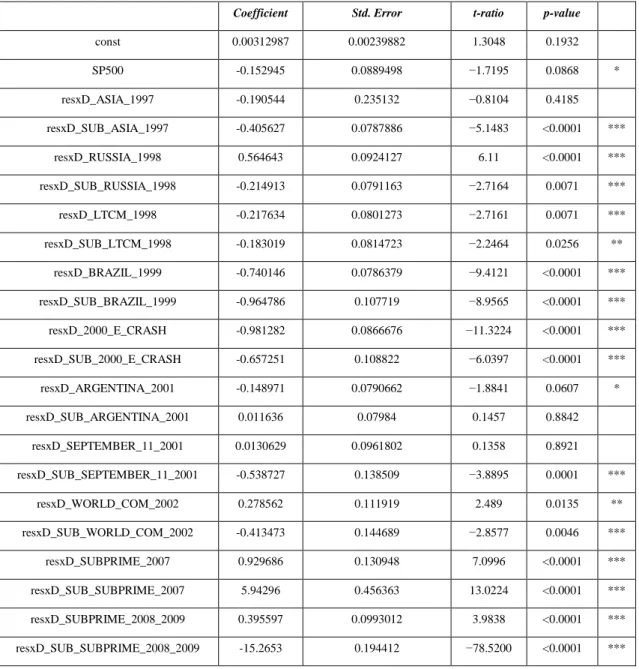
We do not obtain statistically significant results for flight-to-quality event data. To perform a more formal flight-to-quality test, we follow the methodology of Baur and Lucey (2009). Baur and Lucey (2009) define flight-to-quality from stocks to bonds as a decrease in the correlation coefficient during falling stock markets compared to a benchmark period, resulting in a negative level of correlation.
If the correlations between stocks and bonds are positive before the crisis and become negative during the crisis period, there is a flight to quality. In our dissertation we use the same definition, but instead of bonds we examine flight-to-quality from stocks to commodities. The dummy variable has a value of 1 for the month prior to the onset of each of the above ten crises, and 0 otherwise.
If the sum of 𝛽, 𝛾𝑖 and 𝛾𝑞∗ (𝑞) is strongly negative, there is a flight to quality from stocks to commodities if the crisis period is characterized by a fall in stock markets. Such commodities are treated as a homogeneous asset class in order to identify a common flight to quality event for all goods discussed in this thesis. The dummy variable has a value of 1 for the month before the onset of each of the ten crises mentioned above and 0 otherwise.
Empirical Results
The results of the rolling window correlations and the dynamic conditional correlations between the S&P500 index and each commodity residual return are plotted in Graphs 58 through 95. Dynamic conditional correlations between defactored oil returns and S&P500 index returns are presented in Graph 94. Dynamic conditional correlations rolling window correlations between the S&P500 -index returns and defactored food commodity returns are presented in graphs 84 to 91.
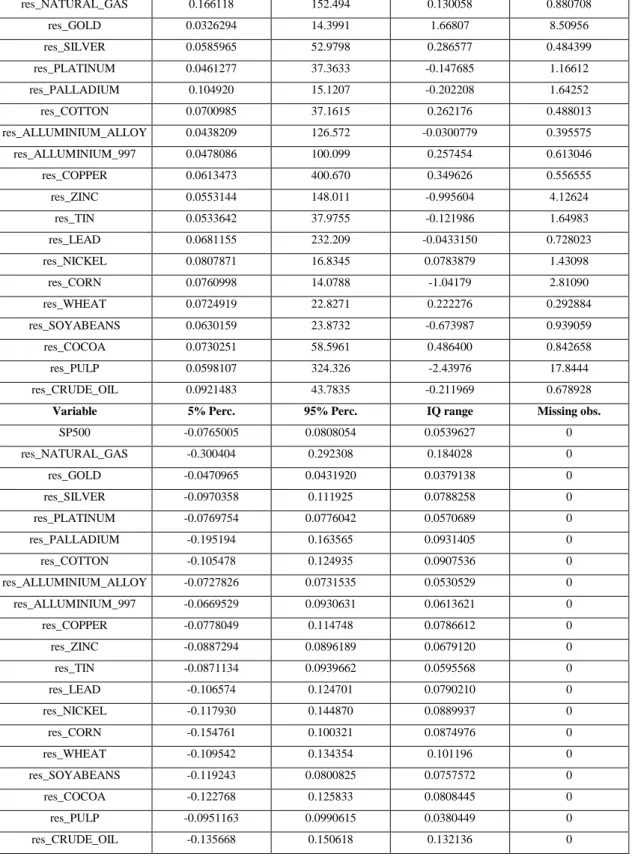
Specifically, there is a flight to quality from the S&P500 index to natural gas in July 1997. So in terms of energy commodities, we see that natural gas is on average more volatile than the S&P 500, but during the Subprime crisis of 2008-2009, the risk of the S&P500 has increased. index much larger. Crude oil is, on average, riskier than the S&P 500 and remains so through the 1998 LTCM crisis and the 2007 subprime crisis.
During the Subprime crisis, risk is also almost four times greater for the S&P500 compared to gold's risk. Silver is riskier on average than the S&P500 even during the LTCM crisis of 1998, but during the WorldCom crisis of 2002 and the Subprime crisis of 2008-2009, the S&P500 becomes much riskier. Platinum is also riskier on average than the S&P500, but during the LTCM crisis of 1998 and more remarkably during the Subprime crisis of 2008-2009, its risk becomes smaller.
For palladium, which is more volatile than the S&P500 on average, in the month after the 2002 WorldCom crisis and during the subprime crisis, its risk is greater than that of the S&P500. In contrast to most commodities, zinc's risk remains higher than the S&P500 during the 2008 LTCM crisis and the 2007 subprime crisis. Also, nickel's risk is less than the S&P500's during the 1998 LTCM crisis, although the risk is higher on average.
However, during the WorldCom crisis of 2002 and the Subprime crisis of 2008-2009, soybeans are a safer asset to invest in compared to the S&P500. Cocoa is also riskier than the S&P500 on average and, with the exception of the 2007 subprime crisis during the other identified flight-to-quality events, risk is lower than that of the S&P500. Pulp, on the other hand, is a medium-risk commodity that is lower than the S&P500 index.
Conclusions
Finally, results from a panel regression, also used to treat commodities as a homogeneous asset class, suggest flight to quality from the S&P500 to commodities during the Subprime crisis of 2008-2009. These results are also justified when we consider our conditional volatility analysis for each commodity. Our thesis empirically finds flight-to-quality from stocks to commodities suggesting that in periods of economic turmoil and increased risk aversion, commodities become an alternative investment to stocks.
This thesis contributes to the literature because, to our knowledge, there has been no empirical evidence of flight to quality from stocks to commodities. Another contribution of our thesis is that it treats raw materials as an asset class and not as inputs in industrial production by filtering demand and supply parametrically. These results are important for asset allocation and hedging strategies at times when they are most needed.
Flight to Quality (FTQ) Dates from S&P500 to Silver Flight to Quality (FTQ) Dates from S&P500 to Platinum (DCC estimates used) (DCC estimates used). S&P500 Flight to Quality (FTQ) Dates for Palladium S&P500 Flight to Quality (FTQ) Dates for Cotton (DCC Estimates Used) (DCC Estimates Used). Flight to Quality (FTQ) Dates from S&P500 for Aluminum Flight to Quality (FTQ) Dates from S&P500 for Alloy (DCC Estimates Used) Aluminum 99.7% (DCC Estimates Used).
Flight to Quality (FTQ) Dates from the S&P500 for Copper Flight to Quality (FTQ) Dates from the S&P500 for Zinc (DCC Estimates Used) (DCC Estimates Used). Flight to Quality (FTQ) Dates from S&P500 to Tin Flight to Quality (FTQ) Dates from S&P500 to Lead (DCC estimates used) (DCC estimates used). Flight to Quality (FTQ) Dates from the S&P500 to Nickel Flight to Quality (FTQ) Dates from the S&P500 to Corn (DCC Estimates Used) (DCC Estimates Used).
S&P500 flight-to-quality (FTQ) data to Wheat S&P500 flight-to-quality (FTQ) data to Soyabeans (using DCC estimates) (using DCC estimates). S&P500 flight-to-quality (FTQ) data to Cocoa S&P500 flight-to-quality (FTQ) data to Pulp (using DCC estimates) (using DCC estimates). Flight-to-quality (FTQ) data from the S&P500 to crude oil (used DCC estimates).
Flight-to-quality (FTQ) data from the S&P500 to Natural Gas Data from flight-to-quality (FTQ) from the S&P500 to Gold (rolling window estimates used) (rolling window estimates used). S&P500 flight-to-quality (FTQ) data to Silver S&P500 flight-to-quality (FTQ) data to Platinum (rolling window estimates used) (rolling window estimates used). S&P500 flight-to-quality (FTQ) data to Palladium S&P500 flight-to-quality (FTQ) data to Cotton (Rolling window estimates used) (Rolling window estimates used).
Flight-to-quality (FTQ) dates from the S&P500 to Aluminum Flight-to-quality (FTQ) dates from the S&P500 to Alloy (Rolling window estimates used) Aluminum 99.7% (Rolling window estimates used). Dates of flight-to-quality (FTQ) from the S&P500 to Copper Dates of flight-to-quality (FTQ) from the S&P500 to Zinc (Rolling window estimates used) (Rolling window estimates used). Dates of flight-to-quality (FTQ) from the S&P500 to Tin Dates of flight-to-quality (FTQ) from the S&P500 to Lead (Rolling window estimates used) (Rolling window estimates used).
S&P500 Transition to Quality (FTQ) Dates to Nickel S&P500 to Quality Transition (FTQ) Dates to Corn (rolling window estimates used) (rolling window estimates used). Quality Transition Dates (FTQ) from S&P500 to Cocoa Quality Transition Dates (FTQ) from S&P500 to Pulp (Floating Window Estimates Used) (Floating Window Estimates Used).