Introduction
Background and related work
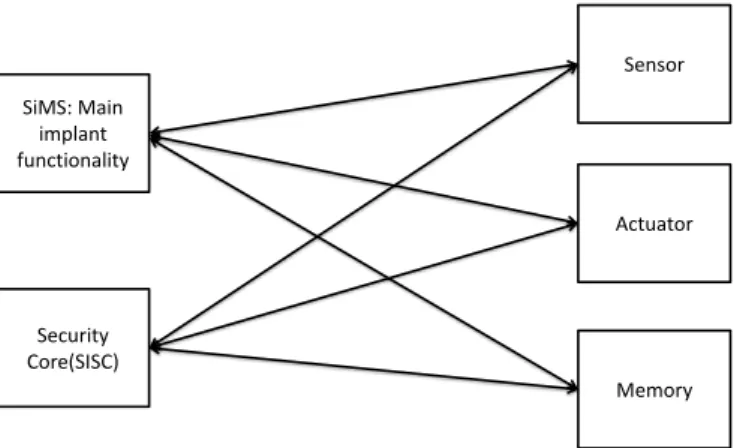
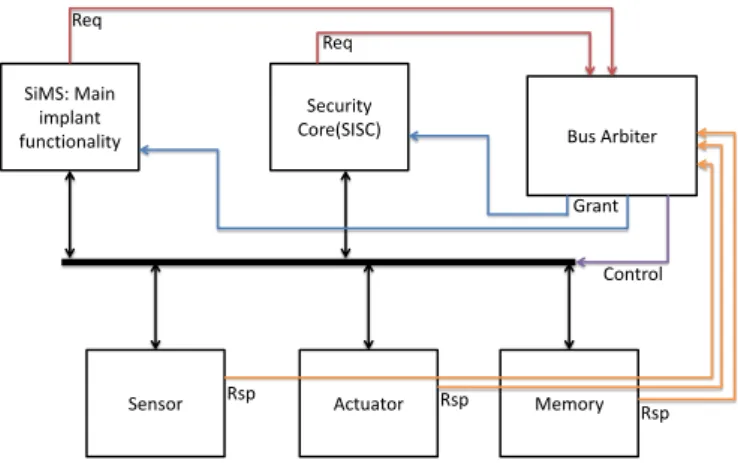
Implantable Medical Device components role
The systems that deliver therapy based on sensor readings are defined as closed-loop, while those that deliver therapy based on the programming of the patient's physician (without real-time closed-loop loop feedback) are defined as 'open-loop'. ”. The components of an IMD must communicate with each other in order to perform their calculations. These measurements are necessary to help the IMD deliver an effective therapy and make decisions accordingly.
For example, a glucose sensor (i.e. used by an "artificial pancreas") that detects the glucose in the bloodstream may provide 8-12 bits of data per minute, while an EKG sensor (i.e. used by a combined artificial pacemaker) that monitoring the heart rate of the patient can provide bits of data per second. The type of therapy delivered by an IMD depends on the specific functional requirements, the most common being electrical stimulation. As in the case of the sensor, the communication needs of the actuator vary from application to application.
Its communication activity is paramount and includes requesting data from the sensor, sending commands to the actuator, and storing sensor data and actuator commands in memory. An external user should be able to monitor and control the IMD, so he should be able to send commands to the IMD and the IMD will send physiological data back to the external user.
System On Chip Interconnect Topology
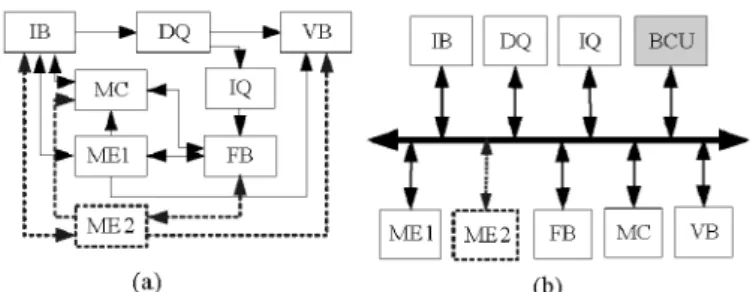
At any given time, only one of these entities can place signals on the bus, while every other entity observes these signals and, depending on the content of the signals, can choose to accept or discard them. The entities must send their bus requests to the arbitrator and the arbitrator determines which of these will be granted based on the arbitration protocol. However, as the number of entities associated with the bus increases, the bus speed decreases due to the higher capacitive load it has to drive over a longer distance [2].
The collection of these switches at intersections is called a "fabric" of crossbars. The main advantage of a crossbar is that it can potentially serve multiple masters simultaneously (using switches) as long as each slave is connected to at most one master. Point-to-point architecture is one of the simplest connections, where two components that need to communicate with each other have a dedicated connection (Figure 2.4).
The fully connected type connects every master to every slave while the custom one is designed according to the needs of the masters. The main advantage of point-to-point is that its throughput remains stable regardless of how many components it connects, because the different modules do not compete with each other.
Related work
- Bus versus Point-to-point
- Crossbar versus Bus
The simulation of the perfect data set proved that the crossbar consumes more power per cycle than the bus with the same number of components (simulations were done with 4, 8 and 16 components). The slave message contains the data received from the slave and the address of the initial request. We chose a round-robin algorithm for our implementation, i.e., the arbiter grants permission to masters requesting the same slave in a round-robin order.
We observe that the area requirement of the crossbar tends to increase as the number of slaves increases. This is due to the extra logic needed for the implementation of the split and reconstruct function. We observe that P2P's need for space tends to increase as the number of slaves increases.
This is due to the additional logic required to implement the split and rebuild function. Here we attempt a comparison of crossbar and point-to-point interconnections based on the above measurements.
Implementation
Crossbar design
- Master interface
- Crossbar arbiter
- Fabric
- The slave interface
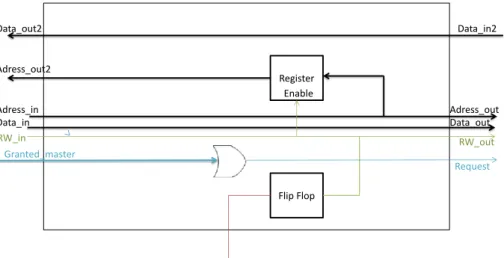
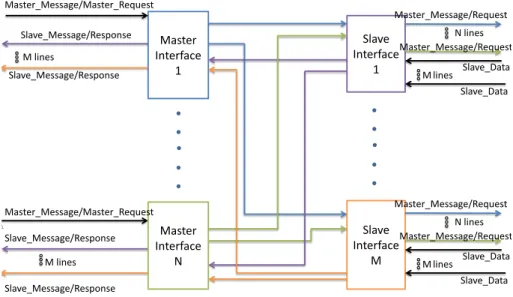
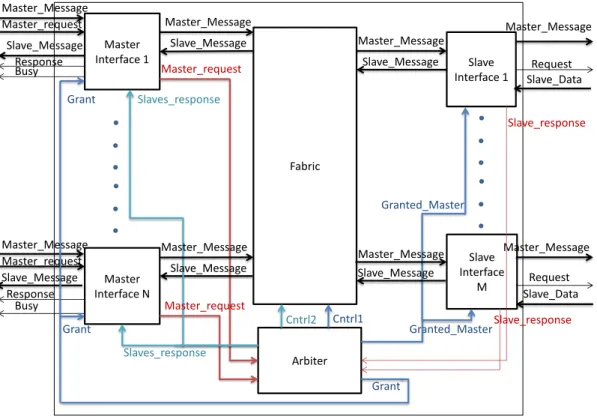
The master interface stores the master message and requests permission from the referee to send the message to the desired slave/slaves (signalslave_request). If the master interface is not granted access, the master interface again requests permission from the judge. If the master interface is available (Busy=0), then he accepts and stores the next master's message (Data, Address, RW) and requests permission from the referee (Master_request) to send the message to the desired slave/slaves.
If they are equal, it means that the master interface has been granted for all the slaves it requested. Regarding slaves→master communication, the master interface is notified of each response (Slaves_responses) from the crossbar arbiter. If any slave needs to give a response to the master, then the master is notified (Response=1).
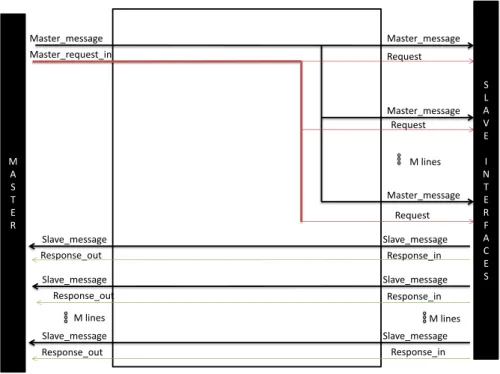
The slave interface is responsible for delivering the message from the master to the slave, handling the data response (if the request was of the "read" type), and generally managing all communications between the slave and the interconnect. The slave interface must extract the master's message from the fabric (data, address and RW) and deliver it to the corresponding slave.
Point-to-point Design
- Master / slave interface
The measured throughput of the interconnect depends on the traffic being served, while the maximum throughput depends on the interconnect design. If the number of requests per second does not exceed the saturation point of the interconnection, the throughput (traffic accepted) equals the demand (traffic offered). For example, a 2x16 has the same measured throughput for each of the L0-L100 random traffic patterns (the same is true for the M0-M100 and H0-.
For example, a 2x16 point-to-point has the same measured throughput for each of the L0-L100 random traffic patterns (the same is true for the M0-M100 and H0-H100 traffic patterns, see Figure 4.7). Finally, by halving the transfer width, we observe that the latency increases by two cycles because only half of the original request can be transferred at a time. In Chapter 3, we subsequently implemented the two out of the three interconnection types: A crossbar and a point-to-point connection.
Compared to point-to-point and crossbar architectures, we expect that the bus architecture would increase request latency and decrease peak throughput, but would decrease area cost and total energy consumption (based on connected work). One of the most popular and simple ways to reduce the dynamic power of interconnection is.
Evaluation
Experimental Setup
- Figures of merit
- Evaluation parameters
- Traffic patterns
For the evaluation of our implementations, we decided to measure 4 different characteristics: throughput, latency, area cost and power consumption, which are discussed next in order. This is measured by counting the total number of requests the interconnect serves in a specific amount of time and dividing the total requests served by the amount of time we measured. The area factor defines the space consumed by the implemented interconnection and it depends on the number of cells used and the type of cells.
To measure the average power consumption of our interconnects, we used the ”Synopsys PrimeTime” tool. The design data is provided by the synthesis of our design and the switching activity by the VCD file, which is produced from the simulation of the traffic pattern. As we mentioned in the previous chapter, the design of both our crossbar and point-to-point connection is flexible.
It can be adjusted to any number of masters and slaves and any transfer width (data and address fields) by changing a few parameters in VHDL. We are interested in the above specifications because they clearly indicate the influence of many different communication scenarios on interconnect performance and power consumption.
Experimental results
- Crossbar
- Point-to-Point
- Comparison
Finally, we note that by reducing the crossband transfer capability to 4-bit data and 16-bit address width, we obtain the same measurements. Finally, by halving the transfer width, we notice that the latency increases by two cycles, because only half of the initial request can be transferred through the fabric at a time. By implementing crossbars 2x2 - 4x32 we can have a clear and complete picture of the scalability of the crossbar area.
By implementing P2Ps 2x2 - 4x32 we can have a clear and complete picture of the scalability of the P2P area. For each traffic pattern and size, the measured throughput of both interconnects is the same (see Figure 4.15). Conversely, a crossbar takes advantage of the fabric (fewer connections) and simpler slave interface (only needs to handle 1 request or response at a time) for larger sizes, resulting in a reduced area.
In the following lines, we present two of the basic coding methods to reduce the power loss of an interconnection, regardless of the type of transmitted data (memory access, sensor data, command to actuator, etc.). We must emphasize that this method does not affect the internal power of the circuit, but it is designed to reduce the power lost cause of the I/O activity.

Conclusion
Summary
In chapter 2 we presented the structure and communication activity of an IMD, three possible good alternative communication architectures and related work regarding these interconnection types. Our experiments show that crossbar has lower performance than point-to-point, it is smaller for medium-large sizes, it consumes less power and scales better. To answer our question, we conclude that the crossbar type should be used for current and future IMDs instead of a point-to-point, given both their expected traffic patterns and low-power requirements, while the bus is also a good seems alternative and therefore its implementation is reserved for future work.
Future Work
The power dissipated in a CMOS Vlsi design can be classified into two categories: static power and dynamic power. The static power is the power consumed when the transistors are not switching, while the dynamic power is the power consumed by the switching logic states. As it concerns dynamic power, the dynamic power consumed by charging or discharging the output load external to the cell is referred to as "switching power" while the power dissipated within the cell is referred to as "internal power".
The power dissipated at the I/O can vary from a very low percentage to high enough to be the root cause of dynamic power dissipation. It also appears that as the width of the connection increases, the decrease in the. It is not unlikely that a future IMD will monitor a patient's four vital signs: oxygen saturation, heart rate, body temperature and blood pressure.
It has the same traffic pattern as System 1, except it also reads and stores vital signs. We refer to the traffic patterns based on the communication activity of this device as "Artificial Pancreas with Vital Signs(1)", "Artificial Pancreas with Vital Signs(2)", "Artificial Pancreas with Vital Signs(3)" and "Artificial Pancreas with Vital Signs(3)" '. Pancreas with vital functions(4)”.