Statistical analysis (PD, COV, Interclass Correlation Coefficient, Spearman Rank. Correlation Coefficient, one-way analysis of variance and least significance test) and evaluation of the indices were performed. The vast majority of texture features showed low to no robustness and a high degree of variance, making them poor candidates for potential biomarkers. Only a limited number of features appear to perform well across all statistical tests (Histogram Skewness, Kurtosis and Excess Kurtosis, GLCM Correlation and NGLDM Coarseness), while even fewer (Histogram Skewness and GLCM Correlation) can provide valuable information for distinguishing between features . mice from the treated group to the non-treated group.
Introduction
Thesis Originality & Issues Addressed
The radiomic properties derive from the texture analysis of the medical images, as mentioned above. To avoid overfitting of the radiomic features, a reduction in the number of features is required. CΟV was incorporated to determine the responsibility of the texture features (which is the variance of the numerical values of the texture features over different numbers of gray levels).
The ranking of the repeatability of the features across the different bin sizes (64, 128 and 256 noGL) does not necessarily equate to robustness (reproducibility, repeatability and liability). The mice's results were comparable to the results of the IQ phantom study.
![Figure 2. Images acquired with PET, CT, MRI [54] and US [55]. The upper left image is a CT image of a mouse, the upper right image is a PET image of a mouse, the lower left image is a MR image of a human and the lower right image is a US image of an emb](https://thumb-eu.123doks.com/thumbv2/pdfplayerco/296096.40292/13.892.131.514.500.805/figure-images-acquired-upper-image-image-mouse-upper.webp)
History of Medical Imaging
Positron Emission Tomography (PET)
- Basic Principles of Positron Emission Tomography
- Radiopharmaceuticals Used in PET Imaging
- Benefits & Limitations of 18F-FDG PET
- Recent Advances of 18F-FDG PET in Different Cancer Types
- Recent Advance of 18F-FDG PET in Infectious & Inflammatory Diseases
- Molecular Basis of 18F-FDG PET Imaging in Infection & Inflammation
- Novel PET Imaging Tracers/Radiopharmaceuticals
18F-FDG PET imaging is included in this type of cancer when an unsuspected distant metastasis is observed - stage IV disease. As previously mentioned, 18F-FDG PET/CT performs well in localizing the source of infection in HIV-related FUO. Demonstration of visualization of arterial inflammation using 18F-FDG [66].
![Figure 7. Display of the inflammation in patient with prosthetic hip joint infection [67].](https://thumb-eu.123doks.com/thumbv2/pdfplayerco/296096.40292/25.892.131.586.554.1059/figure-display-inflammation-patient-prosthetic-hip-joint-infection.webp)
Texture Analysis
- Image Classification: the Beginnings of Texture Analysis
- Texture Analysis Approaches
- First-Order Features
- Second-Order Features
- Higher-Order Features
- Factors Affecting the Computation of the Texture Features
- General Factors
- Image-Specific Factors
- Radiomics
- Radiomics in Oncology
- Potential Clinical Applications of Radiomics
- Challenges & Limitations of Texture Analysis
- Importance of Small-Animal Imaging
Page | 26 (histogram, conventional and shape indices), second order features (Gray Level Co-occurrence Matrix (GLCM)) and higher order features (Gray Level Run Length Matrix (GLRLM), Level Difference neighborhood gray Matrix NGLDM), Gray Level Area Length Matrix (GLZLM)) - the calculation of texture features in this investigation is done using statistical methods. Page | 28 Commonly calculated features in this category include: skewness (measures the asymmetry of the gray level distribution), kurtosis (compares the shape of the gray level distribution (peaked or flat) to a normal distribution), entropy. measures the randomness of gray level distribution), energy (measures the uniformity of gray level distribution), mean value and variance [37,38]. Energy: measures texture uniformity or second angular momentum of the image - repetitions of gray-level voxel pairs.
Entropy: measures the randomness of the gray level intensity distribution of voxel pairs - gives information about the image content (eg GLZLM: gives information about regional intensity variations or the distribution of homogeneous regions. Lack of standardization: since a "Standard of gold" for computing texture features does not exist, this leads to an unprecedented.
Gray Level Discretization: The choice of the total number of bins, it is one of the most important factors when it comes to the calculation of the texture features. Page | An evaluation of the different software codes used for the calculation of the texture features is needed. Standardization of statistical analysis: Texture analysis typically produces a huge amount of complex data.
Thus, images of small animals can be used to help advance the field of Radiomics and Texture Analysis.
Materials & Methods
- Small-Animal PET/CT Scanner Features
- Positron Emitting Tracer
- Image Quality (IQ) Phantom
- Animals
- PET Acquisitions of the IQ phantom
- PET/CT Imaging of the Animals
- Imager Reconstruction Parameters
- Image Analysis
- LIFEx Software
- Statistical Analysis
- Interclass Correlation Coefficient
- Spearman’s Rank Correlation Coefficient
- One-Way Analysis of Variance
- Coefficient of Variation
- Percent Difference
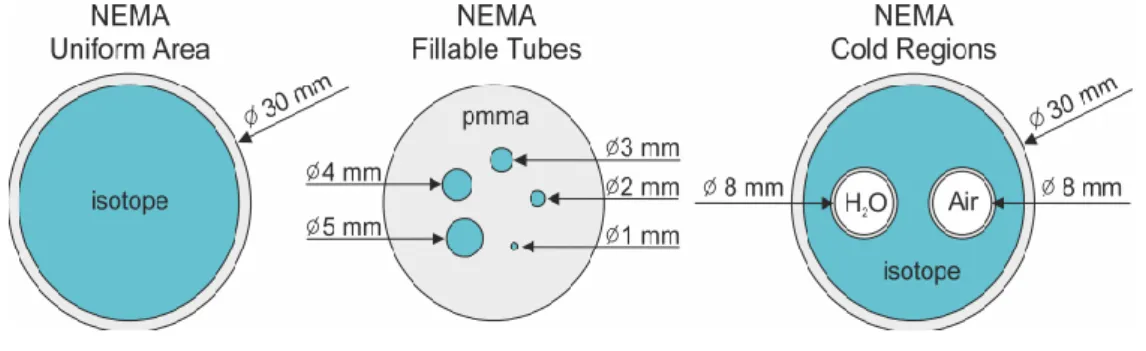
A well-studied and commonly used positron-emitting tracer; 18F-FDG (Viokosmos SA, Lavrio, Athens) was used to perform the experiments. One of the two cylinders contains non-radioactive water, while the other contains air [76]. Five regions of interest (ROIs) were set in each set of images of the IQ phantoms.
First-Order features provide information about the distribution of the gray levels in the image, while Second-Order features provide information about the spatial. First-order entropy provides information about the randomness of the gray-level intensities in the histogram, while second-order entropy provides. Page | 48 events, which are the relative position and distribution of the gray level intensities in the 3D matrix [82].
Representation of the 13 directions (gray boxes) for which the radiomic features are calculated, in the 3D matrix – 3D Voxel (green box) [79]. An ICC test is included to determine whether the chosen number of gray levels affects the numerical value of the texture indices and what the correlation is between the number of gray levels, if any. SPCC takes the highest values (+1) when the ranking of the observations between the variables does not change, and the lowest values (-1) when the ranking of the observations between the variables is completely opposite.
ANOVA was calculated for the total of the measurements at each number of gray levels for each radiomic feature in each region of interest.

Results
IQ Phantom Study
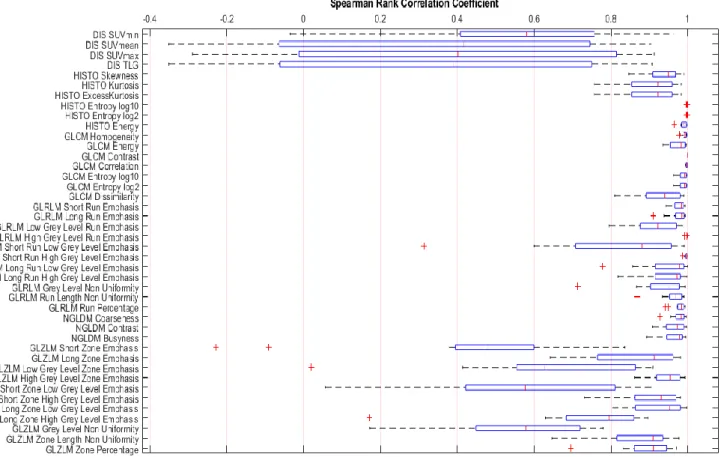
These results (34 out of 42 features scoring above 0.8 – 80% of features) agree with Leijenaar et al. Most of the features that exceeded the 0.95 mark were from the Second-Order feature group (7 out of 7 GLCM features – 100% of features). Furthermore, they concluded that the interpretation of the radiomic features which do not show at least good rank reliability is high.
The one-way ANOVA test was chosen to determine whether noGL affects the numerical value of the radiomic properties. The results of the one-way ANOVA test are presented in Table 2, while LSD results are shown in Table 3. Results of the one-way ANOVA for the sum of the acquisitions of the IQ phantom.
Overview of the radiomic features that were not affected by the total noGL – these features showed no statistically significant difference (p>0.05) between the 64, 128 and 256 noGL groups. COV and PD tests were calculated for a total of 51 radiomic features to determine the range of variance and reproducibility of the features at all three noGL (64, 128, and 256 noGL). These results are further supported by the data shown in Figure 23 (PD test results), which indicates that texture indices exhibiting low variances are consistent across noGL.
Heat maps of COVs of the radiomic features for each ROI at 64, 128 and 256 number of gray levels.
Animals study
Page | 76 As can be seen in Table 5, similar to the results of the one-way ANOVA for the. Only features that were found to be robust across all four comparisons (on mice from the 7-day group, the 10-day group, the treated group at 14 days, and the non-treated group at 14 days) were features of the first order (Histogram skew, kurtosis and excess kurtosis), second order features (GLCM. Correlation) and higher order features (NGLDM coarseness). Also, GLRM RLNU showed great robustness in the mice of the 7 and 10 days group, as well as in the mice of the treated group at 14 days, but showed no robustness in the mice of the non-treated group at 14 days.
However, almost all comparisons between the characteristics of the 64 and 256 noGL groups were found to be statistically significant. Regarding the results of one-way ANOVA between the mice of the treated and untreated groups after 10 and 14 days (as seen in Table 7), a limited number of characteristics showed a statistically significant difference only in the mice of the treated group. – these properties were: first order features (histogram asymmetry, log2 and log10 entropy and energy), second order functions (GLCM . Page | 77 homogeneity, energy, correlation and log2 and log10 entropy) and higher order functions (GLRLM SRE, LRE and RP and NGLDM Occupancy). Normal TLG was the only characteristic that showed statistical significance between days 10 and 14 in the untreated group and not in the corresponding comparison of the treated group.
Results of the LSD tests for mouse acquisitions during the 14. It is worth mentioning that both Higher-Order functions (all GLRLM and GLZLM functions) showed a COV lower than 0.1% only in the mice from they processed group of 14 days, while First-Order functions. Conventional TLG and SUVmax) showed only moderate to high variance in mice of Untreated at 14 days - in general these functions showed extremely high variances. Results of one-way ANOVA between days 10 and 14 for the mice from both the treated and non-treated groups.
Heatmaps of COVs of the radiomic features for the mice of all four groups over the course of the 14 days, at 64, 128, and 256 gray levels.
Conclusion
If this proves true, radiopharmaceuticals whose distribution is determined by different biological/physiological factors may provide additional information through the same texture indices, or/and different texture indices may prove to be robust and reliable.
Future Perspectives
-PET/CT for predicting outcome in ER+/HER2- breast cancer patients: comparison of clinicopathological parameters and PET image-derived indices including tumor texture analysis. 2019), Estimating the global incidence of cancer and. 18FDG PET/CT and arterial inflammation: predicting cardiovascular events in lung cancer.” QJM: an international journal of medicine. 68Ga-PSMA is a novel PET-CT tracer for imaging of hepatocellular carcinoma: a prospective pilot study.
The effect of SUV discretization in quantitative FDG-PET radiomics: the need for standardized methodology in tumor texture analysis. Radiomic signature of 18F fluorodeoxyglucose PET/CT for predicting gastric cancer survival and chemotherapeutic benefits. Magdics M, Szirmay-Kalos L, Szlavecz A, et al. 2010) TeraTomo project: a fully 3D GPU-based reconstruction code for exploiting the imaging capabilities of the NanoPET™/CT system.
2013) Performance evaluation of the small animal nanoScan PET/MRI system. 2017) Investigation of Image Reconstruction Parameters of Mediso nanoScan PC Small-Animal PET/CT Scanner for Two Different Positron Emitters Under NEMA NU 4-2008 Standards. Variability of texture features in FDG PET images due to different acquisition modes and reconstruction parameters. The clinical value of texture analysis of dual-time point 18F-FDG-PET/CT imaging to distinguish between 18F-FDG-avid.
Development and validation of a prognostic model incorporating [18F]FDG PET/CT radiomics for patients with minor salivary gland carcinoma. 2019) Effects of changes in positron emission tomography imaging parameters on radiomix functions.
![Figure 8. Display of the way of visualization of the arterial inflammation with the employment of 18F-FDG [66]](https://thumb-eu.123doks.com/thumbv2/pdfplayerco/296096.40292/27.892.129.783.455.914/figure-display-way-visualization-arterial-inflammation-employment-fdg.webp)
![Figure 11. Display of Radiomics’ methodological processes from the image acquisition to the data mining and assessment of clinical utility [70].](https://thumb-eu.123doks.com/thumbv2/pdfplayerco/296096.40292/45.892.131.787.254.624/figure-display-radiomics-methodological-processes-acquisition-assessment-clinical.webp)
![Figure 13. Multimodal imaging modalities for small-animal imaging [72].](https://thumb-eu.123doks.com/thumbv2/pdfplayerco/296096.40292/49.892.132.785.461.870/figure-13-multimodal-imaging-modalities-small-animal-imaging.webp)