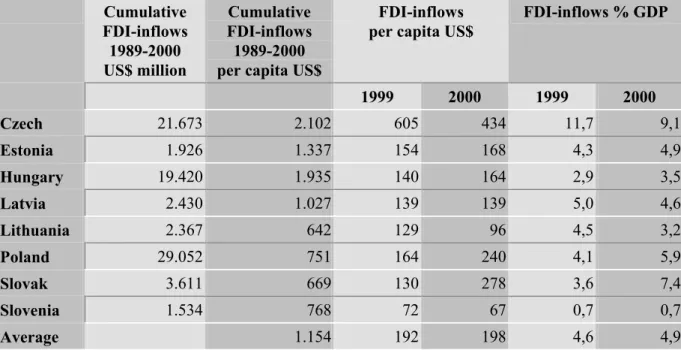
The volume of capital inflows to Slovenia was relatively low by international standards and the lowest among the Central European and Baltic countries striving to join the EU. Thus, with the exception of 1997, the size of capital inflows in Table 1 is greater than the size of capital inflows in Table 4. Based on the above comparisons, it is therefore difficult to claim that the size of capital inflows to Slovenia was extremely high by international standards.
Another assessment of the size of the capital inflow can be obtained by looking at monthly capital inflows and their volatility. Information on the total size of capital inflows presented in Table 1 includes both official and private financial transactions. Thus, the evolution of the composition of capital inflows reflects the evolution of the still incomplete process of stabilization (relatively high inflation).

Capital Inflows of Residents
This also suggests that the factors that explain capital inflows in this particular period were inextricably linked to the general conditions in the Slovenian economy and consequently susceptible to the influence of the central bank.6 Therefore, policy responses must be analyzed in terms of their success in addressing the causes that encourage capital inflows, and to a lesser extent in addressing their effects. The drastic reduction in banks' external borrowing can be explained by the BOŠ requirement that banks must balance their net foreign position as of July 31, 1996. Of all the controls, the restriction appears to have been the strongest in curbing capital inflows.
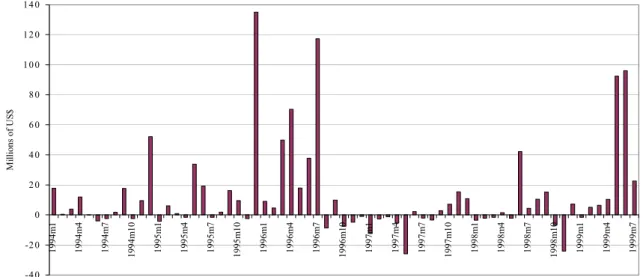
Short-term loans practically disappeared about two years after BOŠ introduced a limit on short-term borrowing in February 1995 (Figure 4).
Capital Inflows of Households
Capital Inflows of Non-Residents Foreign Direct Investment
C AUSES OF CAPITAL INFLOWS ( EMPIRICAL ANALYSIS )
What's more, the so-called "temeljna svetsina mera" (TOM) (base interest rate), which represents the average inflation during the last twelve months estimated by the BOS, is actually the base reference rate in the economy. To make the comparison realistic, the LIBOR rate is increased by say 100 basis points (quite high for Slovenian enterprises) and by the current annual depreciation of the Tolar against the Euro and the TOM rate is increased by the current banks. The TOM (+)-LIBOR (+) differential rate has been positive and substantial and declining only in the last two years Figure 7.
The explanatory variables used include: unhedged domestic/foreign interest rate differential (UID); index of industrial production (IO); dummy variables that enable the capture of the cyclical pattern in the predicted variables (KA and KA1), and dummy variables that cover the compensating accounting entries in the capital account of two large state transactions that did not affect capital inflows in 1996.8. The UID was defined as the difference between the 31-90 daily interest rates for deposits in Slovenia and Germany, adjusted to the actual changes in the SIT/DEM exchange rate for one month in advance. The estimated equations give reasonable results despite the quality of the data and the small number of observations.
In particular, the fit and diagnostics of the estimated equations are better when private capital flows (KA1) are the dependent variable. The inflation rate dropped to its lowest level in June 1999, only to rise again later due to the introduction of VAT and international price shocks.10 Another factor that explains the level of domestic interest rates is the relatively high spread between lending and borrowing rates of the banking system. Another factor that should be reflected in interest rates is the monetary policy of the BOS and the degree of commitment to its monetary target.
Some of the reasons lie in the indexation of financial contracts and the way in which BOS's monetary instruments are positioned and function. 10 Regarding the behavior of the price formation mechanism underlying interest rate indexation, empirical analyzes suggest that money supply growth and changes in the SIT/DEM exchange rate have a large impact on prices.
M ONETARY POLICY FRAMEWORK AND BOS’ S POLICY RESPONSE TO FOREIGN EXCHANGE INFLOWS
11 The BOS also intervenes in the foreign exchange market to bring about the depreciation of the exchange rate. Ultimately, meeting the higher demand for money would not have resulted in higher inflation or additional appreciation of the real exchange rate. The exchange rate is the other policy variable to look at to understand BOS intervention during periods of relatively high foreign exchange inflows.
The downward rigidity of the nominal exchange rate can be explained by the BOS's objective of maintaining the external competitiveness of the economy, and the upward rigidity by the objective of price stability. The BOS intervention was successful in reducing the rate of depreciation of the nominal exchange rate. In 1996, capital inflows continued despite policy efforts (the imposition of controls in 1995) and this was reflected in the downward rigidity of the exchange rate.
13 When discussing the objectives of the BOS, Bohnec and Bradeško (1977) indicate that the BOS has been making efforts to depreciate the exchange rate since 1992. The stability of the nominal exchange rate due to foreign exchange inflows also had a negative impact on the real exchange rate (real effective exchange rate (REER)). Moreover, the tightening of monetary policy appears to have contributed to the slight appreciation of the real exchange rate in 1998 (Table 11).
An additional picture of exchange rate behavior during periods of relatively high inflows can be obtained by looking at the trading volume on the foreign exchange market (banks and exchange offices) and the behavior of the exchange rate on that market. To get a full picture of the impact of foreign exchange inflows and policy responses on REER behavior it is also necessary to look at the relationship between the nominal exchange rate and inflation.
A PPROACHES TO MANAGING CAPITAL INFLOWS
As mentioned earlier, conditions in the economy and in the financial market changed in 1995, which reversed the appreciation trend of the REER. The fact that the exchange rate continued to depreciate at a lower rate until 1998 and that the REER remained at the 1995 level indicates that the BOS gave great importance to the external competitiveness of the economy (Figure 11). The lower average nominal depreciation of the exchange rate in 1997-1998 was in turn consistent with a gradual reduction in inflation which on an annual basis reached its historical lowest level in 1999 before the VAT introduction and international oil price shock.
A critical dimension of the overall responses to foreign exchange inflows has been the minimization of the costs of implementing countervailing policies. This goal, which may be common to all central bankers, was pursued in the case of Slovenia with rather complex and cumbersome instruments that most central banks do not normally use (box 1). The problem with such an approach was that interest rate signals in the economy are blurred and to some extent contradictory.
Moreover, the variety of instruments in the implementation of sterilization and the way they are positioned has inhibited the development of the interbank market. 19.
Sterilization Policy
Intensity and Cost of Sterilization
Thus, if we look in historical perspective and in relative terms (e.g. as a share of GDP), the highest sterilization effort (SIT 47.7 billion) appears to have occurred in 1994. In particular, Figure 12 shows that the degree of monetization in Slovenia (M3 as a percentage of GDP) was lower than in other transition and relatively low-income countries in Europe. 21 The optimal rate of reserve accumulation depends on the prospects of a reversal of underlying capital inflows.
The objective of maintaining the external competitiveness of the economy (ie real exchange rate stability) was achieved, but the inflation objective to a much lesser extent. The sterilization policy did not address the root of the problem; the positive interest rate differential. The awareness of the costs associated with the sterilization policy and its limited power also explains why the BOS resorted to cumbersome instruments without clear information on interest rates.
The limited effectiveness of sterilization and the high sterilization costs in 1994 explain why the BOS decided to introduce capital controls as early as February 1995.22 Until 1996, sterilization costs were mainly related to the issuance of FC notes due to their relatively lower costs than those of Tolar notes and their lower potential effect on monetary base creation due to interest payments. To make the FC notes extra attractive to banks, the BOS decided to provide credits in tolars (collateralised credit) to the banks that presented FC notes.
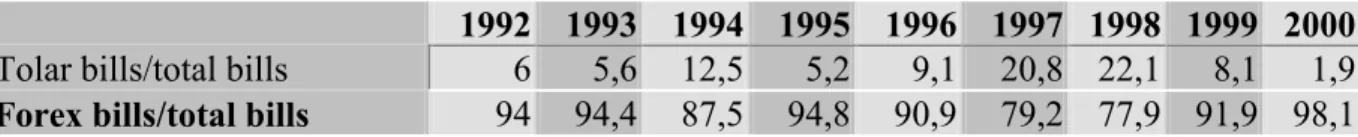
In particular, since 1997, sterilization has been carried out through tolar bills, the outstanding amount of which is significantly lower than foreign currency bills, but their relative cost is higher (Table 15). Share of tolar and foreign currency bills in the total amount of bills at the end of the year.
Capital Controls
A LTERNATIVE P OLICY
Alternative monetary policy should be discussed in the context of the conflicting policy objectives of the BOS (reducing inflation by controlling the money supply and maintaining relative stability of the real exchange rate) and their effect on discouraging further capital inflows. BOS has also maintained the relative stability of REER as an implicit target over the years. Another strategy would be to adopt a relative appreciation of the nominal exchange rate in 1994, the year when BOS carried out the most expensive sterilization.
However, this appreciation was already occurring due to the price stabilization process at the time (ie the rate of depreciation of the nominal exchange rate was lower than the rate of inflation). The advantage of the alternative approach would be that it would result in a sharper reduction in the inflation rate. Due to the aforementioned alternative strategy, a lower inflation rate would have been reached earlier in 1994-1995.
On the other hand, lower inflation would have reduced the inflation indexing component of interest rates (TOM) and contributed to an early closing of the positive interest rate differential, which is one of the main determinants of flows capital inflows to Slovenia. Also, an exchange rate appreciation may have had a positive effect on slowing wage indexation, which is fueling inflationary inertia. Theoretically, another alternative in dealing with capital inflows (ie mostly loans from abroad) would have been to induce a higher exchange rate depreciation to close the uncovered interest gap between domestic interest rates and to the international one, which in
As the article explains, the relative rigidity of the exchange rate is explained by the dual-objective policy. The rigidity of the exchange rate combined with a positive interest rate differential created the conditions for perpetuating capital inflows.