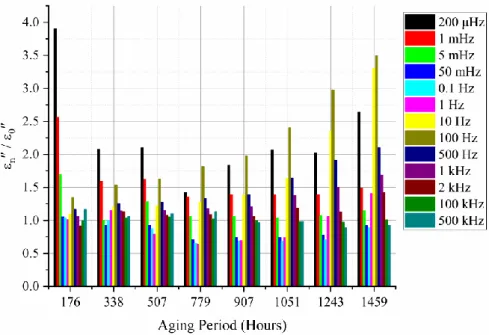
66 Figure 6.2: Change of imaginary part of permittivity against aging period for T-M aged NPP cables. 82 Figure 6.20: Change of imaginary part of permittivity versus aging period for T-M aged PV cables.
Introduction
- Background
- Motivation
- Research Aim
- Condition Monitoring Techniques
- Dielectric Spectroscopy
- Extended Voltage Response (EVR)
- Polarization-Depolarization Current (PDC)
- Indenter Testing
- Thesis Outline
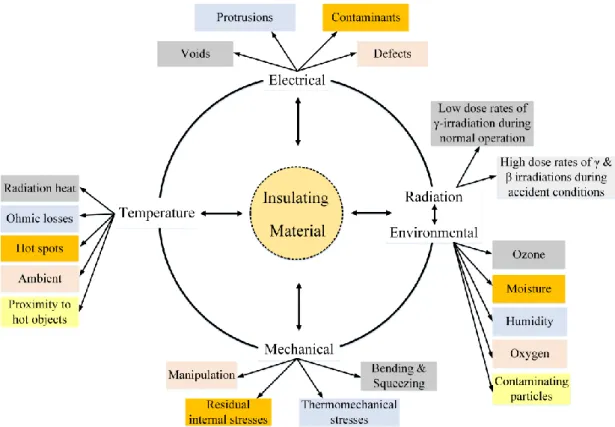
Due to the difference in the cooling rate of the outer and inner layers of the insulation, i.e., the outer layers have a higher cooling rate than the inner ones, they harden first, producing stress in the inner layers [36]. In this paper, the EVR method is applied to evaluate the degradation of cable samples under two different stresses, thermal and radiation.
Experimental Work
- Introduction
- Materials
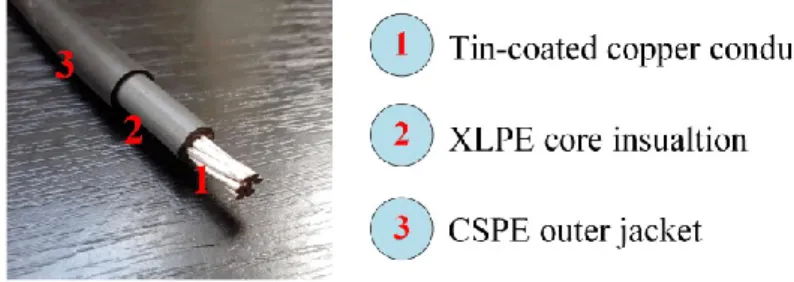
- Nuclear Power Cable
- PV Cable
- Samples Preparation
- Accelerated Aging Tests
- Simultaneous Thermal-Mechanical Aging of NPP Cables
- Simultaneous Radiation-Mechanical Aging of NPP Cables
- Simultaneous Thermal-Mechanical Aging of PV Cables
- Dielectric Spectroscopy
- General Aspects
- Frequency Domain Spectroscopy
- Time Domain Spectroscopy
- Shore D Hardness
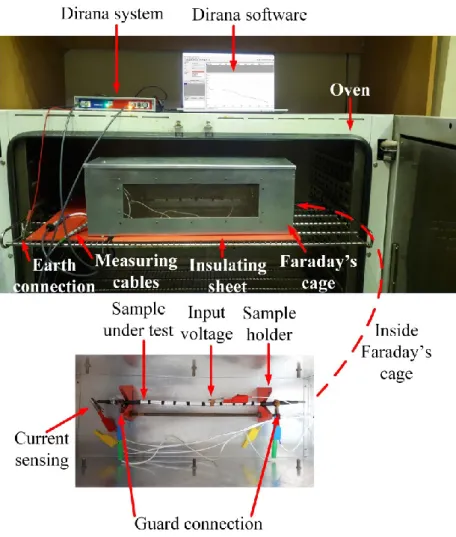
The experimental setup of the extended voltage response method as a time domain spectroscopy technique is shown in Figure 2.10. In this research, a hardness tester type HPE II (Bareiss Prüfgerätebau GmbH, Oberdischingen, Germany) was used, Figure 2.12.
Results of NPP Cables Under Simultaneous Thermal-Mechanical Aging
Introduction
Experimental Results
- Dielectric Spectroscopy with Frequency Swapping
- Extended Voltage Response
- Polarization/Depolarization Current
- Shore D Hardness
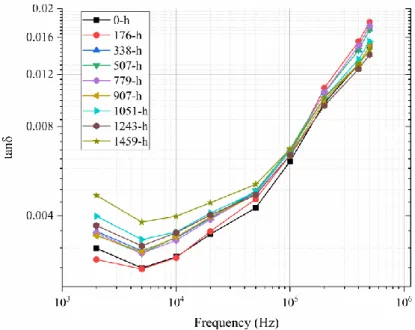
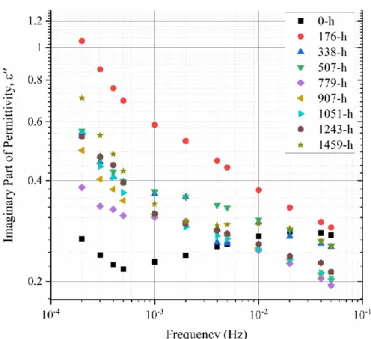
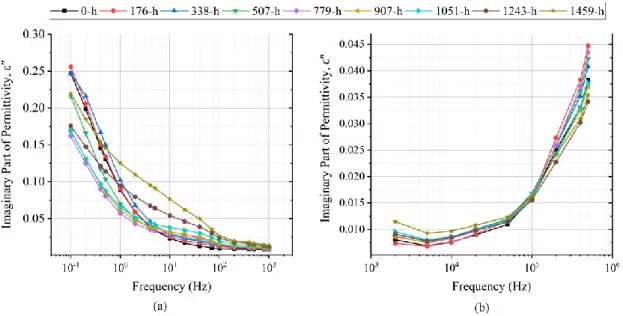
For the 0.1 Hz-1 kHz frequency range, the imaginary dielectric constant slightly increased after the first two aging cycles. In contrast, after the second cycle, it increased at all frequencies except 0.1 Hz.
Comparison Between Thermal and T-M Aging
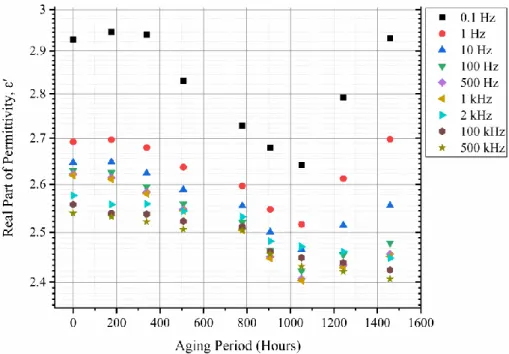
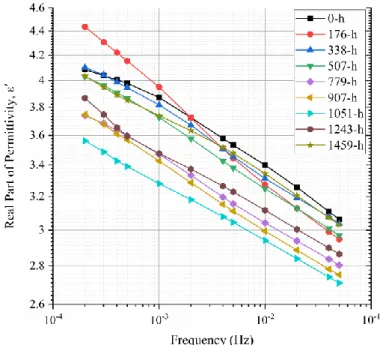
The results of measuring 𝜀′ versus frequency for each aging period at selected frequencies are shown in Figure 3.18. After the last aging period, it increased, at 10 mHz, the 𝜀′ value even exceeded the unaged value. In contrast, different behavior was obtained at 10 mHz, where 𝜀′ dropped after the first aging cycle.
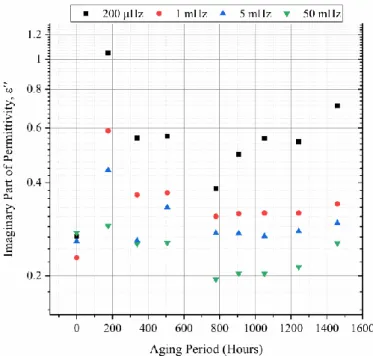
An increase in the 𝜀′′ values was observed only after the first two aging cycles at 200 µHz and 1 mHz, which then decreased with more aging but at 10 mHz. While the T-M stress caused an increase in 𝜀′′ after the first aging cycle at 1 mHz and 10 mHz, it decreased with aging, Figure 3.19 (b). In the case of the T-M voltage, Figure 3.20 (b), the polarization peak did not change its position after the first aging period.

Results of NPP Cables Under Simultaneous Radiation-Mechanical Aging
Introduction
Experimental Results
- Dielectric Spectroscopy with Frequency Swapping
- Extended Voltage Response
- Polarization/Depolarization Current
- Shore D Hardness
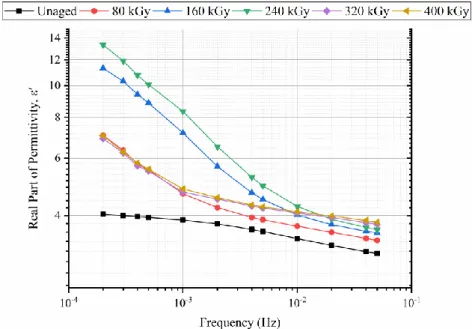
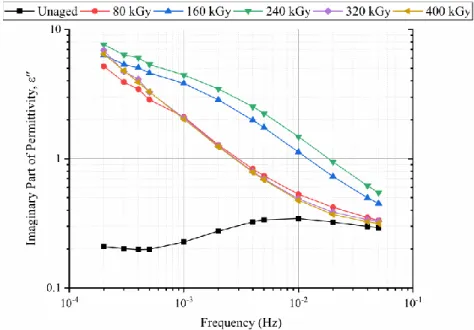
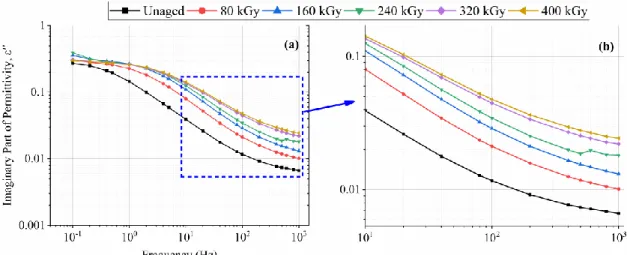
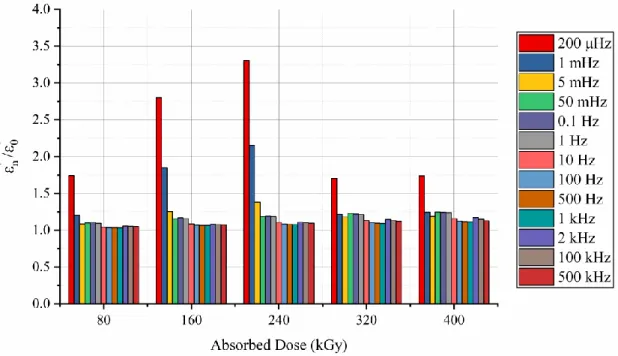
The imaginary part of the permittivity trend over the frequency range 0.1 Hz-1 kHz is shown in Figure 4.2 (a). As a result of the first three aging cycles, the imaginary part of the permittivity increased with increasing radiation dose. The profile of the real and imaginary parts of the permittivity in the bandwidth 200 µHz-50 mHz is visualized by choosing the reference frequencies of 200 µHz, 1 mHz, 10 mHz and 50 mHz, as shown in Figure 4.10 and Figure 41.
At frequencies 200 µHz and 1 mHz, the true dielectric constant increased sharply after the first three aging cycles compared to 10 mHz and 50 mHz, yielding a small increase, Figure 4.10. The imaginary permittivity increased after the first three aging cycles at the selected reference frequencies, especially at 200 µHz and 1 mHz. The last two aging cycles caused the imaginary permittivity to decrease at all selected frequencies, Figure 4.11.
Results of PV Cables Under Simultaneous Thermal-Mechanical Aging
Introduction
Experimental Results
- Dielectric Spectroscopy with Frequency Swapping
- Extended Voltage Response
- Polarization/Depolarization Current
- Shore D Hardness
Discussion
NPP Cables and Thermal-Mechanical Aging
The change in effective permeability was more pronounced in the very low frequency range compared to the low, medium and high frequency ranges. The change in imaginary permeability was constant after the second and third cycles, but it decreased due to the fourth cycle. The reduction of the real and imaginary parts of the dielectric permittivity and the reduction of the reverse voltage slope after 1 second, Figure 6.4 for the first six aging cycles, indicate a reduction
To illuminate the behavior of the dielectric parameters, relationships were established between the dielectric response (𝜀′, 𝜀′′), the decay and return voltage slopes (Sd, Sr), and the mechanical properties (Shore D hardness). The real part of permittivity at 10 Hz and the initial slope of return voltage decreased in the initial stages of thermomechanical aging, then both parameters increased, indicating the serious damage of the insulation. The behavior of the initial slope of breakdown voltage and the imaginary part of permittivity at 10 Hz correlates strongly with the Shore D hardness data.
NPP Cables and Radiation-Mechanical Aging
Combining the very low, low and medium frequency ranges, the real and imaginary parts of the permittivity are shown in Figure 6.13 and Figure 6.14. As illustrated in Figure 6.14, the polarization peak was observed at 0.01 Hz for the unaged case. As a result, the insulation conductance shifts up, which agrees with the trend of the slope of the decay voltage, Figure 4.6, and the increase of the conduction current, as illustrated in Figure 6.16.
Radiation-mechanical aging resulted in an increase in the insulation hardness of the cable, as shown in Figure 4.13. However, strong differences were obtained at other frequencies, but the actual permeability at 1 Hz and the imaginary permeability at 1 kHz presented a strong correlation with the Shore D hardness results, as shown in Figure 6.17. In addition, the slopes of the reverse and breakdown voltages were in good agreement with the hardness, as shown in Figure 6.18.
PV Cables and Thermal-Mechanical Aging
As shown in Figure 6-19, the real dielectric constant change was more prominent in the low frequency range compared to the very low, medium, and high frequency ranges. The trendline of the IPCF, Figure 6.26(b), shows the shift of the polarization peaks towards the lower frequencies. The behavior of the CIP is very similar to the behavior of the decay voltage ramp, as shown in Figure 6.27.
For greater clarification and as a function of aging period, Figure 6.28 shows the correlation between Sd and 𝜀′′ at 1 Hz. Similarly, the correlation of EVR results (Sd and Sr after 1 second discharge) and Shore D hardness is presented in Figure 6.30. The non-monotonic trend of the real part of the permeability at 0.1 Hz and the imaginary part of the permeability at 1 Hz is in agreement with the Shore D; hardness measurements.

Summary and Future Work
The Novelty of the Dissertation
- Thesis I
- Thesis II
- Thesis III
- Thesis IV
The central frequency of the imaginary part of permittivity of thermomechanically aged samples was higher than that of thermally aged samples by 0.5 mHz;. The real part of permittivity at 10 Hz and the initial slope of return voltage dropped in the initial stages of thermal-mechanical aging, then both parameters increased, indicating the serious damage of the insulation;. The real part of permittivity and the return voltage slope showed a downward trend after the first six aging cycles, which can be attributed to the cross-linking of the XLPE &.
Also, the monotonic increase in the imaginary permittivity at 1 kHz reflects the intensity of the dipolar polarization and the decrease in the insulation resistance. This is also consistent with the increasing slope of the voltage drop associated with insulation conductivity. In contrast to real transmittance, the change in imaginary transmittance was more noticeable between 200 µHz and 1 kHz.
Directions of Further Work
Bulzaga, "Aging Investigation of Low-Voltage Cable Insulation Used in Nuclear Power Plants," in 2018 IEEE Electrical Insulation Conference, EIC 2018, Okt. Zak, "Electrical condition monitoring techniques for low-voltage cables used in nuclear power plants," in 2013 IEEE Electric Insulation Conference, EIC 2013 IEPEEn. struktiewe toestandmoniteringtegnieke op bestraalde laespanning-onafskermde kernkragkabels,” IEEE Access, vol.
Linde, “Aging Study of Low Voltage Cable Insulation Used in Nuclear Power Plants,” in Annual Report - Conference on Electrical Insulation and Dielectric Phenomena, CEIDP, 2012, pp. Anandakumaran, "Aging and condition monitoring studies of composite insulation cables used in nuclear power plants", IEEE Trans. Á., "Application of Nondestructive Condition Monitoring Techniques to Exposed Low Voltage Unshielded Core Power Cables", IEEE Access, vol.
![Figure A.1: Prevalent conductor insulation and jacket polymeric materials inside the containments of United States NPPs [133]](https://thumb-eu.123doks.com/thumbv2/9dokorg/2497363.294250/131.892.199.712.538.914/figure-prevalent-conductor-insulation-polymeric-materials-containments-united.webp)
Polarization/Depolarization Current
The depolarization current is of opposite polarity and includes only the current due to the polarization processes. If the dielectric material were sufficiently charged to complete all the polarization processes, the term 𝑓(𝑡 + 𝑡𝑐ℎ) can be ignored and the DC conductivity (σ) can be easily calculated from the difference between the polarization and depolarization currents.
Extended Voltage Response
The breakdown voltage slope is related to the insulation conductivity ( ), while the return voltage slope is related to the polarization conductivity.
Insulation Resistance
The IR test is the simplest and most widely used technique to evaluate the insulation quality of cables. The IR test is performed at specific test voltages to validate the properties of the cable insulation. Typically, the IR measurement is performed by applying a voltage lower than the maximum rated cable voltage between the conductor or cable shield (if present) and a ground plane in contact with the cable.
However, IR values have been reported to be strongly dependent on temperature and relative humidity. Together with other techniques such as EVR, the IR test has been used to monitor the degradation of thermally and irradiated aged EPR I&C NPP cables [88]. The IR-time function at a sampling frequency of 1 second is highly recommended, as the IR-time curves provide more information about insulating dielectric processes [55].
Reflectometry Methods
As an acceptance criterion, the cable IR must meet the cable's technical specifications or meet the respective design values. In [136], the authors detected the water tree degradation in a polymer-insulated MV cable using the TDR technique. However, TDR can identify the presence and location of faults within the cable length.
On the other hand, it cannot distinguish whether the defects are in the cable conductors or the polymeric insulation [60]. However, the FDR method uses a swept frequency signal to pass through the cable circuit and analyzes the reflected changes [58]. Experiments performed by LIRA showed that the thermal degradation of the cable insulation and the mechanical defects/damages in sheath materials and/or polymeric insulation play a role on the insulation capacity and, to a lesser extent, on the conductor inductance.
![Figure C.4: Typical TDR trace [55].](https://thumb-eu.123doks.com/thumbv2/9dokorg/2497363.294250/141.892.273.648.645.913/figure-c-typical-tdr-trace.webp)
Dielectric Spectroscopy
Significant relaxation times are related to the delayed polarization processes, while low relaxation times are associated with the instantaneous polarization processes. The dipole contribution is added to the total polarization at a field frequency below the relaxation frequency. The α-relaxation is related to the motion of the polymer backbone, while the β-relaxation is associated with the motion of the molecular side groups.
Other relaxation processes such as γ and δ are related to the lower “higher frequency” relaxation periods of the other side groups. Permanent dipoles are related to the separation of charges that takes place across the subgroups of the polymer backbone and/or side groups. The dipole contribution to the dielectric constant of the polymer depends on the ability of the dipole to rotate and align itself with the direction of the applied electric field.
![Figure C.6: Frequency dependence of permittivity at different polarization processes [180]](https://thumb-eu.123doks.com/thumbv2/9dokorg/2497363.294250/144.892.238.633.843.1117/figure-c-frequency-dependence-permittivity-different-polarization-processes.webp)
Dielectric Dissipation Factor (DDF)
Impedance Spectroscopy