In Chapter 3, the effect of scalar flux weighting of the linear anisotropic scattering matrices is discussed in the frame of SP3 and S12 calculations. In Chapter 4, the effect of the angular and spatial discretization on the results of perturbation theory calculations is investigated using the SEnTRi code.
Modeling the neutron transport
- Multigroup approximation
- Spherical harmonics expansion
- Diffusion theory
- Discrete ordinate form
If the total cross-section and the scattering matrices are weighted by the angle-dependent flux, the resulting cross-section will also be angle-dependent and will take the form of Eq. 2.10). In many cases the angular dependence of the neutron flux is not important and the neutron diffusion equation Eq.2.20 can be used.
Perturbation theory calculations
The Linear Perturbation Theory
F operator represents the splitting term, and D represents all the other parts of the transport equation.
Kinetic parameters
It can be observed that the numerator of the equation has the form of the ∆T1, but the macroscopic diameter is replaced by 1/vg,z the neutron velocity. The additional weighted integration for the effective delayed neutron fraction for the precursor families will take the form of Eq.
Sensitivity and Uncertainty calculations
2.52, ρC+ corresponds to the reactivity of the calculation where the system parameter is increased and ρC− where it is decreased. 2.61, however, the error calculation was modified to take into account the variance of the effective multiplication factor.
Solution of the time dependent
Point kinetic solution
If the shape change of the perturbed flux during the transient is relevant, which greatly affects the parameters, the result will be inaccurate. During the solution of the equations, small time steps are needed in the calculation scheme due to the stiffness of the numerical problem.
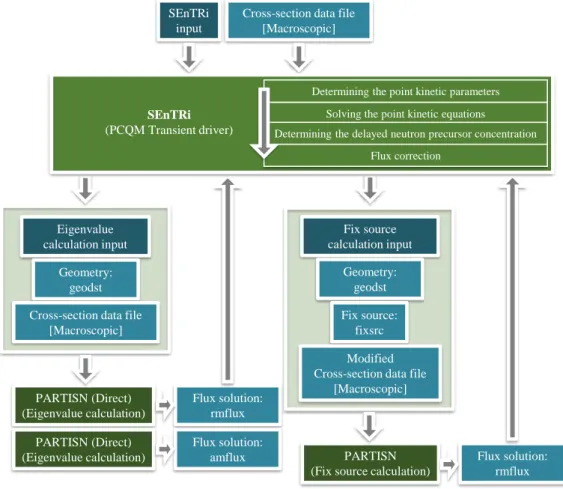
Direct solution
2.38 and 2.48 are used in Eqs., and T (t) represents the neutron density (or amplitude) as a function of time. Therefore, a time-dependent solution can be obtained from a sequence of time-independent fixed-source problems where the angular flux, fission source, and delayed neutron concentration from the previous time step appear in the external source of the next time step.
Factorization approaches
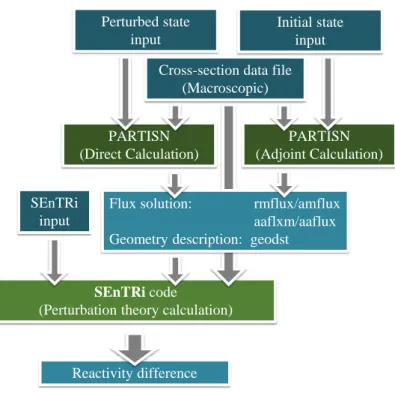
Transport codes such as PARTISN necessitate predetermined group constants, and higher-order anisotropic scattering matrices can also be considered. SPNDYN also requires predefined group constants and the higher-order anisotropic scattering matrices can similarly be taken into account during the calculation.
Effects of the anisotropic scattering
Calculations for a VVER-440 benchmark
In this case, the information about linearly anisotropic scattering between energy groups is lost and the Σ1s matrix will be diagonal. Using the linearly anisotropic scattering matrices thus obtained for the SPNDYN CGFEM SP3 and PARTISN S12 calculations, the distortion of the power distributions disappears, as shown in Fig. 3b.
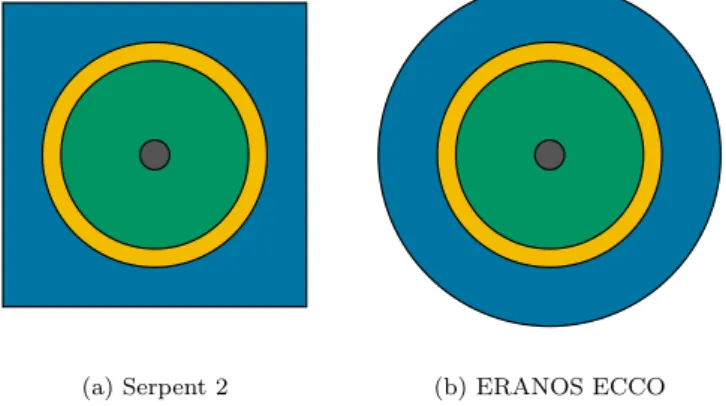
Simple core calculations
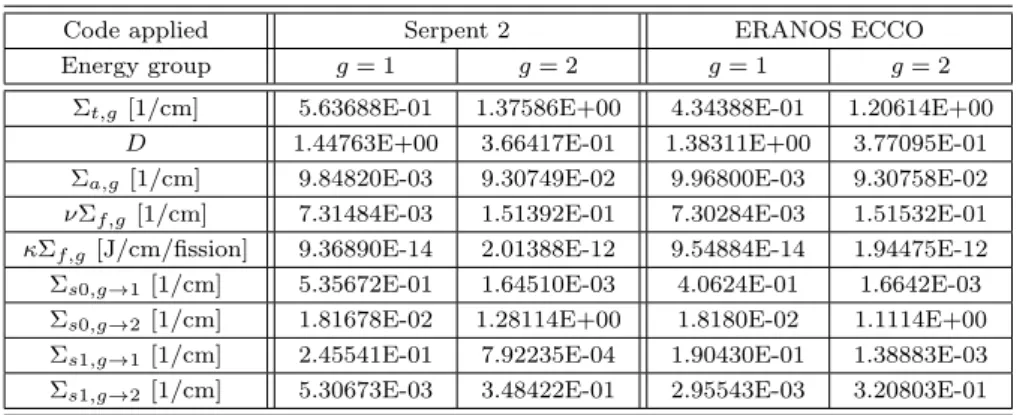
However, the deviation between the Serpent 2 and ECCO group constants is larger in the case of linearly anisotropic scattering matrix terms. In the case of SP3 and S12 calculations, direct use of the linearly anisotropic scattering matrix and the scattering matrix derived according to Eq. The larger deviations obtained in the case of the small size core calculations are attributed to the constant generation of the infinite grid pin group.
Implementation in the SEnTRi code
Calculation results
Investigations in Cartesian geometry
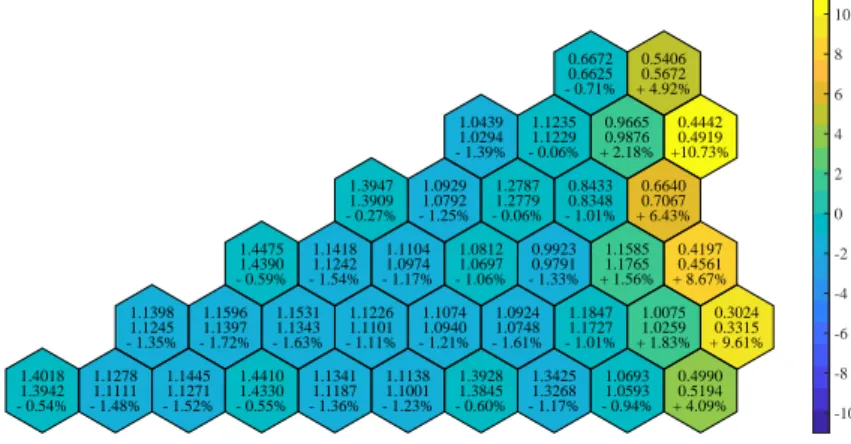
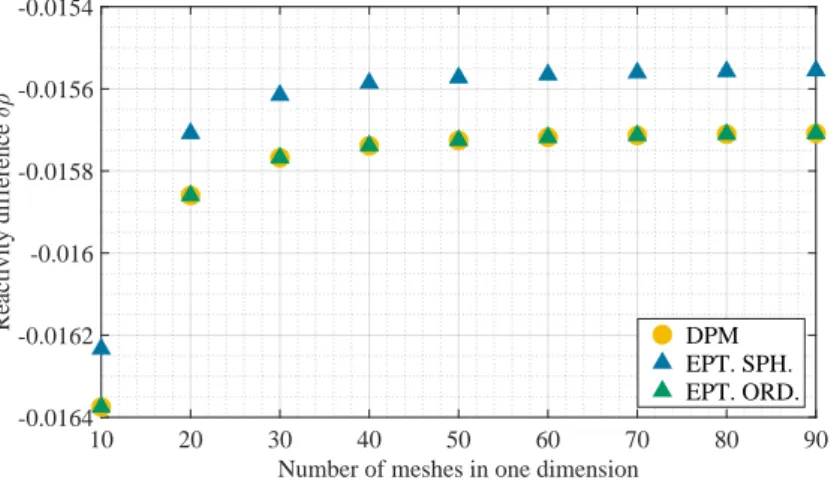
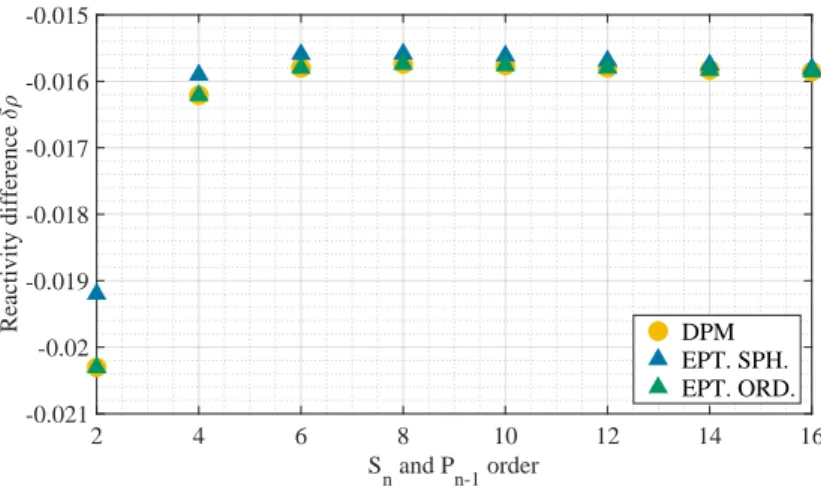
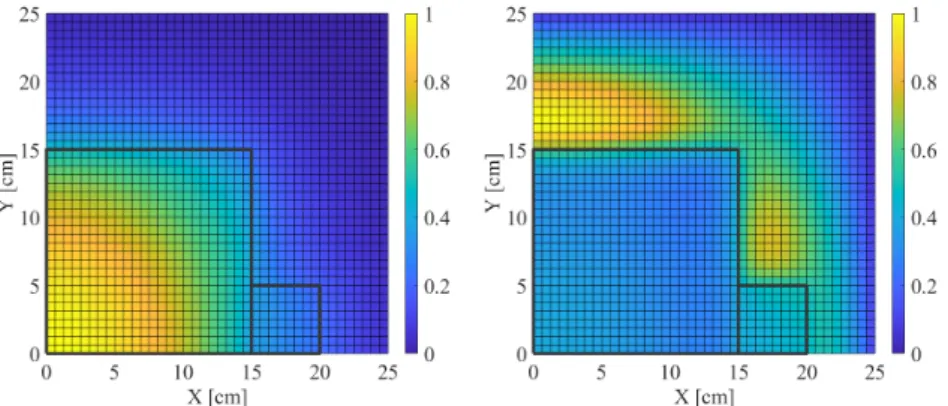
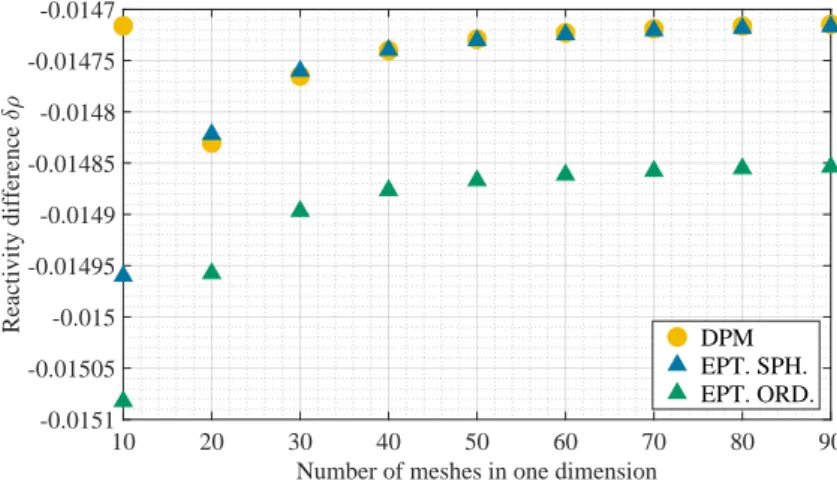
In the series of images, the effect of the control rod material insertion is evident, especially in the distribution of the direct thermal flux. A mesh dependence test, in which the mesh density was increased in each dimension, was performed with the S8 approximation and the P7 expansion, and the reactivity differences from the different types of perturbation theory calculations can be seen and compared in Fig. analysis, the number of angular divisions with the ordinates and the spherical harmonic expansion were increased at each step, and the control rod reactivity value was determined by the three types of perturbation theory calculations.
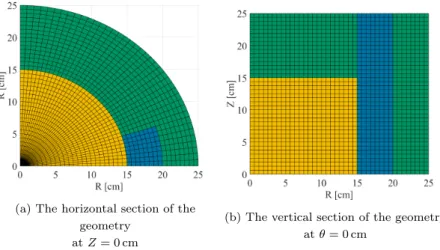
Investigations in curvilinear geometry
By using the cylindrical coordinate system, neither of the two types of exact perturbation calculations matched the results of the direct method. In curvilinear geometries, none of the exact perturbation theory calculations gave an exact match, and calculations with spherical harmonics appear to be closer to the results from the direct method. 4.9, which again shows that none of the exact perturbation calculations agree with the direct method and with each other.
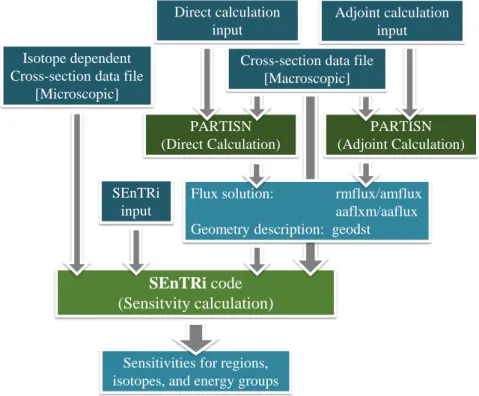
The applied codes
Serpent Monte Carlo code
Since the scope of the research extends to transient simulations, a deeper understanding of the physical processes behind the feedback became necessary [61].
The TSUNAMI sequence of SCALE
CODES APPLIED to describe the flux anisotropy have a significant effect on both the accuracy of the calculations and the computational effort. The latest implementation of the SCALE code system is capable of evaluating angular fluxes in the three-dimensional multigroup (MG) KENO Monte Carlo code. Additionally, an IFP-based method is also applied to TSUNAMI continuum energy calculations, however, only the results of TSUNAMI-MG calculations are presented here.
Sensitivity and Uncertainty capabilities
The error calculations for the sensitivity coefficient in the SEnTRi code are based on Gaussian error propagation. In all cases the inner products in the additions of the numerators or the denominator in Eq. 5.4, a general product, where P rodi∗,x,g,g0,z,j contains all cross-sectional and volume data. During calculations with the fluxes calculated by the PARTISN code, the flux convergence criteria are chosen for the relative error, which is an overestimate in most geometric regions.
Calculations for the COMET critical assembly
Overview of the applied approximations
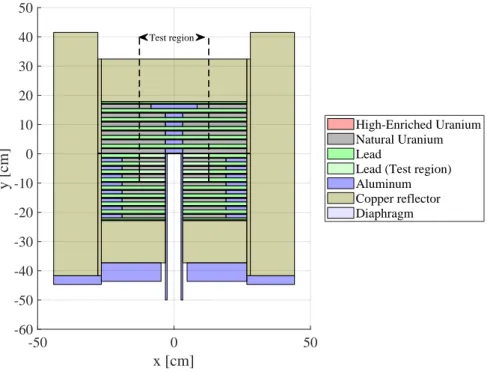
CALCULATIONS FOR CRITICAL ASSEMBLY OF THE COMET AND VALIDATION OF USED METHODS Lead plates were removed from the center, namely two (2V), three (3V) and four (4V). On the other hand, creating the model for the PARTISN code required some homogenization of the geometry and the lead plates sandwiched between two aluminum plates were blended together. Sensitivity coefficients were calculated in the SCALE 252 group structure with all three codes, and uncertainty analysis was performed using the same structure with SCALE and PARTISN codes.
Sensitivity calculations for the Comet Critical Assembly
The SCALE and the SEnTRi code provide the possibility to perform the sensitivity calculations with a higher order expansion of the angular flux. With the increasing order of expansion, the accuracy of the calculations made by the two codes improves significantly. The cause of the perceived discrepancies was investigated and it was found that the effect of higher order terms mainly contributes to the elastic scattering sensitivity coefficients.
Uncertainty calculations
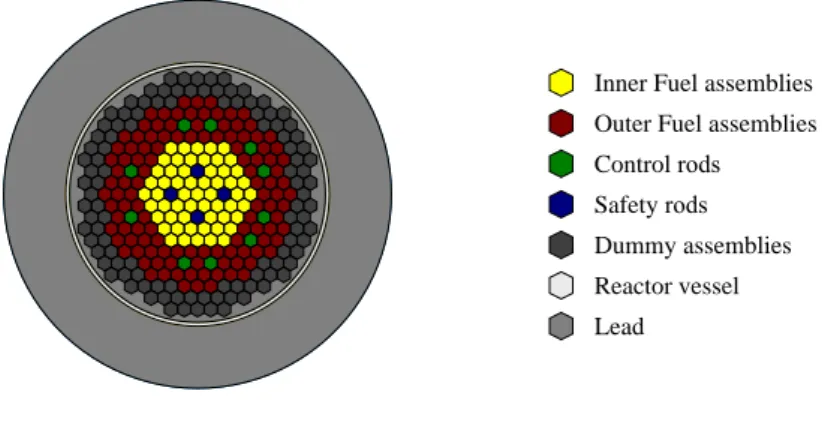
Calculations for the ALFRED reactor
Approximations and model description
The main objective of the research was to determine the three reactivity feedback coefficients for the ALFRED reactor and the uncertainty derived from nuclear data using different codes and methods. The cladding expansion coefficient gives the sensitivity keff to the cladding radius due to temperature change, and the Doppler coefficient gives the sensitivity keff to the fuel temperature. For the Doppler coefficient, resonance-corrected αTD cross sections were calculated using the CSASI module of the SCALE code package for a 200 °C elevated temperature to perform the LPT calculations, and the fuel temperature was increased accordingly for the DPM calculations.
Sensitivity calculations for the ALFRED reactor
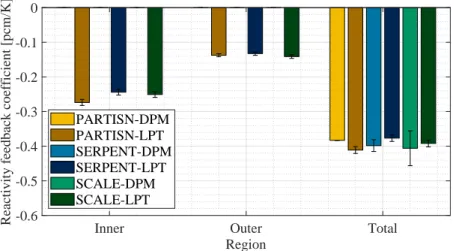
LPT calculations also show contributions from affected regions. In the case of the refrigerant temperature coefficient, large distortion (±20% vs. ∼2.4% in this work) was applied to obtain good statistics with the applied TSUNAMI. In the case of the cladding coefficient of expansion, ±20% perturbations were also applied, which is extremely large compared to the 1.44% applied in this work and assumes unrealistic temperature changes.
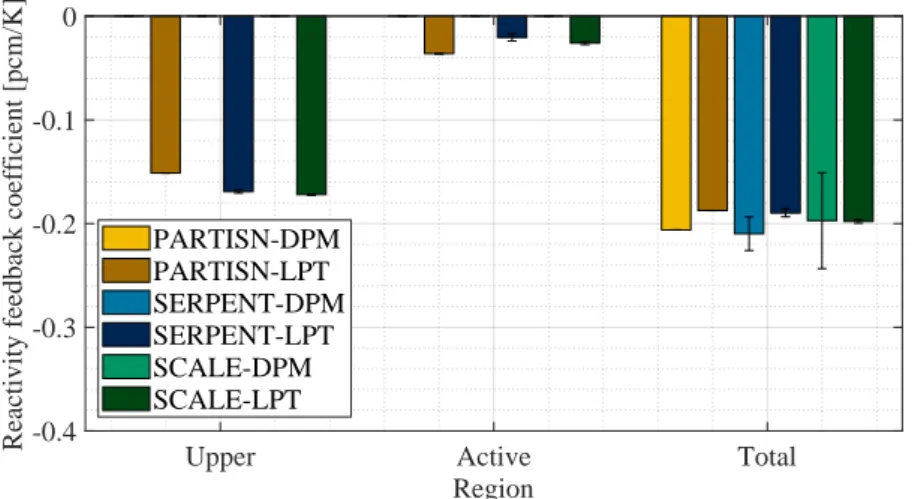
Uncertainty calculations for the ALFRED reactor
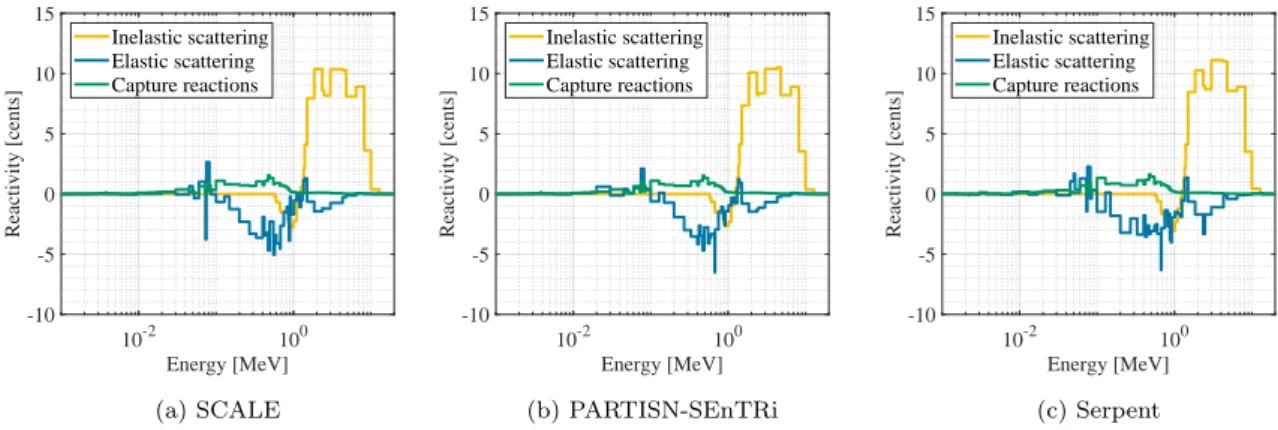
In the case of LPT calculations, the contributions of the affected regions are also presented. For the Doppler coefficient, the reactions of plutonium isotopes have a high contribution, followed mainly by the inelastic scattering of lead. However, in the case of the coefficient of expansion of the coating, the elastic distribution of lead and iron isotopes becomes more important.
Transient solvers implemented in SEnTRi
The direct transient solver
Predictor Corrector Quasistatic Method
The Point Kinetic solver was based on [81], treats differential equations exactly and uses piecewise constant approximations of the reactivity and the source. The flux is corrected with the amplitude and the delayed precursor concentration is then updated with Eq. After these, a new prediction step is performed and the cycle is repeated until the end of the transient.
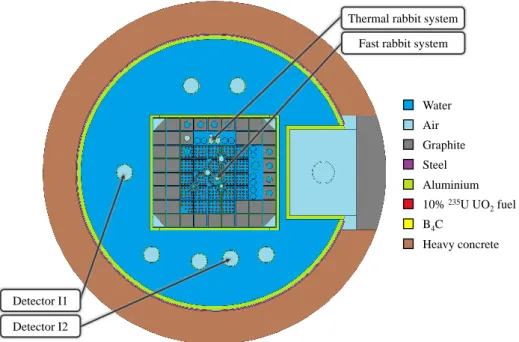
Calculations for the BME Training Reactor
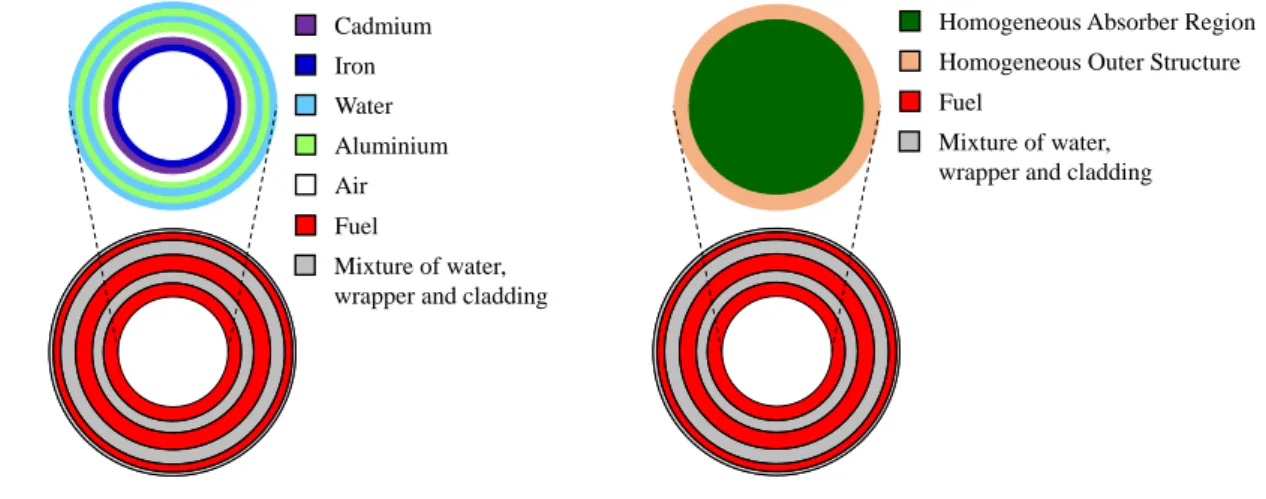
Description of the benchmark model
The bottom of the cadmium ring was 2 cm below the mid-plane of the core when inserted. CALCULATIONS FOR THE BME TRAINING REACTOR AND THE VALIDATION OF THE TRANSIENT DRIVER a few seconds before the absorber was removed and the reactor returned to a critical state at lower power than at the initial condition. The position refers to the vertical distance between the bottom of the ring and the center plane of the core.
The applied codes
DMC methodology proposed and developed in [85] and [86], with many of the techniques revised and modified to better suit the GPU architecture. GUARDYAN's input logic is similar to the logic followed by production level codes, such as MCNP [87], Serpent [36] or OpenMC [88], and the geometric model of the reactor closely followed the described benchmark. For that reason, the automatic control bar of the BME TR had to be adjusted 3 cm higher than indicated in the benchmark description.
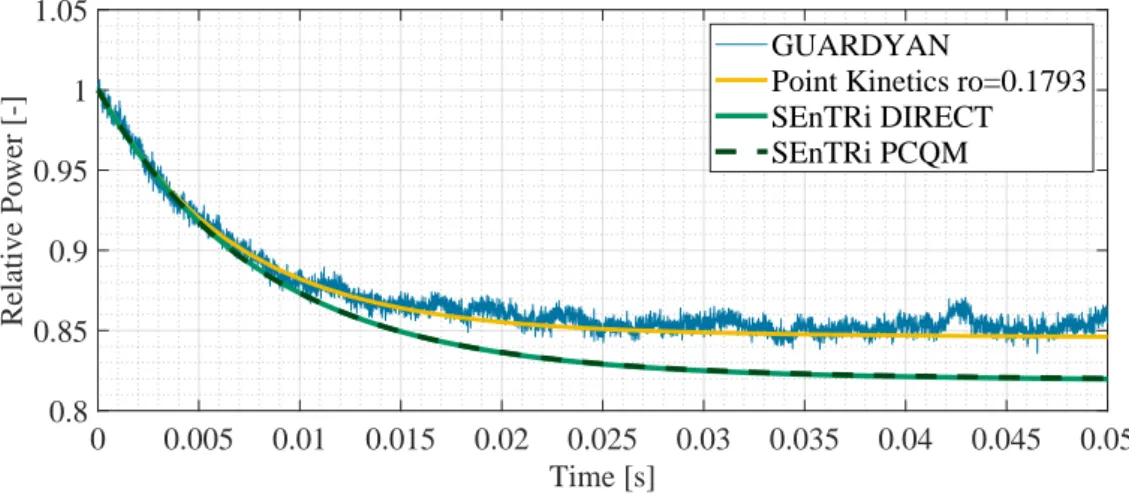
Calculation results
This discrepancy can be attributed to the uncertainties regarding the movement of the rabbit and the approximations of the measure. In the above experiments, the point kinetics can give an almost perfect estimate for the time dependence of the force. On the other hand, in the first part of the curves, a significant difference can be observed.
The ALLEGRO reactor concept
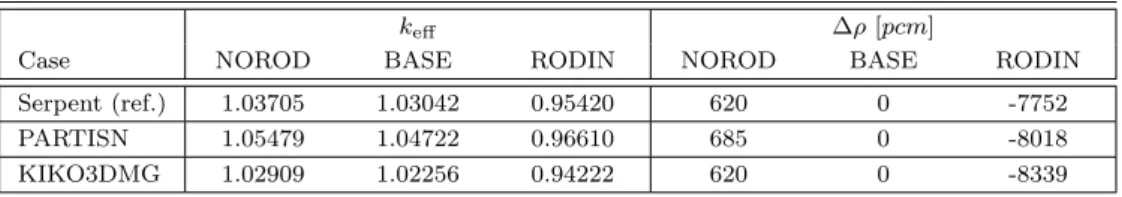
In order to investigate the effect of diffusion and transport approximation in the simulation of the mentioned transition, the investigation with SEnTRi and PARTISN codes was started in collaboration with the Center for Energy Research. Steady-state calculations were also performed with PARTISN, KIKO3DMG, and Serpent to investigate the effect of diffusion and transport approximations. During the selected unprotected transient over-power described in [76], one of the internal CSD control assemblies is withdrawn from the core by 12 cm in 12 s.
The PARTISN model
It is also assumed that SCRAM will not appear; therefore, the inserted reactivity of about 400 pcm will be compensated by negative core feedback coefficients. The simulation requires a 3D approximation, as the motion of the joystick causes a large variation of the flux solution in the core, and spatial effects become important.
Extension of the SEnTRi code
The coating density in the reference model changed only near the fuel elements;. however, during homogenization, a density change along the entire length of the coating was considered. Volume mixing was also implemented in the SEnTRi code to account for thermal expansion of the fuel.
Calculation results
The relative power distributions of the assembly at the beginning and end of the transition state are also compared in Fig. We also compare the reactivities of the system during the transient state with the relative powers. The KIKO3DMG/ATHLET 3.0 results (peak values) are compared to the SEn-TRI/PARTISN calculation (mean values).
Outlook
I developed the SEnTRi code to determine the sensitivity coefficients using the PARTISN discrete ordinate neutron transport code. Application of the virtual density theory in fast reactor analysis based on the neutron transport calculation”. An assessment of the applicability of multigroup cross sections generated with the Monte Carlo method for fast reactor analysis.