TRADE-OFFS AND SYNERGIES IN IMPLEMENTING THE SUSTAINABLE DEVELOPMENT GOALS
Master’s Thesis, Master of Science, Sustainable Entrepreneurship
University of Groningen, Campus Fryslân June 10, 2022
AYI ONIKOYI Student number: 4414101
Email: [email protected] Supervisor University: Dr. Ofer Engel
Co-Assessor: Dr. Emma Folmer Practical Supervisor: Zoe O’dwyer
Acknowledgement: helpful comments on this thesis draft were given by my colleagues at Deloitte, Zoe O’dwyer, and Bas van Rossum. I also want to thank Emma Folmer and Ofer Engel for their guidance, mainly in guiding me to systematically conduct scientific research that is clear, structured, and valuable.
TRADE-OFFS AND SYNERGIES IN IMPLEMENTING THE SUSTAINABLE DEVELOPMENT GOALS
Abstract
Since the launch of the SDG initiatives in 2015 by the United Nations, policymakers, scholars, and practitioners have become increasingly concerned about the implications of spillovers – Meaning that advancing one specific SDG indicator can come at the cost of another (trade-off) or a benefit (synergy). Despite this becoming a growing concern, little is known about the mechanisms that drive these spillovers between the multi-dimensional 17 goals. This thesis addresses the problem of spillovers in SDG using multivariate quantitative research, namely, Principal Component Analysis to summarize each goal and interaction in the SDG agenda. PCA allows mapping spillover effects at the level of goals for five SDGs while using all available information for the selected indicators between SDGs between 2011 – 2018. The most striking finding is that the share of renewable energy correlates negatively with indicators measuring the population's access to electricity, internet usage, and unemployment rate. In contrast, clean energy technology gave the complete opposite result. This result may imply that different forms of sustainable energy sources have significantly different results on SDG progress.
Keywords: Sustainable development goals, spillover effects, Africa, Multivariate analysis.
INTRODUCTION
In this thesis, I will focus on the issue of sub-Saharan African nations trailing behind when implementing the SDG. They face two issues - the complexity of SDGs and spillover effects. The SDGs are complex because it remains an empirical challenge to map the interaction between 17 goals consisting of 167 targets, and 232 indicators (Huan & Liang, 2019). Another issue is the spillover effects that hinder or promote SDG progress for the following reasons (Hegre, Petrova
& Uexkull, 2020). Firstly, spillover effects that hinder SDG are trade-offs, whereby advancing one SDG may come at the expense of another. Secondly, synergy promoting one SDG may facilitate the promotion of another. For example, a trade-off spillover is when bio-economy implementation is valuable for the environment but detrimental to the community because it has resulted in land grabbing, particularly in Nigeria (Ashukem, 2020). Ashukem (2020) argued that the mechanism that led to land-grabbing was the increasing demand for land and agricultural produce for food and energy purposes, where land is considered abundant, empty, and unused by multinationals and foreign investors. Conversely, synergy can reduce inequalities, such as gender inequalities, and increase basic health goals in Kenya (Niessen et al., 2018). Niessen et al. (2018) argued that by providing basic resources to ensure access to universal health, not only can gender inequalities be tackled but also inclusive healthcare benefits. In that way, I will present an analytical framework to identify potential spillover effects between SDG progress in sub-Saharan nations and show how to deal with the complexity of the SDGs. The UN Brundtland Commission (1987: 39) describes sustainable development as "development that meets the needs of the present without compromising the ability of future generations to meet their own needs." Sustainable development's fundamental principle is to focus on the future generations' social development,
environmental protection, and economic development (Brundtland Commission, 1987). The SDGs serve as a global framework developed by the Inter-Agency and Expert Group to address global sustainable development challenges mentioned in the UN (2015) Brundtland Commission report, such as poverty, inequality, climate change, and environmental degradation, peace, and justice.
The lack of proper understanding of the spillover effects of SDG has led to the following:
imbalance policy whereby policy initiative to best address an SDG hinders or unintentionally strengthens another and missed chance to benefit from positive spillover effects (Mainali, Luukkanen, Silveira & Kaivo-Oja; Sala, Ciuffo & Nijkamp, 2015). As a result, this research built a framework to analyze the spillover effects on SDG progress in African countries. Additionally, it has a practical contribution to the United Nations, policymakers, scholars, and practitioners, who partner up to work on collective goals and policies that support progress and understandhow to address adverse effects and strengthen positive effects.
Research Question
Many researchers have focused on SDG progress in developing countries without adequately considering the spillover effects and the multidimensionality of the goal (Horan, 2019; Leal Filho et al., 2022). Conducting research in understanding the spillover effects that hinder or promote a country’s SDG progress ensures that scientific knowledge is applied to national practice (Miola &
Schiltz, 2019). Scholars create information contributing to national practices through the systematic review of national progress toward the SDGs (Miola & Schiltz, 2019). This article aims to broaden the theory of sustainable development by asking the following question:
What spillover effects hinder and strengthen the progress of sustainable development goals in sub-Saharan countries between 2011 and 2018 while considering the multidimensionality of the goal?
FIGURE 1
Figure 1. Poverty rate in sub-Saharan Africa, though declining, is significantly higher than in other parts of the world, highlighting the importance of focusing on this region when tackling
poverty.
This research used the World Bank secondary dataset to test hypotheses based on country-level SDGs. I analyzed the data using a Principal Component Analysis (PCA) to conduct a multivariate quantitative analysis of 13 SDGs indicators. The UN Statistical Commission (2015) designed the 17 SDGs associated with multiple indicators. However, each indicator is associated with only one
0 5 10 15 20 25 30 35 40 45 50
2011 2012 2013 2014 2015 2016 2017 2018 2019
%
Year
The Proportion of Population Below International Poverty Line (%) 2011 – 2019
East Asia & Pacific Middle East & North Africa Sub-Saharan Africa World
SDG agreed upon by every UN’s member state. The PCA effectively summarizes prioritized goals in Africa and identifies synergy and trade-offs while using the available data on indicators (Jolliffe, 2002). PCA will evaluate data from 2011 to 2018 using the cases of sub-Saharan African countries.
Data from 2020 until 2021 is unavailable because more priority was given to the pandemic. To narrow the scope to African countries is because they have the highest number of people living in extreme poverty, with a mean daily income of less than $1.90 (Figure 1) (Worldbank, n.d.). This research also focuses on the highest proportion of population in the sub-Saharan region living in extreme poverty, and in not the Middle East & North Africa (Worldbank, n.d.). As shown in Figure 1, the poverty rate in sub-Saharan Africa declined from 40% in 2010 to 34% in 2019, yet the poverty rate is relatively high compared to the rest of the East Asia & Pacific and the rest of the world. Thus, this research explores SDG progress in sub-Saharan Africa within that time frame.
The objectives of this study are to use the UN framework in effectively analyzing SDGs, and to make inference about the spillover effects in different African countries. By understanding spillover mechanisms, I attempt to help policymakers target resources as underlying impediments to sustainable development and focus on indicators that measure SDG progress using additional data. Finally, it contributes to empirical research by offering a more objective analysis of the use of country-level SDGs (Huan & Liang, 2019).
The structure of this thesis is as follows. The next section presents a critical review of the most relevant literature on the growing interest in sustainable development and its association with African countries—the framework for analyzing the spillover effects with a clear hypothesis. Next, I present the PCA methodology used to answer the research question. The empirical results will be presented followed by a discussion of those results. Finally, the last section provides concluding remarks, limitations, and research directions.
THEORY
This section provides a critical review of the literature on spillover effects concerning SDG indicators that measures SDG progress to criticize the literature and highlight the gaps. The literature review aims to understand and communicate the relevant prior knowledge on SDG spillover, ensuring that the research is analyzed effectively and making inferences about the spillover of the SDGs. The structure of the literature review is as follows: (1) to critically review the spillover effects of SDGs and provide examples of synergies and trade-offs (2) to explain how synergy and trade-offs are measured through PCA (3) to identify SDGs indicators based on the available data and the UN priority and deduce a hypothesis about the relationships between them.
Notwithstanding, the spillover effect issue has been applied by Hegre et al. (2020) using a similar method employed in this literature by identifying synergy and trade-offs between SDGs indicators, measuring the changes over time, and summarizing global SDG indicators between 2011 - 2016. Other researchers predict SDG indicators results (Liu et al., 2018). This research takes a different approach by focusing on African countries and a different timeline (2011 - 2018) than previous research. It is beyond the scope of this research to predict indicators.
Sustainable Development Spillover Effects
In the 1920s, Arthur Pigou developed the spillover effects theory, otherwise known as the - externality theory (Vatn & Bromley, 1996). It refers to an indirect cost or benefit to a neutral third party that arises as an effect of another party’s activity (Vatn & Bromley, 1996). An externality is defined as unpriced goods involved in either consumer or producer market transactions. Although externalities theory is an economic theory, new researchers use it to evaluate the sustainable
development theoretical frame (Liu et al., 2018; Mainali et al., 2018; Truelove et al., 2014). These externalities are called spillover effects (Mainali et al., 2018). In that way, researchers consider synergies as positive externalities while trade-offs as negative externalities. There can also be no synergy between one SDG progress and another, called de-linking, meaning that there is no clear link between SDGs (Mainali et al., 2018). For example, there can be a synergy between access to electricity and access to clean water – meaning that the higher the number of people with access to water, the greater the number of people with clean water. Conversely, a trade-off could be that the higher the proportion of people's access to universal basic health care the lesser the number of people with access to renewable energy share (Mainali et al., 2018).
Gaps in the Literature of Spillover Effects
Identifying the spillover effects within SDGs has been addressed by various authors (Hegre et al., 2020; Spaiser, Ranganathan, Swain, & Sumpter, 2017). For example, Hegre et al. (2020) address these issues by taking a global approach. However, their perspective is limited due to the homogenous research approach they took. It is essential to analyze specific geographical areas to understand the extent to which various indicators are trade-offs or synergies, considering the heterogeneity issues (Crespo Cuaresma et al., 2018; Walzberg, Lonca, Hanes, Eberle, Carpenter
& Heath, 2021). In addition, a spillover effect is considered in the literature on international development as a spillover on one country’s SDGs actions and implications on the other (SDGindex, n.d.). Another way spillover can be assessed along various dimensions is through the environmental, social, and economic impacts (SDGindex, n.d.). Such studies typically focus on a particular sector, making them overly narrowed down. For example, a research review on the SDGs focused on countries with prominent agricultural and food sectors, such as Nigeria, Brazil,
and the Netherlands, to propose improvements for practical implementation in these countries (Gil et al., 2019). Another research focused on income poverty, providing a country-level assessment of poverty goals up to 2030 (Crespo Cuaresma et al., 2018; Omisore, 2018). The Global Burden of Disease (GBD) study estimated country-level SDG progress toward health-related goals for 2030 (James, 2018). Most studies measure generic progress by considering all African countries or a single country (Otekunrin et al., 2019 & 2021).
Methodology, conceptual and epistemology gaps
The extent to which spillover effects occur between different variables has been debated and analyzed (Liu et al., 2018; Mainali et al., 2018; Truelove et al., 2014). Most research uses a network analysis and conceptual framework qualitative research approach to identify and examine different spillover effects of the SDG's progress (Mainali et al., 2018). Broekx, Goethals & Landuyt et al.
(2016) quantify the spillover effects amongst various ecosystem services using statistical correlation coefficients. They used focus group interaction and individual semi-structured questionnaires for evaluating externalities. Mainali et al. (2018) focus on network analysis and the statistical coefficient method. Other research on spillover effects is qualitative, thus subjective.
Only a few simultaneously measure the inconsistency, multidimensional components, and spillover effects of the SDGs in a very objective manner (Hegres et al., 2020).
Contribution
Hegre et al. (2020) developed a quantitative analytical framework and an explorative approach to address spillover effects amongst indicators. This thesis develops an analytical framework using Hegre et al. (2020) to evaluate spillover effects in the African context. Firstly, African countries
plan to achieve the SDG in 2063 instead of the 2030 target because they lag behind. Secondly, SDGs do not take priority in Africa due to focus on extreme poverty. Lastly, Hegre et al. (2020) research used data between 2011 – 2018, and much has changed since 2016 as additional targets and indicators. The SDGs framework was designed in 2015. Thus, Hegre et al. (2020) analysis conducted using data between (2011 - 2016) is a year after the introduction of the SDG framework.
So, the robustness of the analytical framework is based on the condition that the result can be specific to the African context.
Weighting to Identify Synergy and Trade-off
The weighting process in SDGs indicators calculation is to assign coefficients to the index’s underlying variables to increase or decrease a variable’s importance on the composite measure (Greco et al., 2019: 96). Weighting methods are applied to determine the SDGs indicators and significant factors to analyze sustainable development indicators(Lemke, 2020). Weighting lead to compliance with the principles of synergies and trade-offs: addresses relationships, determines interconnection of goals, and assesses their unequal contributions to sustainable development (Costanza, Fioramonti & Kubiszewski, 2016; Janouˇskov´a et al., 2018). To further identify the potential influence of one indicator on another, these indicators are organized in terms of their correlations and information similarities (Lemke, 2020). Because SDGs have several indicators to measure them, a multivariate statistical technique such as Principal Component Analysis, is applicable for dimensional analysis (Lemke, 2020). Mathematically, the linear aspect of the PCA, shows potential synergy between two variables, say 𝑌𝑖 × 𝑌𝑗 . In terms of such variables are representations of the interaction between two products (Luukkanen, Vehmas & Kaivo-oja, 2021;
Kroll, Warchold, & Pradhan; Mainali et al., 2018). According to Mainali et al. (2018: 4) synergy
between two factors exists when their combined impact is greater than the sum of their individual effect. Mathematically, synergy can be expressed as:
𝑧 = 𝐴𝑥 + 𝐵𝑦 + 𝐶𝑥𝑦 + 𝐷.
Where x, y and z are variables and A, B, C and D are coefficients that determine the dependency of “z” on inputs x and y. The synergy among SDG indicators x and y is determined by the element
“Cxy”. Observing the change in these variables (x and y) between two points, lets say 𝑃 (𝑋0, 𝑌0) 𝑡𝑜 𝑄 (𝑋1, 𝑌1 ), in Figure 2 we can determine the change in the area (∆z) to be represented by:
∆z = A∆x + B∆y + C∆x∆y.
In the thesis, the analysis of synergy/trade-off indicates a potential causality. Researchers measure the potential synergy as the ratio of the area of the real change (∆x∆y) to the area of the maximum change (∆x∆𝑦1), where ∆x = ∆𝑦1. Hence, potential synergy/trade-off can be measured between -1 and +1. Negative means trade-off between two variables (Mainali et al., 2018).
FIGURE 2
Figure 2. (a) Synergy; (b) trade-off; and (c) delinking situations between two variables x and y determined by their changes ∆x∆y (Mainali et al., 2018: 5).
Sustainable Development Goal Progress
In this thesis, SDG progress is an advancement in development that meets current demands without compromising the ability of future generations to meet their measured goals (Brundtland Commission, 1987; Giles-Corti et al., 2020). SDG progress is calculated using the UN SDG index score, and scores for individual countries can be interpreted as a percentage of optimal performance (SDGindex, 2021). The SDG index organization explains that the difference between a country's score and 100 is the distance in percentage points required to reach optimum SDG performance (SDGindex, 2021). The UN statistics bureau calculates the SDG index in three steps, following detailed methodological steps accessible by Lafortune et al. (2018). The steps are as follows:
1. The establishment of performance thresholds and censoring of extreme values from the distribution of each indicator
2. The rescaling of the data to ensure comparability across indicators (normalization) 𝑁𝑜𝑟𝑚𝑎𝑙𝑖𝑧𝑎𝑡𝑖𝑜𝑛 𝑓𝑜𝑟𝑚𝑢𝑙𝑎: 𝑥′ = 𝑥 − 𝑚𝑖𝑛 (𝑥)
𝑚𝑎𝑥 (𝑥) − 𝑚𝑖𝑛 (𝑥) × 100 3. The aggregate of the indicators within and across SDGs (SDGindex, 2021)
The x is the normalization index. Min is the minimum, meaning lower bound, the smallest value that would round up to the estimated value. Max is the maximum, meaning upper bound, the highest value that would round up to the estimated value (SDGindex, 2021).
The SDGs are a theoretical framework and a practical result that has benefited countries in terms of having indicators in disaggregated data to measure sustainable progress (Cumming & Epstein, 2020; Ostrom, 2009; UN, 2015). The SDGs, which are precedents of the Millennium Development Goals aimed at transforming the world by addressing the challenges humanity face (Hulme, 2009;
UN, 2015; Tseng et al., 2020). Due to the various SDG targets and indicators, SDGs are complex to analyze the spillover effects. After reading the UN publications about challenges to be addressed in Africa, I selected five SDGs with available data. I measured five SDGs (3, 7, 8, 9, and 17) based on their indicators (Table 1) to analyze the spillover effects of one indicator on another. These SDGs are part of Africa's priorities in dealing with global challenges (UNSDG, 2020). Based on the five selected SDGs, the following hypotheses are proposed:
Goal 3: Good health and wellbeing
SDG 3 can be conceptualized as a goal to ensure healthy lives and promote well-being for all ages (UNSDG, 2015). Goal 3 initiatives are expected to increase health which may have increased progress on SDGs 8 and 9 but not on 7 (IIASA, 2019). For instance, in Africa the shift away from traditional fuels such as firewood and charcoal would provide opportunities to build better energy infrastructure (SDG 9). Moreover, the population will be in good condition to become vastly employed, which increases wealth and economic growth (SDG 8). The shift to a sustainable and modern lifestyle can be challenging due to the dynamic aspect of affordable and clean energy (SDG 7); thus, experts do not support a positive correlation between SDGs 3 and 7 (IIASA, 2017).
Hypothesis 1. SDG 3 (Good health and well-being) is expected to positively correlate with access to industry innovation & infrastructure and decent work &
economic growth but negatively correlate with affordable and clean energy in sub- Saharan countries.
Goal 7: Affordable and clean energy
SDG 7 can be conceptualized as a goal to ensure access to affordable, reliable, sustainable, and modern energy (UNSDG, 2015). SDG 7 has several benefits over other SDGs (McCollum et al., 2017). This goal is directly related to deploying renewables and energy-efficient technologies that may prompt innovation and employment objectives (SDG 8). However, an active measurement may need to be taken to minimize the negative impacts of a large-scale switch to renewable energy on the sectors working in fossil fuels (IIASA, 2017). Upgrading an infrastrcuture to a more sustainable and technologically way will benefit countries (SDG 9). There could be a concern because early retirement may have a negative economic implication needed to mitigate related sustainability challenges (IIASA, 2017).
Hypothesis 2. SDG 7 (affordable and clean energy) is expected to negatively correlate with the populations' decent work & economic growth, and industry innovation & infrastructure in sub-Saharan countries.
Goal 8: Decent work and economic growth
SDG 8 can be conceptualized as promoting sustained, inclusive, and sustainable economic growth, full and productive employment, and decent work for all (UNSDG, 2015). The promotion of SDGs 8 on 9 is positive (Kroll et al., 2019). The positive correlation is because there is decent work for people in the poorest countries, which may mean that they earn more wages than the extreme poverty line. Hence, they can afford to build infrastructure & innovation (SDG 9).
Hypothesis 3. SDG 8 (decent work and economic growth) is expected to positively correlate with industry innovation and infrastructure in sub-Saharan countries.
Goal 9: Industry innovation and infrastructure
SDG 9 can be conceptualized as building resilient infrastructure, promoting inclusive and sustainable industrialization, and fostering innovation (UNSDG, 2015). As explained earlier, in the previous hypotheses, SDG 9 will correlate positively with SDG 3 and 8 but negatively correlate with 7.
Hypothesis 4. SDG 9 (industry innovation and infrastructure) is expected to positively correlate with the population's good health and well-being, and decent work & economic growth but negatively correlate with affordable clean energy in sub-Saharan countries.
Investment
The World Bank projected that the transition to a low-carbon future would increase the demand for minerals to build green energy globally (Amaruzaman et al., 2022; Amir & Khan, 2022). Many of these required resources are found in Africa, making it appealing to many multinational countries seeking to increase their profitability (Amir & Khan, 2022). However, the resources must be acquired in a minimally invasive and environmentally sustainable manner to prevent the planet from collapsing (Amir & Khan, 2022; UN, 2015). On the other hand, it has been proposed that investment from multinational companies, private organizations, and other international organizations may mitigate SDGs trade-offs and increase synergies (Akanle, Kayode, Abolade &
Serpa, 2022). For instance, investments provide the capacity to finance initiatives that reduce post- consumer land-based waste and prevent it from entering marine ecosystems (Montiel et al., 2021).
Hypothesis 5. Investment in SDG development will positively correlate with the population's health and well-being, access to affordable clean energy, decent work
& economic growth, and innovation & infrastructure in sub-Saharan countries.
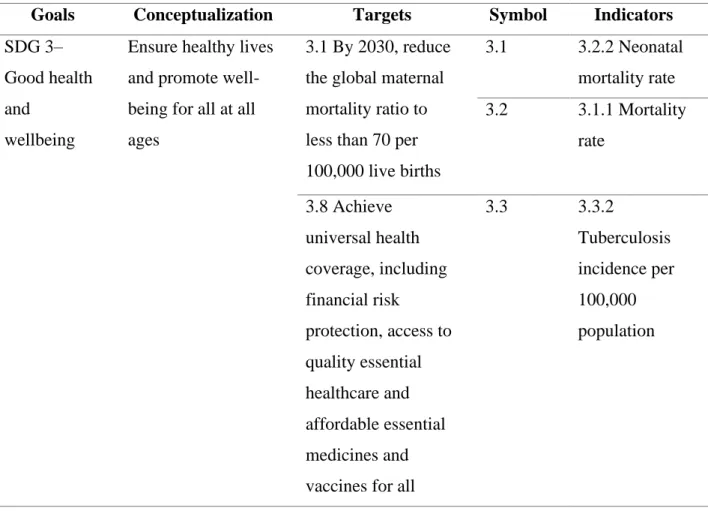
Table 1 shows the selected SDGs 13 x 13 indicators conceptualized and developed by the UN Statistics Commission (2015) to attempt to measure SDGs on a global scale. These SDGs in Table 1 have their corresponding targets to disaggregate the goals, and they can be measured using the indicators.
TABLE 1
The Conceptualizations of the Selected SDGS
Goals Conceptualization Targets Symbol Indicators SDG 3–
Good health and
wellbeing
Ensure healthy lives and promote well- being for all at all ages
3.1 By 2030, reduce the global maternal mortality ratio to less than 70 per 100,000 live births
3.1 3.2.2 Neonatal mortality rate 3.2 3.1.1 Mortality
rate
3.8 Achieve universal health coverage, including financial risk
protection, access to quality essential healthcare and affordable essential medicines and vaccines for all
3.3 3.3.2
Tuberculosis incidence per 100,000 population
3.a Strengthen the implementation of the World Health Organization Framework Convention on Tobacco Control in all countries, as appropriate
3.4 Surviving infants’
vaccination
SDG 7–
Affordable and clean energy
Ensure access to affordable, reliable, sustainable, and modern energy for all
7.1 By 2030, ensure universal access to affordable, reliable, and modern energy services
7.1 7.1.1 Population with access to electricity (%) 7.2 7.1.2 Population
with access to clean fuels and technology for cooking (%) 7.2 By 2030,
increase
substantially the share of renewable energy in the global energy mix
7.3 7.2.1 Renewable energy share in the total final energy consumption
7.3 By 2030, double the global rate of improvement in energy efficiency
7.4 7.3.1 CO₂ emissions from fuel combustion for electricity and heating per total electricity output
(MtCO₂/TWh) SDG–8
Decent work and
economic growth
Promote sustained, inclusive, and sustainable economic growth, full and productive employment, and decent work for all
8.5 By 2030, achieve full and productive employment and decent] work for all
8.1 8.5.2
Unemployment rate (% of total labor force) 8.an Increase Aid for
Trade support for developing countries
8.2 8.a.1 Aid for Trade
commitments and
disbursements SDG9–
Industry, innovation, and
infrastructure
Build resilient infrastructure, promote inclusive and sustainable industrialization and foster innovation
9.c Significantly increase access to information and communications technology and strive to provide universal and affordable access to the Internet in least developed countries by 2020
9.1 9.c.1 Proportion of population covered by a mobile network, by technology
9.a Facilitate sustainable and resilient
infrastructure development in developing countries through enhanced financial,
technological, and technical support to African countries
9.2 9.a.1 Total official international support (official development assistance ODA plus other official flows) to infrastructure
17–
partnership for goals
Strengthen the means of implementation and revitalize the global partnership for sustainable
development
17.9.1 Dollar value of financial and technical assistance committed to developing
countries
17.1 Total official development assistance ODA (gross
disbursement) for technical cooperation (millions of 2019 United States dollars) Table 1. The selected SDGs Conceptualization (UNstats, 2021: 3-18).
METHOD
The sections below describe the suitability of the Principal Component Analysis to examine the research methodology employed. I shed light on the suitability of PCA, including the analytical framework to provide a research approach that permits an accurate assessment of the PCA. Then
explain in details the research variables and descriptive statistics followed by the endogeneity issues, ethical issues & bias that may have occurred in this research
Principal Component Analysis
To understand which spillover effects play a role in SDG progress within sub-Saharan countries, I used a PCA technique to show how indicators’ can be potential trade-offs and synergy. The concept of the PCA statistical technique is to clarify high-dimensional information by retaining trends and patterns of that variable (Spaiser et al., 2016). PCA has extensively applied in sustainability studies (Hegre et al., 2020; Spaiser et al., 2016). For example, Spaiser et al. (2016) test, quantify and present an analytical model to identify the inconsistency within specific domains of SDGs, e.g., socio-economic development.
PCA serves as a better statistical analysis than factor analysis. Factor analysis is a top- down approach that describes several latent factors with a smaller number of observed variables (Lemke, 2020). On the other hand, PCA is a bottom-up approach to reducing the number of observed variables (Lemke, 2020). Experts argue that PCA is more suitable than factor analysis because the SDG indicators calculator is an unsupervised modeling task. PCA is a bottom-up method that reduces observed variables into fewer latent components (Mayer, 2008). The main advantage of using PCA is the dimensionality reduction of variables from multiple variables. On the other hand, PCA can be very descriptive because it is difficult to interpret the results of a principal component as it does not provide inferences. Thus, PC can be accompanied by correlation plots showing the coefficient between two variables.
Using a PCA for each SDG is not the same as perfectly showing that attainment in one goal causes a decrease or increase in another, yet a strong correlation is indicative of synergies and trade-offs (Spaiser et al., 2016).
Analytical framework of the principal component to the SDGs
I followed the PCA procedure using R programming as established by research (Anderson, 1984;
Hegre et al., 2020). These led to six analytical framework steps for the procedure of PCA in measuring SDGs indicators (Figure 4). First, before applying PCA, I compiled indicators for each SDG based on the UN priorities in Africa. Because the PCA requires complete data, I ensured that there was no missing data (Abdi & Williams, 2010; Anderson, 1984).
Second, I checked certain assumptions. For instance, PCA is sensitive to outliers. Thus, I checked for outliers to avoid overestimating the PCA results (Anderson, 1984; Field, Miles & Field, 2012).
I standardize the data to check for outliers by summing up the variance of each variable. The PCA does not impose a distributional assumption, but as linear correlations are investigated, variables are assumed to be linearly related (Jolliffe, 2002). For robustness check I checked whether the variables are linearly correlated.
Third, I reversed some indicators to ensure that a one-unit increase for each indicator contributes to the achievement of the goal. Reversing the sign of some indicators are relative to the original source. For instance, I reverse the indicator of neonatal mortality rate - the more extensive neonatal mortality is, the lower the attainment of SDG 3. I standardize all indicators to z-score scales. The standardization results of the indicators now have a mean of 0 and a standard deviation of 1.
Therefore, the standardized data have the same parameters as a normal distribution. The sum of
the variance of the normalized data returns as 1. In that way, I can conclude that there are no outliers.
Fourth, I calculated the covariance matrix for the dimensions in the dataset, which measures the degree to which two features covary.
Fifth, I choose the number of components to extract based on the components with the highest variance percentage. Components with the highest variance are expected to account for a more significant variance than one variable.
Sixth, I selected three components, then continued with the PCA procedure and formed a matrix of vectors. The vector is a matrix with information from eigenvector components with their loadings. Finally, I use the vector to reorient the data from the original axes to those represented by the PC’s output. The interpretation of the component structure and its results will be subsequently explained. Each of the indicators included is linearly related to one another. The strength of this relationship is contained in the respective component loading.
FIGURE 4
Figure 4. PCA Procedures adapted from (Hegre et al., 2020: 10).
Research process
Data
The UN classified 46 of 54 African countries as sub-Saharan African countries, excluding North African countries (UN, n.d). These 46 countries are in a similar geographical area near or entirely within the Sahara Desert in the continent. This research thesis considers only 44 countries because there few data available for Sudan and Mauritania. I disaggregated the data into regional levels (East, Middle, South, and West Africa). Out of 44 sub-Saharan countries: 18 East (Burundi, Comoros, Congo Republic, Côte d'Ivoire, Eritrea, Ethiopia, Kenya, Madagascar, Malawi, Mauritius, Mozambique, Rwanda, Somalia, South Sudan, Tanzania, Uganda, Zambia &
Zimbabwe); 7 Middle (Angola, Cameroon, Central African Republic, Chad, Congo. Dem. Rep.,
Step 1: Collect Key Indicators
Step 2: Conduct Sensitivity Analysis
Step 3: Reverse Indicators &
Standardize Data
Step 4: Calculate Covariance Matrix
Step 5: Extract Percentage Variance
Step 6: Create Matrix Vector
Equatorial Guinea & Gabon); 5 South (Botswana, Eswatini, Lesotho, Namibia & South Africa), and 14 West (Burkina Faso, Cabo Verde, Gambia, Ghana, Guinea, Guinea-Bissau, Liberia, Mali, Niger, Nigeria, Senegal, Sierra Leone & Togo). The data has an eight-year timing (2011 - 2018).
The panel data has 352 observations per variable described, which is 4576 (352 x 13 indicators) observations. The data employed in this research was collected via the World Bank and the UN Statistics SDGs database. I approached missing data by dropping missing values mainly in 2019 and did data imputation by filling data from the World Bank and UN statistics websites to replace missing values. The type of data employed is panel data. Panel data are longitudinal research that shows the data changes over time in a specific geographical area. The advantage of longitudinal research is that a considerable amount of care is considered to ensure that the sample size used in a study is representative of the overall population (Bell & Bryman, 2015). However, attribution issues can arise when changes in the same population must be measured over time but are not accounted for (Bell & Bryman, 2015).
Variables
A description of thirteen variables is shown in Table 2. As already explained, these variables are based on SDG indicators conceptualized by the UN (2015). These variables are a comparison of five SDGs. SDG 17 is one indicator because it covers the investment in SDG development (Akanle, Kayode, Abolade & Serpa, 2022). Other indicators covering investments are Aid traded by countries, ODA infrastructure (Official development assistance), and ODA technical cooperation (Official development assistance) (Akanleet al., 2022). As shown in Table 2, the measurement unit varies across these variables. Thus, I have standardized the variables. Four variables show negative signs while the others are positive. For ease of interpretation, I have
reversed the sign of the three indicators from SDG 3: (3.1) Neonatal mortality rate, (3.2) Mortality rate, and (3.3) Incidence of Tuberculosis. Meaning that the more extensive indicators 3.1, 3.2, and 3.3 are, the lower the attainment of SDG 3. The same goes for indicator SDG 8, with the indicator unemployment rate (8.1) reversed. Reversing the sign does not change the correlation between indicators or affect the PCs. However, it ensures that the correlation plots produced are easy to interpret.
TABLE 2
13 x 13 Indicators Measuring the Selected SDGs
SDG Name Unit Symbol
SDG 3 Neonatal mortality rate (reversed)
per 100.000 live births 3.1
Mortality rate (reversed)
Population (%) 3.2
Incidence tuberculosis (reversed)
per 100.000 popul ation
3.3
Surviving infants vaccinated
Population (%) 3.4
SDG 7
Access to electricity Population (%) 7.1
CO₂ emissions MtCO₂/TWh 7.2
Renewable energy share (%) population energy consumption
7.3
Clean fuels & technology Population (%) 7.4 SDG 8 Unemployment rate
(reversed)
(%) of total labor force 8.1
Aid trade by countries millions of 2018 United States dollars
8.2
SDG 9 Internet usage per 1.000 population 9.1
ODA infrastructure (Official development
assistance)
millions of 2018 United States dollars
9.2
SDG 17 ODA technical cooperation (Official development
assistance)
millions of 2019 United States dollars
17.1
Table 2. Five SDGs examined with their specific indicators (UNstats, 2021: 3-18).
Descriptive Statistics
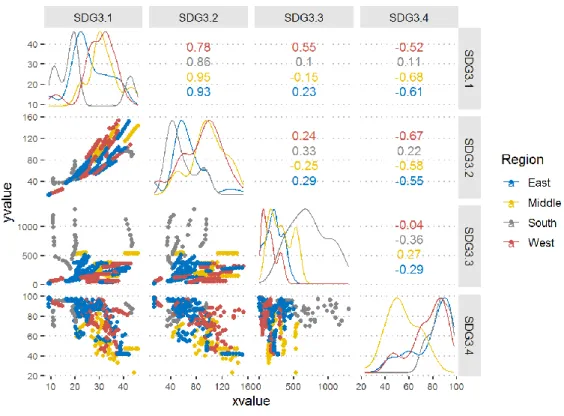
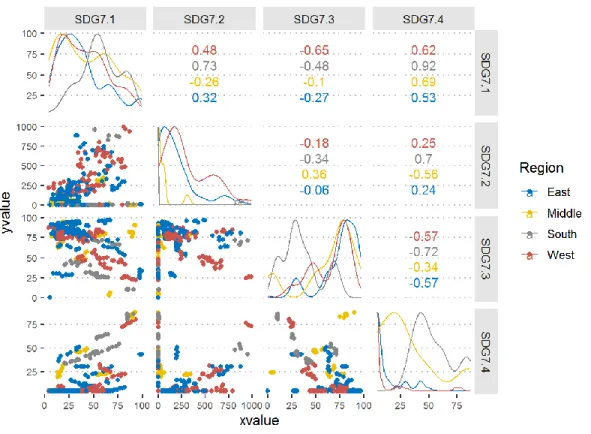
The descriptive statistics of the panel data can be found in Table 3, followed by the significant correlation and distribution statistics from Figures 10 - 13 in Appendix A. The mean is close to the values at the 50th percentile, and the standard deviation is high - this suggests a low concentration
of data around the mean value. Variable ‘aid trade by country’, ‘ODA infrastructure,’ and ‘ODA technical assistance’ have high skewness and kurtosis values. A high kurtosis means more of the variability is because of a few extreme differences from the mean. Figures 10 & 11 showed high kurtosis values are evident because their central peak is higher and sharper, and their tails are more extended and fatter. SDG 3 has multiple peaks (Figure 4). For that reason, I considered the SDGs of the African countries per region Figures 14 - 17. After displaying the SDGs per region, For SDG 3, in Figure 14, countries in the south have essential variables that have not been accounted for due to the bimodal peak.
Endogeneity
PCA does not account for causality issues (Bell & Bryman, 2015). Endogeneity may have occurred in this research because moderating variables are not used. African countries are dynamic, and different countries might have different ecosystems, networks, or focus groups working at the forefront of SDG initiatives. These groups of people infleunce were not considered in this research.
Future research could provide a more sophisticated analytical framework based on qualitative analysis, such as network analysis within a specific country, and quantitative analysis to identify causal link (Mainali et al., 2018).
Ethical Issues and Bias
The data used in this study are entirely anonymized and cannot cause any potential harm to participants. I created an account on World Bank public data and requested permission to use their data. Furthermore, there is no research deception or data manipulation for missing data even when the research does not confirm the hypothesis. This thesis was funded by Deloitte, which has a
vested interest in the research. The research fundings does not imply that the research is biased and lacks credibility because the University supervisors are also involved in the research credibility.
TABLE 3
Descriptive Statistics 13 x 13 Indicators Panel Data 2011 - 2018
3.1 3.2 3.3 3.4 7.1 7.2 7.3 7.4 8.1 8.2 9.1 9.2 17.1
Mean 113.22 27.78 77.57 277.39 75.45 41.57 194.93 66.22 20.31 7.60 261.83 15.74 185.13 Std.Dev 114.80 8.24 30.61 226.31 17.32 24.33 230.75 24.17 22.75 6.60 323.10 14.43 251.13
Min 1.80 9.10 14.50 11.00 23.00 4.10 0.04 0.00 4.50 0.32 0.10 0.70 0.01
Q1 25.97 21.85 53.95 127.50 62.50 20.27 4.93 48.98 4.50 2.92 48.75 4.50 30.74 Median 71.41 28.15 75.15 222.50 80.50 37.25 126.00 76.21 7.00 5.42 143.10 11.18 88.28 Q3 160.83 33.55 98.35 361.00 89.50 58.88 266.50 82.88 30.00 9.42 362.60 21.77 239.40 Max 529.72 46.10 153.20 1300 98.00 99.40 994.00 97.03 87.00 27.04 2400.00 62.00 1741.54 IQR 134.23 11.65 44.25 233.25 26.50 38.51 260.23 33.80 25.50 6.50 312.58 17.27 208.41
CV 1.01 0.30 0.39 0.82 0.23 0.59 1.18 0.36 1.12 0.87 1.23 0.92 1.36
Skewness 1.41 -0.18 0.21 1.80 -0.70 0.54 1.50 -0.96 1.48 1.42 2.63 1.29 2.46 Kurtosis 1.39 -0.44 -0.55 4.02 -0.64 -0.66 1.57 -0.13 1.26 1.12 10.64 0.90 7.17
N.Valid 352 352 352 352 352 352 352 352 352 352 352 352 352
Table 3. Variables Descriptive Statistics.
RESULTS
This result explained the PCA analysis and correlation matrix of 13 x 13 indicators to identify trade-offs and synergies. The PCA of indicators 3.3, 7.3, 8.1, 8.2, and 17.1 are related, showing negative signs (trade-offs). Converservely, indicators 3.1, 3.2, 3.4, 7.1, 7,4, and 9.1 are related, showing positive signs (synergy). Due to inconsistency between goals, the hypothesis is difficult to compare with the result because of different indicators measuring similar goals. Thus, hypotheses were slightly supported. Hypothesis 1 was slightly supported because indicators 3.1 – 3.4 were positively correlated mostly with 7.1 – 7.4, 8.1 but negative on 9.1. Hypothesis 2 was mostly refuted as SDG 7 mostly showed positive correlation instead of negative. Hypothesis 3 was confirmed as it showed a positive correlation 8.1 and 9.1. Hypothesis 4 was confirmed. Hypothesis 5 was not confirmed as I did not find a positive correlation between investment indicators and others. The rest of this section is explained in three steps. The first part of this section showed the correlation between the 13 x 13 indicators through a correlation matrix (Figure 5). The second part explained the PCA output indicating the variance percentage of each 13 PCs (Table 4). The third part interpreted the selected PCs.
Correlation Across SDGs
Figure 5 shows how the correlation between indicators 13 x 13 correlates. The colour of the square reflects the strength of the correlation – darker squares represent a strong correlation. Blue colour indicates a positive correlation, red a negative correlation. In Appendix E, I explained how indicators within similar SDGs correlate with one another. When comparing indicators with similar SDG, I concluded that SDG 3 indicator indicators 3.1 & 3.2 are related and showed positive
and 7.1 and 7.4 positively correlate on another. The overall result of the correlation between indicators are as follows.
There was a positive correlation between indicators 3.1 (infant mortality rate) with 3.2 (mortality rate) and 7.3 (renewable energy share). Research does not support the positive correlation between renewable energy and mortality rate (Majeed, Luni & Zaka, 2021). On the other hand, indicator 3.1 (mortality rate) correlated negatively with indicators 3.4 (surviving infant vaccinated), 7.1 (access to electricity), 7.4 (clean energy and technology), and 9.1 (internet usage).
According to Shobande (2020) infant mortality rates at birth negatively correlate with energy use.
Another research also shows that social media via the internet can reduce early neonatal mortality (Amani et al., 2017). Indicator 3.1 showed weak correlations with 7.2 (CO₂ emission) and 17.1 (ODA technical cooperation). Indicator 3.2 (proportion of mortality rate) had a strong positive correlation with indicator 7.3. Research does not support the positive correlation between renewable energy and mortality rate (Majeed et al., 2021; Nehara & Belgium Irfan, 2016). In contrast, indicator 3.2 strongly correlated negatively with indicators 3.4 (surviving infants vaccinated) and 7.1 (access to electricity) and 7.4 (clean fuels and technology), and 9.1 (internet usage). These results are in line with research findings (Shobande, 2020). I found a very weak correlation between 3.2 and 3.3 (incidence of tuberculosis), 7.2 (CO₂ emission), 8.1 (unemployment rate), 8.2 (aid for trade), 8.2 (ODA infrastructure), and 17.1 (ODA technical cooperation). Indicator 3.3 (incidence of tuberculosis) had a strong positive correlation with 8.1 (unemployment rate) and 7.4 (clean fuels and technology). These results contradict research findings (Amani et al., 2017; Shobande, 2020). The result showed a weak correlation between 3.4, 7.1, 7.2, 7.3, 8.2, 9.1, 9.2, and 17.1. Indicator 3.4 (surviving infants vaccinated) had a weak correlation with indicators 7.1, 7.2, 7.3, 7,4, 8.1, 8.2, 9.1, 9.2, and 17.1.
Indicator 7.1 (access to electricity) had a strong positive correlation with 7.4 (clean fuel and technology) and 9.1 (internet usage) and a positive correlation with 8.1 (unemployment rate).
The correlation between access to electricity and the unemployment rate contradicts research findings (Sarkodie & Adams, 2020). Surprisingly there was a negative correlation between access to electricity and renewable energy (7.3). Research supports this finding (Ibrahim et al., 2021).
The correlation between 7.1 and 7.2 (CO₂ emission), 8.2 (aid for trade), 9.2 (ODA infrastructure), and 17.1 (ODA technical cooperation) is weak. Indicator 7.2 (CO₂ emission) had a weak correlation with 7.3, 7.4, 8.1, 8.2, 9.1, 9.2, and 17.1. Indicator 7.3 (renewable energy) had a negative correlation between clean fuels and technology (7.4), unemployment rate (8.1), and internet usage (9.1). The correlation between renewable energy and internet usage is unclear but could be well explained through confounding variables. I found a weak correlation coefficient between 7.3, 8.2, 9.1, and 17.1 (ODA technical cooperation). Indicator 7.4 (clean fuel and technology) had a strong positive correlation with 8.1 (unemployment rate) and 9.1 (internet usage). This result is in line with this research expectation. There was a weak correlation between 8.2, 9.2, and 17.1.
Indicator 8.1 (unemployment rate) positively relates to indicator 9.1 (internet usage). This result implied that the higher the unemployment rate, the higher the internet usage. I found weak correlations between indicators 8.1 with 8.2, 9,2, and 17.1. was positively correlated with 17.1 (ODA technical cooperation). There was a weak negative correlation between indicators 9.1 with 9.2 and 17.1. Finally, there was also a weak correlation between 9.2 and 17.1.
FIGURE 5
Figure 5. Correlations between Indicators. Left is the correlation coefficient of SDGs variables and the right is the corresponding SDGs and indicators symbols.
Figure 5. Showing the correlations between indicators 13 x 13 in a matrix.
Principal Components Output
The PC output showed that every PC is associated with every indicator, thus 13 PCs. The output consists of the percentage variance with their corresponding (cumulative) percentage of variance (Table 4). In Table 5, are the components 1 - 5 account for 77.46 % of the data. However, I have decided to retain the first 3 PCs intuitively consisting of 60.762% cumulative percentage of variance, which is a large enough variance.
TABLE 4
Components with their Corresponding Percentage Variance
Component Percentage of variance Cumulative percentage of variance
Comp 1 34.063% 34.063%
Comp 2 16.605% 50.668%
Comp 3 10.094% 60.762%
Comp 4 8.936% 69.698%
Comp 5 7.763% 77.462%
Comp 6 5.985% 83.447%
Comp 7 4.543% 87.990%
Comp 8 4.049% 92.040%
Comp 9 2.319% 94.359%
Comp 10 2.026% 96.406%
Comp 11 1.503% 97.909%
Comp 12 1.177% 99.087%
Comp 13 0.912% 100%
Table 4: 13 Principal Components including PC 1 - 3 with their correlation between indicators.
TABLE 5
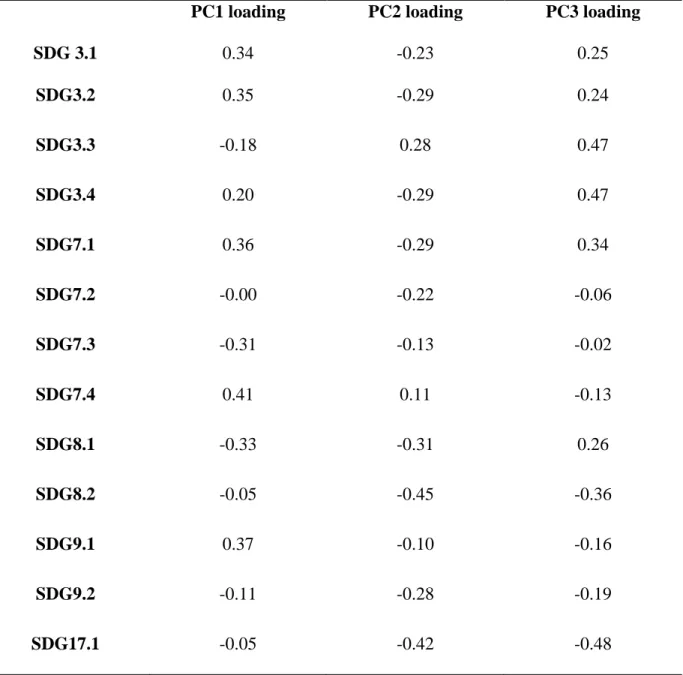
Principal Components with the Loading for each Indicator
PC1 loading PC2 loading PC3 loading
SDG 3.1 0.34 -0.23 0.25
SDG3.2 0.35 -0.29 0.24
SDG3.3 -0.18 0.28 0.47
SDG3.4 0.20 -0.29 0.47
SDG7.1 0.36 -0.29 0.34
SDG7.2 -0.00 -0.22 -0.06
SDG7.3 -0.31 -0.13 -0.02
SDG7.4 0.41 0.11 -0.13
SDG8.1 -0.33 -0.31 0.26
SDG8.2 -0.05 -0.45 -0.36
SDG9.1 0.37 -0.10 -0.16
SDG9.2 -0.11 -0.28 -0.19
SDG17.1 -0.05 -0.42 -0.48
Table 5. 13 x 13 indicators with their loadings derived from PC 1 - 3.
Interpretation of the Principal Components Output
The first component explains 34% of the variance, which means that nearly one-third of the information in the dataset can be summarized by PC1. PC2 explains 16%, and PC3 explains 10%
of the variance. Hence, by knowing the position of a sample concerning PC1, PC2, and PC3, we can get a very accurate view of where it stands about other samples. In Figure 7, I visualize the PCs 1-3 of each variable. Furthermore, I explained PCs using the results that are greater than 0.30.
Firstly, PC1 indicates that indicators 7.3 (renewable energy) and 8.1 (unemployment rate - reversed) are related because they each have a negative correlation, thus showing potential trade- offs. The following indicators are also related because according to PC1 indicators, 3.1 (neonatal mortality rate - reversed), 3.2 (mortality rate - reversed), 7.1 (access to electricity), 7.4 (clean fuel and technology), 8.1 (unemployment rate - reversed), and 9.1 (internet usage) show potential strong synergy. Secondly, PC2 shows potential trade-offs between indicators 8.2 (aid for trade), 8.1 (unemployment rate - reversed), and 17.1 (ODA technical cooperation). Lastly, PC3 shows only potential trade-offs between 8.2 (aid for trade) and 17.1 (ODA technical cooperation). PC3 shows potential synergy with 3.3 (tuberculosis incidence - reversed), 3.4 (surviving infants vaccinated), and 7.1 (access to electricity). Throughout the PC1 - PC3 indicator 7.2 and 9.2 show potential trade-offs, but their loadings are very weak.
Besides the correlation map, the factor map below (Figure 6) shows the variables closely related.
For example, indicators 3.1, 3.2, and 3.4 on the positive side of the plot are closely related.
Indicators 7.1, 7.4, and 9.1 on similar sides of the plot are also closely related.
FIGURE 6
Figure 6. Factor map is a graph of variables. Positive correlated variables point to the same side of the plot. Negative correlated variables point to opposite sides of the graph.
Figure 6. A factor map showing how closely related these indicators are.
TABLE 6
Summary of the Results
SDG Indicators Positive (+) Negative (-)
Progress on SDG 3 Neonatal mortality rate (+) mortality rate
Renewable energy Access to electricity, internet usage, Incidence of
tuberculosis
Unemployment rate Clean energy and technology Progress on SDG 7 Access to electricity (+)
Clean energy and technology
Internet usage, unemployment rate
Renewable energy
Renewable energy Access to electricity
clean
technology/internet usage, unemployment rate
Progress on SDG 8 Unemployment rate Incidence of tuberculosis and Internet usage
Renewable energy
Progress on SDG 9 Internet usage
Access to electricity (+) clean technology
Neonatal mortality rate (+) mortality rate
Table 6. This table summarizes results that show strong correlation between indicators. Some indicators from similar SDGs were combined because they have a strong positive correlation (+)
with one another.
Figure 7. Shows the Principal Components 1, 2, 3 and their relationship with the indicators from 3.1 - 17.1 Red line represents negative correlation and green represents positive.
PC2
3.1 3.2 3.3 3.4 7.1 7.2 7.3 7.4 8.1 8.2 9.1 9.2 17.1
PC3 PC1
DISCUSSION
When implementing the SDG agenda, it is crucial to analyze the spillover effects. In this thesis, I have attempted to advance the understanding of the spillover effect nature of the SDGs, focusing on synergy and trade-offs between goals. The research employed 13 x 13 indicators with 44 sub- Saharan African countries between 2011 - 2018 to understand whether progress on one goal diminishes or advances another goal. Many indicators are good for several reasons but interpreting the measures is challenging. A PCA is employed to reduce the multidimensional character of each goal while considering the information constrained in the full range of indicators. Specifically, summary measures (principal components) were extracted for each indicator and mapped correlations between all indicators.
What conclusions can be drawn from synergies and trade-offs between indicators? It can be observed that SDGs are largely compatible in the sense that for each country, the level of attainment in one SDG (3, 7, 8, 9, and 17) tends to be correlated with the level of attainment in one another. The attainment of one goal on another is evident in the correlation between each goal.
These consistent goals regard human development in the goal of good health, sustainable cities, and economic growth. Overall, this thesis's findings suggest that most indicators can be jointly reached.
Hypothesis 5 was strongly disputed because there was no strong correlation between indicators representing investment (official development assistance (ODA) in finance, infrastructure, and technical cooperation and development contributed by the international partnership, donors, and private investors) on other indicators. Further research may consider
investment indicators as moderating variables rather than independent variables. The indicator CO₂ emission (7.2) showed no strong correlation.
What is surprising is the spillover effects between different types of energy sources correlated with the population's wellbeing (SDG 3), sustainable economy (SDG 8), and industry and innovation (SDG 9). As shown in Figure 9, renewable energy share (SDG 7.3) has a positive correlation with (neonatal) mortality rate but a negative correlation with access to electricity, clean energy and technology, unemployment rate, and internet usage. Another form of energy source, clean energy and technology, showed the opposite effect. Clean energy and technology are negatively correlated with (neonatal) mortality rates but positively correlated with access to electricity, unemployment rate, and internet usage. Clean energy and technology were also positively correlated with the incidence of tuberculosis. Different energy sources could be evaluated to understand the dynamic result. Another surprising finding is a positive correlation between SDG 8.1 (unemployment rate) and SDG 9.1 (access to internet usage). More research should be done to understand the correlation between access to the internet and the unemployment rate.
The main findings from this research showed that it somewhat relates to the study of Hegre et al. 2020 because similar findings were found relating to SDG 7.3 (renewable energy), which mostly had a negative correlation with other indicators. Nonetheless, Hegre et al. 2020 did not discuss the correlation between the unemployment rate and access to the internet in their published paper. Indicators showing low correlation, such as the ODA finance and technical support operationalized in a way that are not consistent with the overall goal of "partnership for goals,"
despite their conceptual relevance. The simplification achieved using PCA helped avoid overfitting these indicators and associated targets. Such measurement problems may be because
other research concludes that the patterns at the target level typically do not resonate up to the goal level (Pradhan, 2019). Findings from this research analysis and similar ones assume that the available data on SDGs indicators can jointly capture essential aspects of progress (Hegre et al., 2020).
Limitations and Research Implications
The measurement of the SDGs is currently being discussed (UNSDG, 2021). If necessary, trade- offs regarding goal achievement are not captured due to unavailable data at the indicator level;
the synergies I find may be artificially exaggerated. For instance, it is clearly not valuable to measure SDG 12 ('climate action') because about 89% of this data related to Africa is scarce.
SDG 13 has been proven to have a spillover effect on SDG 7 ('affordable and clean energy'). For that reason, it may have been relevant to understanding how these SDGs are related (IIASA, 2017). Data relating to SDG 12 ('sustainable consumptions') is also scarce despite its relevance to the population's good health and well-being (SDG 3). As more and more indicators become available and the SDG agenda dimensions expand, using PCA will become an even more valid and even more relevant approach for capturing the weights of goal level and spillover effects.
What do these results of spillover effects mean for the prospect of reaching the SDG agenda? It is essential to consider that this research analysis on interactions relies on historical data, which I cannot predict due to the limited available data. Despite this fallback, I believe that this analysis documenting the prevailing compatibility of goals provides reason to be optimistic about the world's ability to simultaneously reach an SDG 3, 7, 8, and 9.
FIGURE 8
Figure 8. Renewable Energy versus Clean Energy and Technology Result Implication
Figure 8 shows indicators of SDG 7 showing a dynamic correlation between other indicators. By comparing the results of indicators of SDG, clean energy and technology, and renewable energy with other indicators such as (neonatal) mortality rate.
Spillover effects of SDG 7 indicator 7.3 and 7.4
Clean energy and technology were negatively correlated with (neonatal mortality) rate but positively correlated with access to electricity, incidence of tuberculosis unemployment rate and internet usage
Renewable energy was positively correlated with neonatal
mortality rate but negatively correlated with access to electricity, unemployment rate and internet usage
Implication
When clean energy and technology are being used it has synergy effect on (neonatal) mortality rate, but trade- offs on access to
electricity,
unemployment rate and internet usage
Implication
The spillover effects of clean energy and technology showed potential synergy on neonatal mortality rate while electricity, unemployment rate and internet usage showed potential trade-offs
Avenues for Future Research
The PCA analysis provided empirical results that different goals are related; however, the UN conceptualized these indicators as independent goals. Thus, the next challenge is for researchers to understand why specific indicators are related. For instance, it would provide significant research value to understand why indicators 3.4 and 7.1 are related in a practical context. African countries are dynamic. Thus, it can be challenging to see which region (e.g., East, and West Africa) of the country's results contradict using a PCA methodology as it will result in limited data. Future research may consider using qualitative data to provide more information about regional differences. Studying progress and causal relationships in the African regions with a more specific baseline level of development would be valuable for context-sensitive information strategies to achieve the SDGs (e.g., (Otekurin et al., 2019)). Further research is required to understand the impact of different initiatives and policies targeting one goal, such as the influence of investment indicators in specific SDGs.
Conclusion
By analyzing the spillover effects of SDG 3, 7, 8, 9 and 17 between 2011 - 2018 in the sub-Saharan area, this thesis showed how specific SDG indicators correlate with one another. In that way, I showed how progress in one SDG may potentially diminish or strengthen another (the result is summarized in table 6). The results imply that progress of SDG 3 – wellbeing (neonatal) mortality rate reversed may lead to progress on SDG 7 (renewable energy share) but may diminish progress on SDG 8 (access to electricity) and SDG 9 (internet usage). Another SDG 3 indicator (incidence of tuberculosis) progress may also strengthen the progress on SDG 8 (unemployment rate reversed) and diminish progress on clean energy and technology. Furthermore, we can also imply that
progress on SDG 7 (access to electricity & clean energy and technology), which are separate indicators but combined because they are positively correlated may strengthen the following SDGs. Progress on SDG 7 (access to electricity & clean energy and technology), may strengthen SDG 9 (internet usage), SDG 8 (unemployment rate reversed) but diminishes the progress on SDG 7 (renewable energy share). Lastly, progress of SDG 7 (renewable energy) may also diminish progress on the same SDG (access to electricity and clean technology), SDG 8 (unemployment rate) and SDG 9 (internet usage).
Recommendation
By employing a PCA to show spillover effects in Africa, I have addressed the theoretical gaps.
My recommendations to use PCA are as follows.
Firstly, the UN already identifies that the two significant global challenges for the current state of SDG data are the invisibility and inequality that are essentially due to a large amount of data to collect, resulting in high cost and inadequate resources (OECD 2019). The analytical framework in this research may resolve these challenges because I have identified a small set of indicators to represent the selected SDGs. Research supports this argument (Kozma, 2019). This brings out the relevance of the research because I selected the principal indicators from the earliest indicators rather than creating new indicators or creating new ways to measure indicators (Kozma, 2019). Thus, SDG indications are easier to measure and have better data availability. In that way, this thesis analysis can sufficiently address SDG progress reducing the resource investment in data needed to monitor the indicators effectively.
PC can be adequate, especially with limited resources and declining investment in SDG measurement, specifically in African countries with substantial data challenges.
Secondly, I recommend examining the PC indicators every couple of years. Principal indicators are identified based on historical correlations between individual indicators. On the other hand, some correlations may change over time, primarily due to the presence of the Corona pandemic. For instance, the missing SDG indicators data, such as SDG 12 ‘Responsible Consumption’ might have a synergy effect on poverty because by harvesting cash crops to increase SDG 12 may supposedly worsen food security (Kozma, 2019). Therefore, reexamining the principal indicators every couple of years is needed to identify the changed correlations and update the principal indicators. I do not expect the change to happen often, and it will take several years to gather historical data.
Lastly, further research should identify ways to strategically address the inconsistency within the SDGs framework by building a new framework for SDGs that conceptually account for spillover effects. For instance, research can map out a new SDG framework that shows the commonly known interlinkages between goals based on a literature review rather than a single stand-alone framework. I have addressed the theoretical gaps by employing a PCA to show spillover effects of SDGs indicators. I recommend using the PCA analytical framework because of the following reasons.
REFERENCES
Abdi, H., & Williams, L. J. 2010. Principal component analysis. WIREs Computational Statistics, 2: 433–459.
Adams, S. & Sarkodie, S. A. 2020. Electricity access, human development index, governance and income inequality in sub-saharan africa. Energy Reports, 6: 455-466.
Akanle, O., Kayode, D., & Abolade, I. 2022. Sustainable development goals (SDGs) and remittances in africa. Cogent Social Sciences, 8: 1–17.
Amani, A., Nansseu, J. R., Mah, E. M., Vougmo, C. M., Moluh, S. M., & Mbu, R. 2017. Use of a social media network to reduce early neonatal mortality: a preliminary report from a quality improvement project in Yaoundé, Cameroon. Maternal health, Neonatology and Perinatology, 3(18): 1–6.
Amaruzaman, S., Trong Hoan, D., Catacutan, D., Leimona, B., & Malesu, M. 2022. Polycentric environmental governance to achieving SDG 16: Evidence from Southeast Asia and Eastern Africa. Forests Journal, 13:1–20.
Amir, M., & Khan, S. Z. 2022. Assessment of renewable energy: Status, challenges, COVID-19 impacts, opportunities, and sustainable energy solutions in Africa. Energy and Built Environment, 3: 348–362.
Anderson, T.W. 1984. An introduction to multivariate statistical analysis. John Wiley & Sons:
New York.
Ashukem, J. N. 2020. The SDGs and the bio-economy: Fostering land-grabbing in Africa.
Review of African Political Economy, 47: 275–290.
Bell, E., & Bryman, A. 2015. Business Research Methods. (4th ed.). New York, NY: Oxford University Press.