The homologation level of CO2 emissions seems to be a very optimistic value for this vehicle. The vehicle's average annual CO2 emissions were estimated to be 27% lower than the 1.6-litre petrol engine. User profiles are very diverse and will create a large range in the potential annual CO2 emissions of these vehicles.
The average annual estimated CO2 emissions were about 2.5 times higher than the value stated in the type approval.
Background
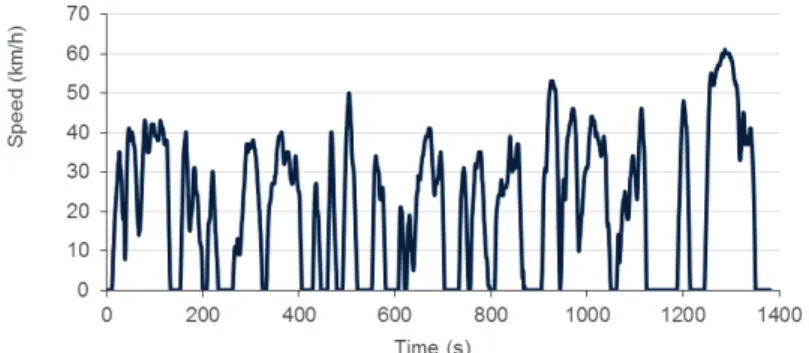
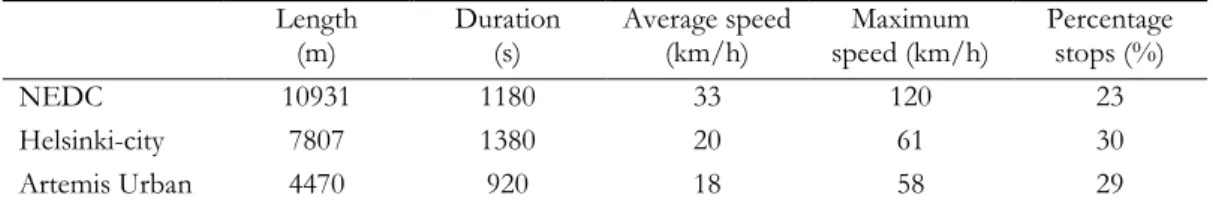
What is the range and energy consumption when PHEVs run in electric driving mode? Others maximize the share of driving in electric driving mode by charging where possible. Figures 2.3, 2.4 and 2.5 show the speed profiles of the selected driving cycles used in the tests.
The ICE operated at -7°C most of the time in the first cycle (missing chart data). CO emissions were slightly higher than the EU homologation limit of 1.0 g/km (NEDC test) while driving in the Artemis Urban test. In the cycle test of the city of Helsinki, the vehicle was tested with a fully charged battery twice at +23 °C and -7 °C, with a.
The main particle emission in cold climates occurs in the first 2 km of the test cycle. In hybrid mode, the vehicle can partially run fully electric, but the ICE is switched on during the more demanding parts of the driving cycle. In the hybrid mode, the vehicle apparently selected the most efficient pre-programmed driving pattern.
The ICE was partially fired with a CO2 emission of 82g/km when driving in NEDC at -7°C. Vehicle A has a much higher energy consumption than vehicle B in the Artemis test in this driving mode. The estimated average annual CO2 emission was about 2.5 times higher than the value declared in the official type approval CO2 emission test.
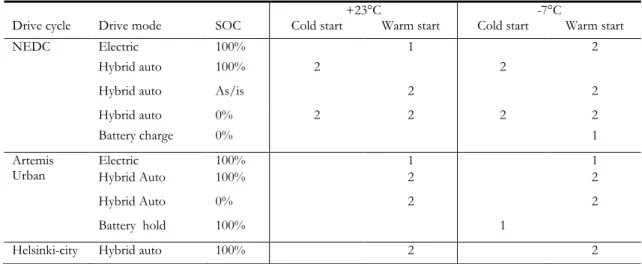
To be able to precondition the vehicles prior to testing, the vehicles were run for some of the tests in battery hold mode after being fully charged.
Purpose, hypotheses
Boundaries
The data cannot be used to estimate the average emissions or energy consumption of the fleet of PHEVs on the road.
Report structure
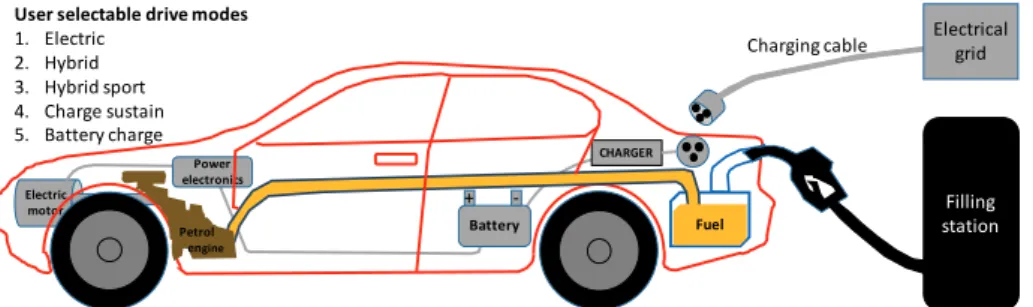
Theory of operation of the plug-in hybrid electric vehicle
The combination of laboratory measurement results and user profiles obtained through user surveys provides a basis for evaluating the environmental impact of these vehicles during one year of driving. Laboratory measurements and research were therefore carried out in the EMIROAD project to assess the contribution of PHEVs. In an online survey, users of PHEV, BEV and ICEV vehicles were asked about their purchase motivation, usage pattern, charging behavior and socio-demographic parameters.
The results of the user pattern study can be found in an already published TØI report (Figenbaum and Kolbenstvedt 2016). Elements from the two parts of the project are brought together in Chapter 4, in an assessment of the potential average environmental impacts of these PHEVs over a full year of driving.
Methods
Test program
Driving cycles that have been established in the vehicle testing community were chosen to make the test as repeatable and comparable as possible. The New European Driving Cycle (NEDC) is used for European type approval testing, and the results are used as official vehicle emission and energy consumption data. In the EMIROAD project, vehicles were taken directly from the road and tested as they were.
The Artemis Urban cycle is commonly used in European test programs to estimate emissions under more realistic real-world city traffic conditions than the NEDC test. In the tests, the cycle is divided into three intervals with separate exhaust gas possibility as shown with different colors. Therefore, the CO2 and local emissions for pure electric propulsion are considered zero in the measurement program.
For a global estimate of the total greenhouse gas emissions of a PHEV, WTW (well-to-wheel) emissions must be considered, including emissions from fuel/electricity generation, conditioning and transport. A recent review of the effectiveness of the EU ETS (EC, 2015) found that it was working as intended. The Helsinki city test was performed only once at each temperature and only with a fully charged battery.

Comparisons of results
Vehicle A was kindly made available to EMIROAD by the Norwegian importer and transported to Finland.
Vehicle A
11 km and 4.5 km respectively in the NEDC and Artemis Urban cycles, while the hybrid vehicle completed three repeated runs in E-mode in these cycles. The engine started and immediately shut down in the first cycle in both tests (green line). In the third cycle of Test 1 and the second cycle of Test 2, the ICE was switched on briefly.
The vehicle can run more or less electrically, even in hybrid mode when the vehicle is warm and the power requirement is moderate, as shown by the 0-4 km hot start tests at +23°C with a fully charged battery (Figure 3.7) . The NOX emissions are well below the type approval limit value in the cold start NEDC test at 100% SOC, and at +23°C and at -7°C. The reasons for high emissions with hot starts in the Artemis Urban and Helsinki city cycles are not clear.
Emissions are low in NEDC warm start tests for similar battery conditions and temperature conditions. Thus, the measured energy consumption and CO2 emission will cover both driving in charging mode and part of the following driving in E-mode, thus partly explaining the high values measured. However, owners can also charge the vehicle while driving to be able to use it in sport hybrid mode later in the trip.

Vehicle B
The vehicle's CO2 emissions were compared to that of a similarly powered diesel version of the vehicle. However, in favorable driving conditions and starting fully loaded, the vehicle can have 70% lower CO2 emissions than the comparable diesel vehicle. Comparison with official NEDC type approval values and CO2 emissions test results of a 1.6-litre petrol engine version of the vehicle.
When the vehicle could perform the tests in pure EV mode, the emission reduction was 100%. The CO2 emission and energy consumption were quite high when the vehicle was started with 0% battery SOC at an ambient temperature of -7°C. The vehicle emitted less than the comparable gasoline engine version of the vehicle in most driving conditions where comparable tests were conducted.
Comparison with official type approval values and CO2 emission of 1.6 l petrol version of the vehicle (g/km). If the vehicle had been driven further, it would have switched on the ICE and continued in hybrid mode. The CO2 emission level of vehicle B varies much more between driving cycles and temperatures than it does for the comparable 1.6-litre petrol version of the vehicle.

Comparison between vehicles
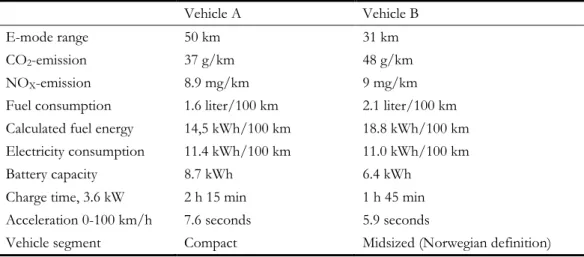
The vehicle's range in E mode is 31 km according to the type approval, but it was as low as 14.5 km when tested at -7°C in the NEDC. The range in E-mode for vehicle A was estimated to be 40 km/day in summer and 28 km/day in winter, according to results from the user survey (Figenbaum and Kolbenstvedt 2016). These average range estimates seem potentially possible if driving is not too aggressive, based on the results of the E-mode in the lab tests.
For this example, it was assumed that all journeys above 10,000 km/year were in the 0% SOC hybrid driving mode. In the user study (Figenbaum and Kolbenstvedt 2016), vehicle A was used on average about 15,000 km/year, which would result in a CO2 emission reduction of about 50% compared to the diesel vehicle. Based on the vehicle test results in E-mode, a range in E-mode was therefore assumed to be 33 km in summer and 14 km in winter.
A hot start in pure electric mode with 100% SOC is not really possible in the real world unless the vehicle has been preheated or battery hold mode has been used in the previous part of the drive. Some PHEVs on the market cannot be driven in E-mode if the ambient temperature is below -10°C. When the battery is charged in charge mode followed by driving in E mode, the average energy consumption for the entire trip should be evaluated.
Aggressive driving in hybrid mode leads to increased emissions in the cold and when the SOC of the battery is low. There is energy loss between the outlet and the electricity stored in the battery that would not be.

Vehicle A
Vehicle B
Discussion of results
On the other hand, vehicle B's hybrid mode driving was pure electric across many drive cycles and driving conditions, while vehicle A used more ICE. If these vehicles are driven in E mode when cold and the engine is started after the cabin is warmed up, the ignition may be half-hot, depending on whether the heating system circuit includes the ICE engine block. Cold temperatures and aggressive driving reduced range in E-mode and increased energy consumption in all driving modes and driving cycles tested for both vehicles.
The cold weather tests presented in this report were done at -7°C, so that problem was not encountered in the testing. Driving in the battery charge and battery hold modes, respectively recharging the battery and maintaining the battery SOC, resulted in very high CO2 emissions and high energy consumption in Vehicle A. Due to the heavier weight of the added battery and the electrical system, the energy consumption in non-electric mode can be higher than for comparable ICEVs and especially for HEVs, under adverse conditions.
Total energy consumption and CO2 emissions for these two vehicles under Norwegian usage patterns and climate conditions can be around 30-50% lower than comparable ICEVs, keeping average local emissions below type approval limits . The spread of CO2 emissions and energy consumption between driving modes and temperatures is however much greater than for ICEVs. The mixed electric/ICE operation of vehicle A in E mode is not a problem when it comes to reducing CO2 emissions and energy consumption over a year.
Conclusion
Future research
Error sources
Real driving emissions test procedure for pollutant exhaust emissions from cars and light commercial vehicles in Europe. A 2016 update of official and "real-world" fuel consumption and CO2 values for passenger cars in Europe. Plug-in hybrid electric vehicle LiFePO4 battery life implications of thermal management, driving conditions and regional climate.
Test # DAY Cycle SOC Driving Mode Start Temp Test # DAY Cycle SOC Driving Mode Start Temp.