This report presents an evaluation of the effects on road safety performance of quantified road safety targets set by national or local governments. This report examines the effectiveness of quantified road safety objectives in improving road safety performance.

Previous research
However, there are few evaluation studies that show that quantified road safety measures are effective in improving road safety. There is a clear possibility that one must ultimately conclude that research that attempts to evaluate the effectiveness of quantified road safety measures at an international level is inconclusive.
Hypotheses
Previous research (Elvik 1993) shows that quantified road safety targets tend to shift towards caution, especially when the original target has not been met. These hypotheses suggest a certain pattern in the results of a study designed to evaluate the effectiveness of quantified road safety targets.
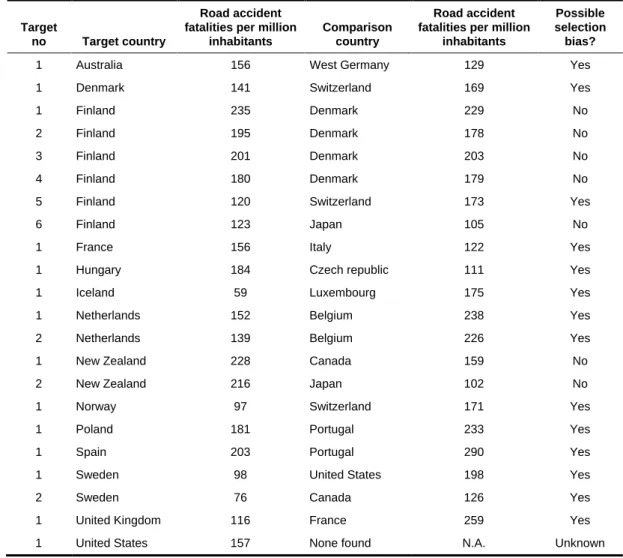
National targets
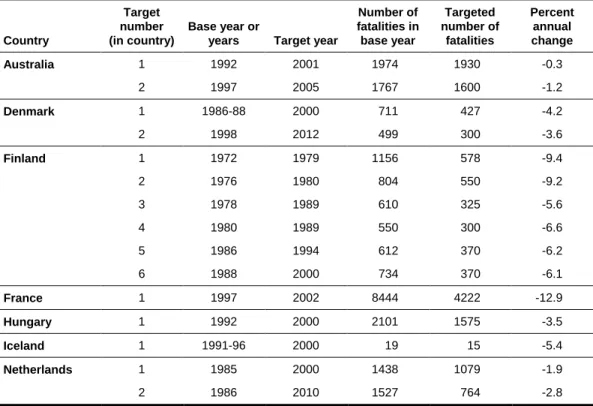
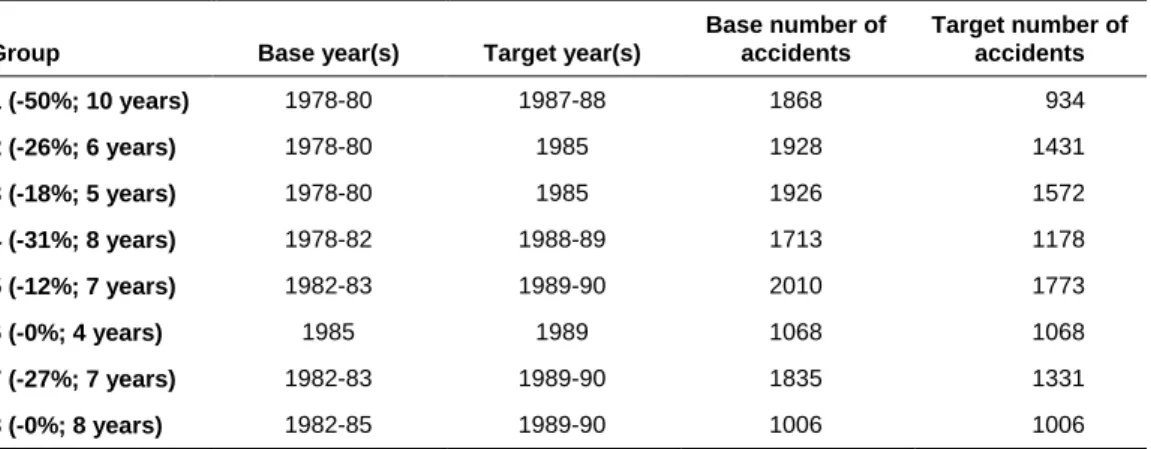
The table includes both targets that were set many years ago and have expired, and targets that were set for years into the future, such as 2008 or 2010. So for these four countries, two targets were in effect at the same time. .
Local targets
Sixteen counties had a quantified road safety goal during the 1986-89 planning period, three counties had no such goals. The targets set by the Australian states are set out in the OECD report mentioned above.
Aims and challenges of road safety evaluation studies
Sources of data – variables included
Study design considerations for before-and-after studies
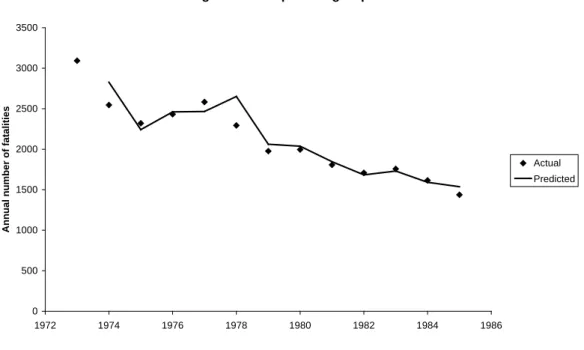
After defining the role of a comparison group, Hauer (1997) goes on to develop guidelines for choosing a comparison group among various candidates. In figure 1, the dots show the actual number of road accident deaths each year in the Netherlands, the line shows the predicted number, with Belgium as a comparison group.
Study design considerations for multivariate analyses
- Choice of variables to be included
- Functional form of relationships between variables
- Assumptions regarding residual terms
- Choices made for the design of multivariate analyses
One can investigate the form of the relationship between two variables by means of exploratory analysis, that is, by trying different forms, such as linear. Then, the distribution of the remaining terms is best modeled by the negative binomial distribution.
Statistical analysis and synthesis of results of before-and-after studies
Exp is the exponential function (that is, 2.71828 raised to the power of the term in parentheses), yi is the logarithm of each effect estimate, and wi is the statistical weight of each effect estimate. This test statistic has a Chi-square distribution with g – 1 degrees of freedom, where g is the number of estimates of power that have been combined.
Statistical analysis and synthesis of results of multivariate analyses
Deductions from main hypothesis
In case B, the target country improved its safety performance in the post-period (shown by the steeper slope of the curve), whereas the comparison country did not improve its safety performance (the slope of the curve remained the same as in the pre-period) . For example, if there was an average annual reduction of 1% in the pre-period and an average annual reduction of 2% in the post-period, the safety performance has improved. The net change in security performance from the pre-period to the post-period should favor the target country.
Before-and-after study of national road safety targets
Australia
The crude odds ratio is 0.937, indicating that the quantified target in Australia was associated with a net reduction in deaths of just over 6% compared to West Germany. Adjusted for the imperfect matching of disaster experience in the prior period (Australia was slightly better than West Germany even then), the net effect of the target is just under 3%. Therefore, it is too early to assess its effectiveness, as only two-year follow-up data are currently available.
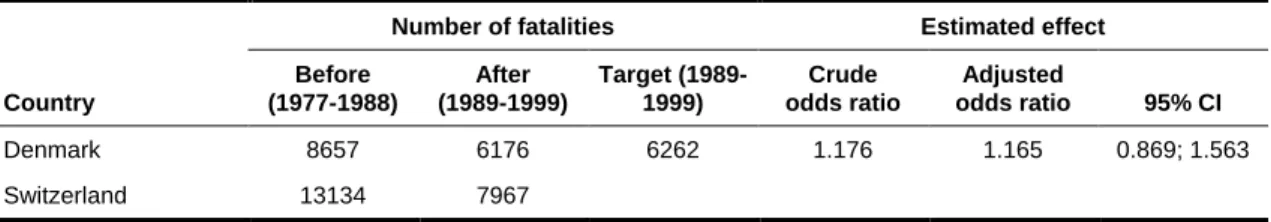
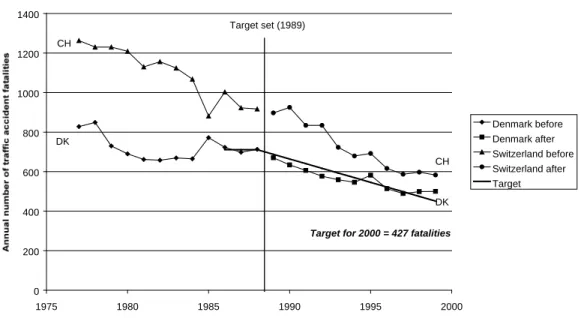
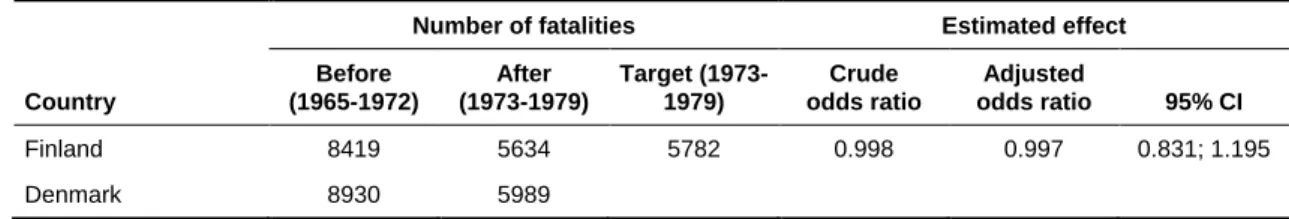
Denmark
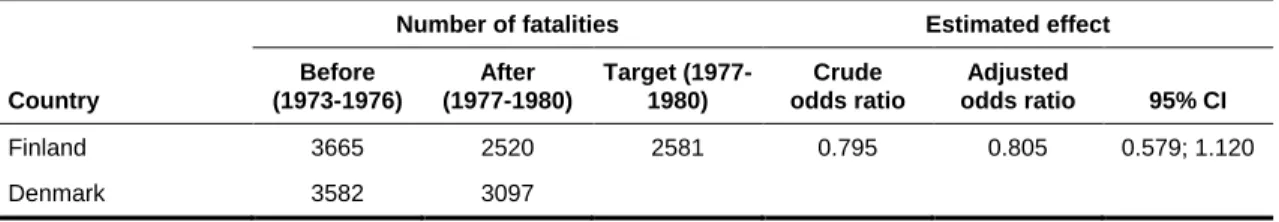
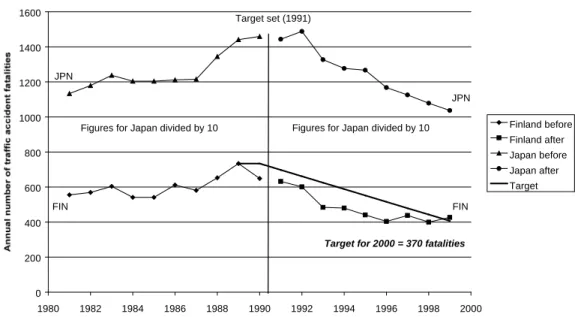
Finland
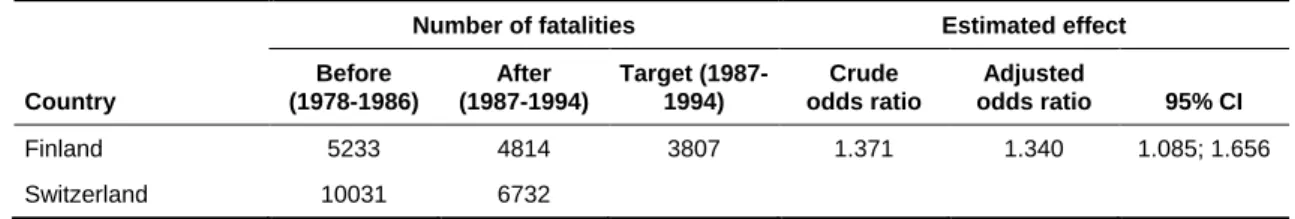
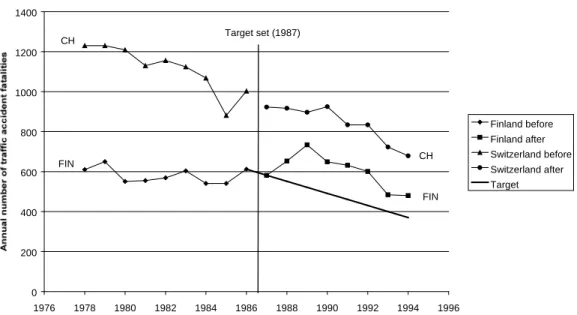
By that time, Denmark had adopted its own quantified road safety target and was therefore no longer eligible as a reference country. For now, it suffices to note that Switzerland indeed outperformed Finland, despite the fact that the country had no quantified road safety target during this period. The general impression from the evaluations of the quantified road safety objectives in Finland is mixed.
France
But the population of the state of Victoria is much smaller than the population of France.
Hungary
The quantified road safety target in Hungary is associated with a significantly better road safety performance than in the Czech Republic.
Iceland
There was a net increase of more than 80% in the number of deaths in Iceland from before to after the establishment of a quantified target, compared to Luxembourg. The difference in safety performance is not statistically significant and is associated with a very wide confidence interval. Iceland seems to have had some bad luck in the years since it set the security target.
The Netherlands
The target for 2000 is linked to an improved road safety performance in the Netherlands, corresponding to a net improvement of 14% compared to Belgium. Belgium matched the Netherlands well in the period before (mean odds ratio 0.980; variance of odds ratio 0.002). The long-term goal for the Netherlands is linked to an improved road safety performance.

New Zealand
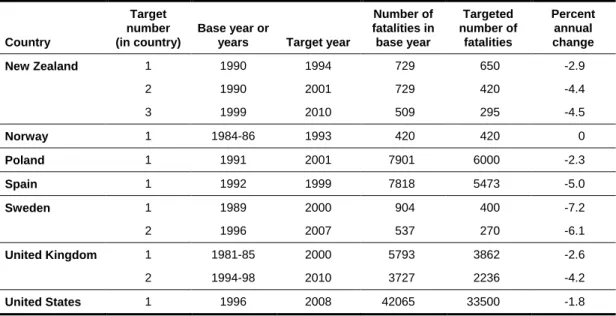
According to Table 17, New Zealand improved its road safety performance after the target was set for 2001. Let's examine how the quantitative road safety target set in Norway fares against these criteria. According to the results presented in Table 19, setting a quantitative road safety target in Poland did not improve road safety performance compared to Portugal.

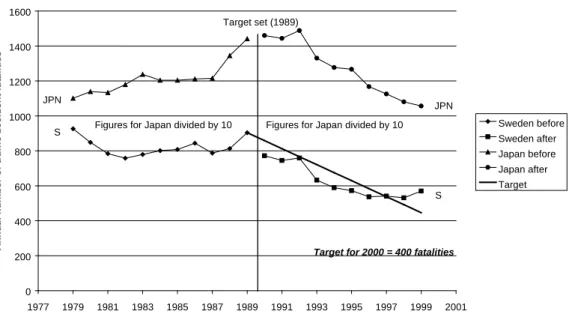
Sweden
Canada was selected, and matches Sweden adequately (mean odds ratio in pre-period = 0.987; variance of odds ratio = 0.013). The data indicate that the target set for 2007 has so far been less successful than the target set for 2000. There was a net reduction in the number of deaths in Sweden compared to Canada, but the difference is very small and far from statistically significant at the 5% level.
United Kingdom
The United States of America
These figures do not show that the quantified road safety target has been effective so far, as it shows an increase of 2%. The confidence interval was estimated by treating the variance around the mean annual number of deaths in the previous period as analogous to the variance of the odds ratio in the comparison group method.
Before-and-after study of local road safety targets
Local road safety targets in Norway
Target countries Comparator countries Impact measure Target group Before Then Before Then Odds ratio 95% CI. According to Table 24, most of the targets set by the Norwegian counties were related to modest improvements in road safety, between 5 and 10%. There is a tendency for more ambitious goals to be more successful than less ambitious goals.
Local road safety targets in Australia
Two quantitative road safety targets set in the Netherlands are represented in the dataset. Thirteen estimates of the effect of a quantitative road safety objective were made in multivariate analyses. Assessment of the effects on road safety performance of quantitative road safety objectives is inconclusive.
Local road safety targets in Germany
Synthesis of results of before-and-after studies
Testing the consistency and homogeneity of the results of the before-
15 of the 22 estimates of the effect of national targets indicate a reduction in the number of road accident deaths, 7 indicate an increase. Figure 27, derived from the funnel plot, shows the distribution of estimates of effect by size. The distribution is slightly skewed towards a reduction in the number of deaths or accidents, suggesting that the weighted average effect of quantified road safety targets may be a small improvement in road safety.
Meta-analysis of effects of quantified road safety targets
First generation road safety targets are not associated with better road safety performance than later generations of road safety targets. The weighted average difference in road safety performance associated with quantified road safety targets amounts to 5.6%, applicable to average period of 7.47 years. The magnitude of the difference in road safety performance associated with quantified road safety targets hardly changes when 10.

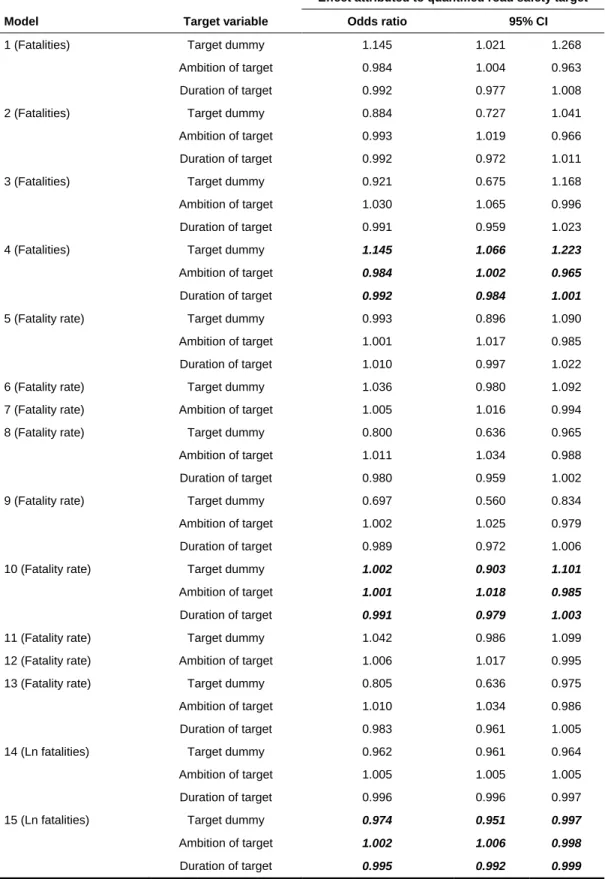
Multivariate analyses of effects of quantified road safety targets
Overview of models fitted
It was assumed that such a correction should not be made for models using fatality rate as the dependent variable, since fatality rate is not a count variable. Include as many explanatory variables as possible, that is, all potentially confounding variables and all target variables. Target variables include a dummy variable for the presence of a quantitative road safety target, a variable representing the level of ambition of a quantified target, and a variable counting the number of years a target has been in effect. amp;).
Results by model
It takes the value 1 in the first year, 2 in the second year, and so on.
Synthesis of results of multivariate analyses
Synthesis of results of before-and-after studies and multivariate analyses . 55
This finding is more consistent in before-and-after studies than in multivariate analyses. However, on balance, the main trend of the findings of both analyzes supports the conclusion that road safety performance is improved by setting a quantitative target for road safety improvement.
Two ways of interpreting study findings
History repeats itself until it suddenly no longer does so
The simplest assumption that can be made in a before and after study is that: "Next year will be like this year". However, even going so far as to demonstrate the past predictive success of a comparison group does not validate the assumption that future predictions will be as successful as the past. Man always relies on an unprovable assumption that the future will be like the past.
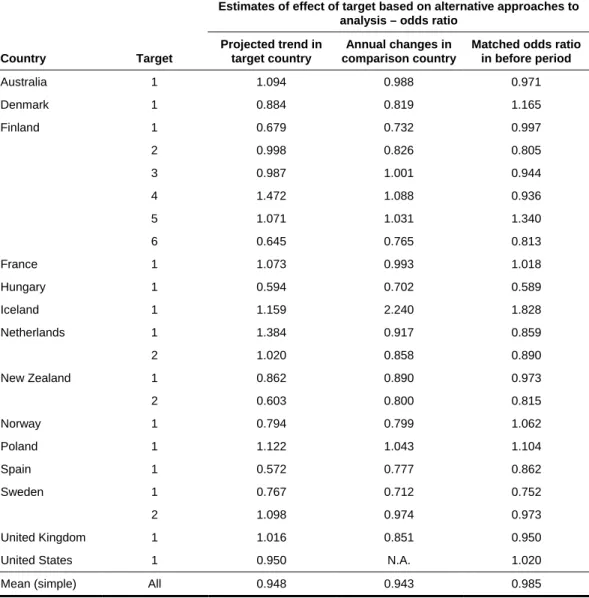
Alternative analyses of before-and-after studies
The long-term trend in the preceding period was described in terms of the average annual percentage change in the number of deaths. The observed number of deaths in the target country in the last year of the pre-period is taken as a basis. In the first year of the post-period, the number of deaths in West Germany, which was used as the comparison country, decreased by 5.1%.
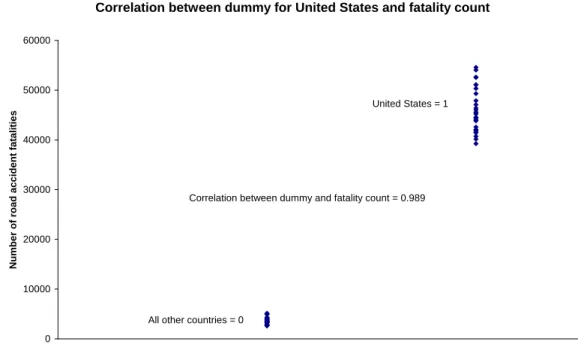
Methodological issues in multivariate analyses
On the other hand, it was considered desirable to include as many countries as possible in the analysis. In general, as many countries as possible are included in the analyzes in the belief that countries can learn from each other in terms of road safety policy. It shows the correlation between population and death rate in the 23 countries included in the multivariate analyses.
Internal validity of study findings (causal interpretation)
- Existence of statistical relationship
- Strength of statistical relationship
- Internal consistency of statistical relationship
- Clarity with respect to direction of causality
- Control of confounding factors
- Presence of a dose-response pattern
- Specificity of effect in subset of data
- Knowledge of causal mechanisms
- Results reproduced in similar studies
- Conclusions with respect to internal validity
62% of the estimates agree with the hypothesis that setting a quantified road safety goal improves safety performance. Recent evaluations of road safety policies in Norway (Elvik 1999) and Sweden (Elvik and Amundsen 2000) have shown that current policy priorities in both countries are rather inefficient (Elvik 2001). Neither the before-and-after studies nor the multivariate analyzes were very successful in providing clear evidence of the effectiveness of quantified road safety objectives.