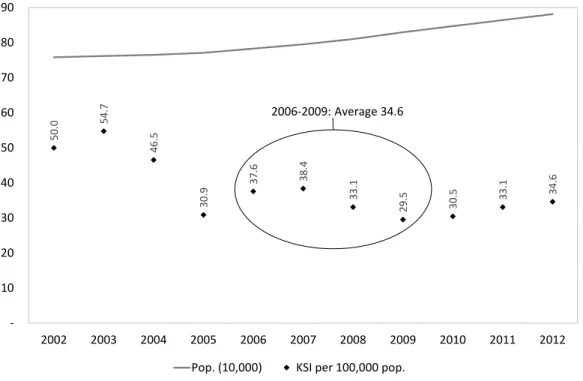
Other factors that may influence the development of the number of KSI are discussed and taken into account as well. The current development of the number of KSI in the city of Stockholm does not seem to be in the right direction.

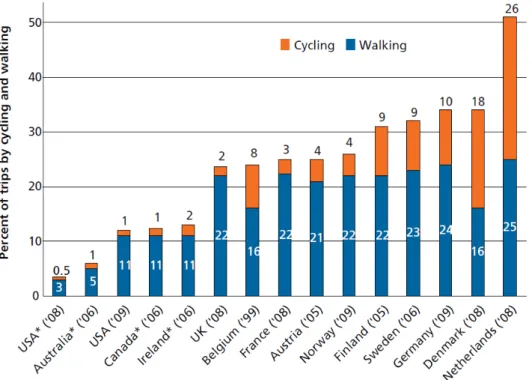
Exposure
In the following analyses, a logarithmic trend predicting a 23% increase in the amount of bicycle trips in 2020 compared to the best estimate will be taken. It is assumed that the development is the same in the whole of Stockholms city as in the city centre.

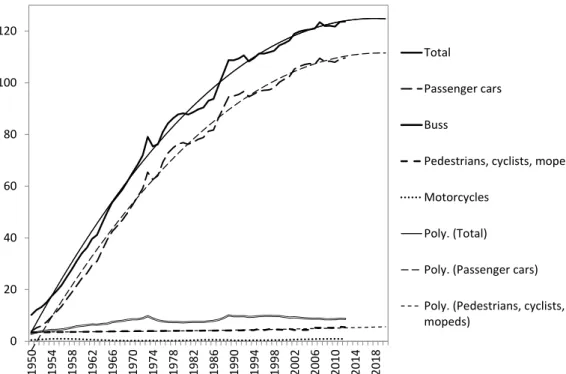
Safety
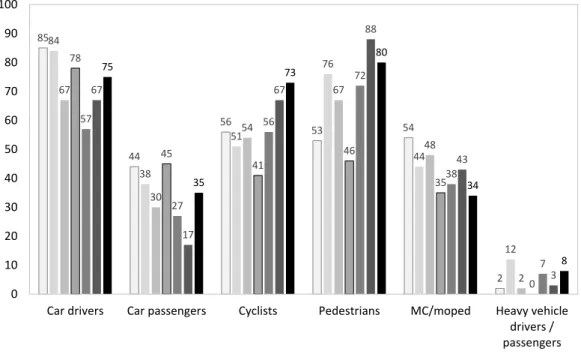
The development of the number of single motor vehicle accidents seems to support this hypothesis. The development of KSI numbers for different groups of road users is shown in figure 3.2.5.
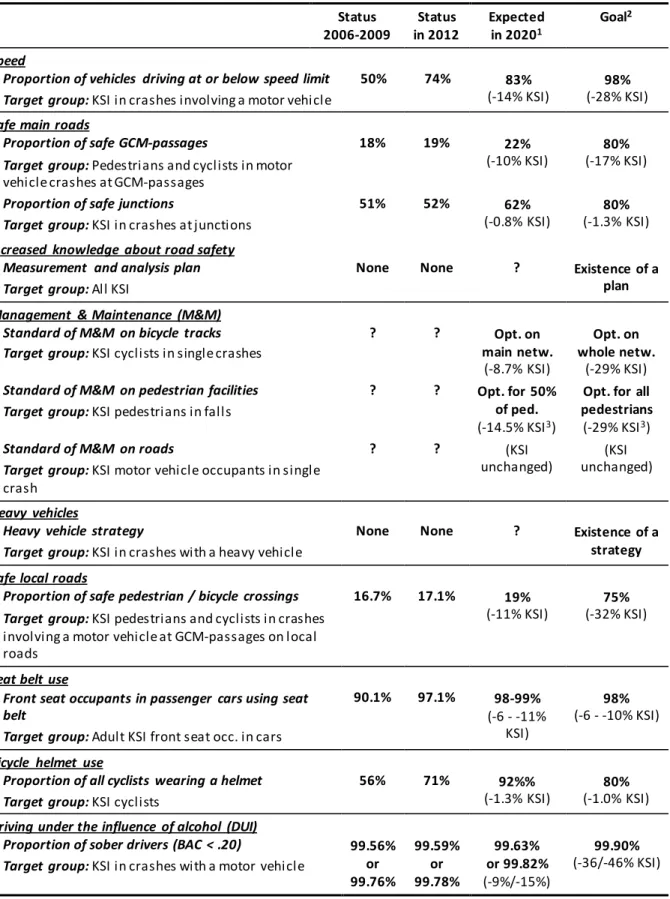
Speed
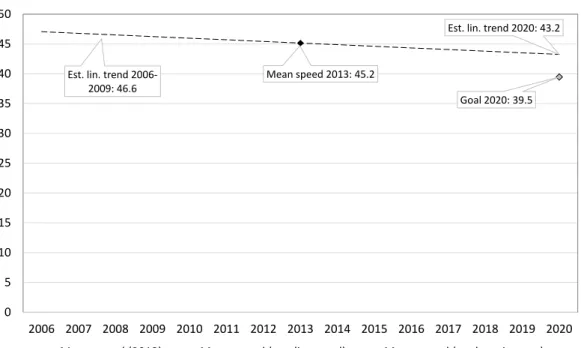
The percentage driving at or below the speed limit can be assumed to be related to the average speed. The proportions driving at or below the speed limit are not assumed to be affected by changes in the speed limit.
Safe main roads: Safe junctions and GCM-passages
These numbers are too imprecise to allow conclusions to be drawn about changes in the number of safe GCM crossings. To achieve the overall goal of a 40% reduction in the number of KSI in the target group for the safe main road indicator and taking into account. Expected effects: The effects on the safe main road indicator and on the number of KSI pedestrians at pedestrian crossings and intersections depend on the implemented measures.
GCM-passages” assumes a 10% reduction in the number of KSI pedestrians and cyclists in GCM crossings. This translates into a 5% reduction in the number of KSIs at all GCM crossings and crossings (based on the assumption that KSIs at GCM crossings are 50% of all KSIs at GCM crossings and crossings). Even among pedestrians and cyclists at GCM crossings, the target of a 40% reduction in the number of KSI is unlikely to be achieved.

Increased knowledge about road safety
The indicator for increased road safety knowledge among all those living or working in the city is not based on the analysis of Sørensen et al. Road safety measures are more effective when road users are informed about the purpose of the measures. Unfortunately, none of the measures or approaches have been empirically evaluated regarding the effect on road safety.
Trafikkontoret (2010) surveyed the city's 260 primary schools and identified schools with a specific need for road safety measures. School police are not mentioned as one of the possible measures that could contribute to the achievement of any of the objectives in the road safety programme. Increasing numbers of pupils walking or cycling to school can have adverse effects on road safety.
Management and maintenance (M&M)
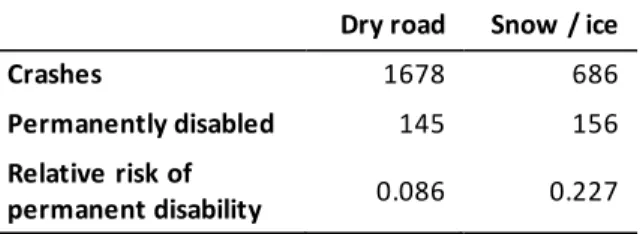
It is therefore assumed that the number of KSIs in single-vehicle crashes involving pedestrians and cyclists (falls) is reduced by 40% in winter (December to February). Resurfacing pedestrian and cycle paths can also reduce the number of KSI pedestrians and cyclists. The large increase in the number of KSI pedestrians is due to the increased reporting from hospitals.
From 2010 to 2012, the number of KSI riders in individual crashes was much higher than the estimated trend lines. 1 Estimated change in number of KSI cyclists/pedestrians in individual collisions/falls if everything but exposure remains unchanged at 2006-2009 levels. Projected KSI Number Changes: When reaching the target, the number of pedestrian and cyclist KSI in individual collisions/falls may be reduced by 21% if.
Heavy vehicles
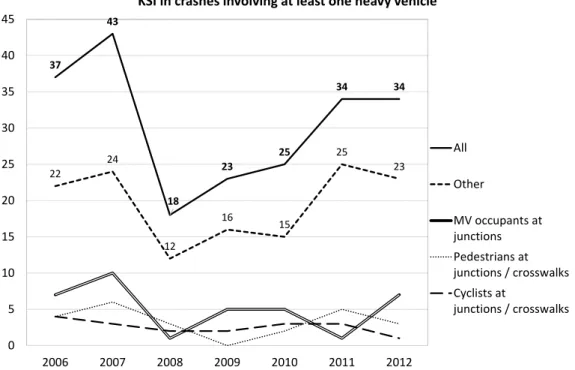
The annual KSI figures in accidents involving at least one heavy vehicle (the target group for the heavy vehicle indicator) in 2006 to 2012 are shown in Figure 5.5.1. There is great variation in the annual number of KSI in heavy vehicle accidents and no clear trend can be seen. The estimated trend lines show the expected number of KSI in heavy vehicle crashes if everything but exposure remains unchanged.
For the total number of KSI in heavy vehicle accidents, the goal seems to have already been reached. It is not possible to make any predictions about how the heavy vehicle indicator will affect the changes in the number of KSI in heavy vehicle accidents until 2020. It is therefore not possible to assess how such a strategy could affect the number of KSI in heavy vehicle accidents.
Safe local roads: Safe pedestrian and bicycle crossings
Target group: The target group for the indicator for safe local roads is all KSI pedestrians and cyclists in accidents with at least one motor vehicle at GCM passages on local roads. In other words, there is great potential for increasing the number of safe GCM passages on local roads. The target group for safe local roads is all KSI pedestrians and cyclists in accidents with motor vehicles at road junctions or pedestrian crossings on local roads.
Safe local roads: KSI pedestrians and cyclists in accidents with at least one motor vehicle at GCM passages. In order to estimate changes in the number of KSI in the target group for the indicator for safe local roads, several scenarios have been defined for changes to the indicator and for further measures. Safe local roads: KSI pedestrians and cyclists in accidents with at least one motor vehicle at GCM passages on local roads.

Seat belt use
Seat belt use is likely to increase due to the increase in the proportion of cars with seat belt reminders. In cars with seat belt reminder, seat belt use is estimated at 99% according to Folksam. 98.4% if only the increase in the proportion of cars with seat belt reminders contributes to the increase in seat belt use.
99% if seat belt reminders and increasing seat belt use in cars without seat belt reminders contribute to the increase. In general, seat belt use is higher in the rest of the country than in Stockholm city. The use of seat belts has increased in recent years and is likely to continue to increase.

Bicycle helmet use
Since no such information is available from Sweden, the Norwegian result is used to calculate the overall effect of bicycle helmet use on the number of KSI. It is not reasonable to assume that the rate of use of bicycle helmets will continue to increase linearly (it would reach over 100% in 2018). The use of bicycle helmets has been increasing in recent years and is likely to continue to increase.
In order to assess the changes in the number of KSI in the target group for the indicator wearing a bicycle helmet, the following scenarios for changes in the indicator were defined. Achieving goal A: The goal of using a bicycle helmet has been achieved, 80% of all cyclists wear a helmet. In summary, even if the target for the bicycle helmet wear indicator is likely to be met or exceeded, the number of KSI cyclists is likely to continue to increase as a function of increased cycling.

Driving under the influence of alcohol (DUI)
The endpoints of the two trendlines are taken as two possible scenarios for the development of the DUI indicator until 2020. The use of an alcolock for convicted drivers is not the responsibility of the municipality. To achieve the overall target of a 40% reduction in the number of KSIs by 2020, the number of KSIs in the target group for the DUI indicator would have to be reduced from 18 to 10.8.
1 Estimated change in the number of KSI in the target group if everything except exposure remains unchanged at the 2006-2009 level. The results in Table 5.9.2 show that the goal of reducing the number of KSI by 40% is likely to be achieved in the target group for the DUI indicator if the goal for the DUI indicator is achieved, regardless of the predicted change scenario. volume of traffic. Current measures and plans are most likely not sufficient to significantly reduce the amount of driving under the influence of alcohol.

Summary of scenarios
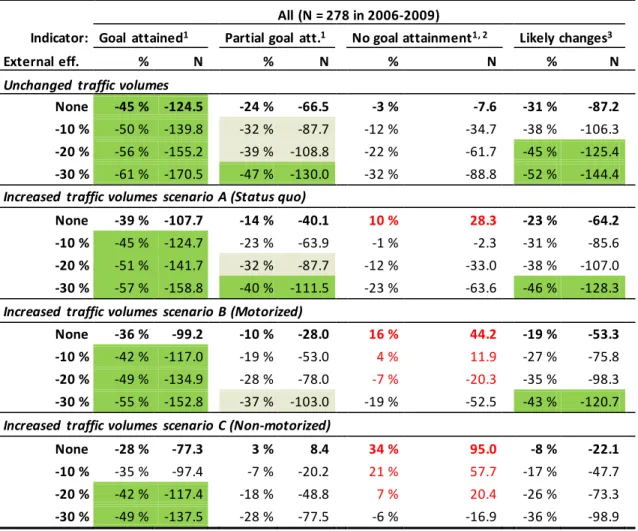
As in Sørensen et al. 2009) external effects of and - 30% are assumed as possible scenarios; external effects are consequences of measures not covered by the indicators and other changes that contribute to a reduction in the number of CSI. In order to achieve the goal of a 40% reduction in the number of police-reported CSIs in Stockholms city, the number of CSIs will have to be reduced. All scenarios in which the objective of a 40% reduction in the number of CSI is achieved are highlighted in green, scenarios in which a 40% reduction can be achieved with all additional effects are highlighted in light green.
When the targets for all indicators are reached and when there are externalities of at least -10% (at least -20% in scenario C, which predicts a larger increase in pedestrian and bicycle volumes). For pedestrians and cyclists, a 40% reduction in the number of KSI seems somewhat more unlikely than for motor vehicle occupants, and there are several scenarios that predict an increase in the number of pedestrian and cyclist KSI. 1Without additional effects; additional effects can contribute to a further reduction in the number of KSI by approx. 28.5.
Other factors that affect the number of KSI
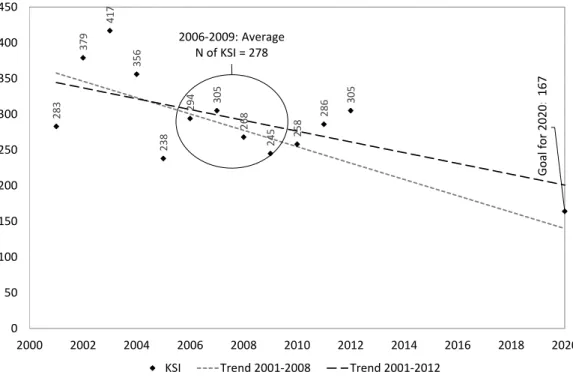
Other general developments such as changes in the number of young drivers (6% of the decrease). The fact that road safety in Sweden continued to improve after 2009 supports the assumption that the observed increase in the number of KSIs in Stockholm after 2009 is mainly due to random variation. The general downward trend in the number of KSIs observed up to 2009 is therefore not improbable.
The development of the economy in Stockholm is shown in figure 6.2.2 according to the share of the unemployed in the population aged 15 to 74 and in figure 6.2.3 based on data from Stockholms stad (2013) on the total number of unemployed and the population aged 16 to 64 . Thus, no significant contribution to the development of the KSI number can be expected. However, data on the shares of high-risk groups with a driver's license are not available, and if the share with a driver's license increases (or decreases) in any of these groups, this may contribute negatively (or positively) to the development of the number of KSI.

Conclusions
2 Status of the indicator in 2020 at the target (bold) and expected change in the number of KSI in 2020 in the target group if the target for the indicator is reached (in brackets). As can be seen in table 6.3.1 in section 6.3.1, none of the indicators is likely to reduce the number of ISI in the target group for the indicator by 40% (except perhaps the DUI indicator under the most optimistic assumptions). Reductions in the number of KSI will be smaller at larger increased volumes (-28% if pedestrian and bicycle volumes increase more than average).
Seat belt use: an indicator of seat belt use is likely to contribute to the reduction of KSI. According to the results for all indicators summarized in chapter 6.1, the goal of a 40% reduction in the number of KSI in 2020 is unlikely to be achieved unless there are significant externalities and traffic growth of no more than. Heavy vehicles: Heavy vehicles are not mentioned in any road safety plan so far.