The main emphasis has been comparison of recommended methods and assessments between the countries based on country reports from all the Nordic countries with the exception of Iceland. The values for nuisance from noise are based on studies of willingness to pay to avoid noise.
Climate effects
Recommended adjustments of assessments
The methods used to integrate effects without a monetary value
Considerations regarding the use of limited environmental goods
Sammendrag
Generelt om metodikk
Støy
Utslipp til luft
Norske verdier er direkte eller indirekte basert på VSL (Value of a Statistical Life), som er basert på betalingsvillighetsstudier. I Danmark er verdsettelsen basert på faktorer som kostnaden ved et ekstra tilfelle av bronkitt.
Klimaeffekter
Anbefalt justering av verdier over tid
Metodikk for å integrere miljøeffekter som ikke er prissatt
Vurderinger av begrensede miljøgoder
1 Introduction
2 A short overview of evaluation procedures in the Nordics
- Denmark
- Finland
- Iceland
- Norway
- Sweden
On 3 July 2020, the Ministry of Transport sent a letter to the transport agencies with a recommendation for the valuation of CO2 emissions in CBA in the national transport plan. The methods and values to be used in project evaluations in the transport sector in Sweden are recommended by the Swedish Traffic Agency in the so-called ASEK report.
3 Exchange rates, latest update of values and recommended
Exchange rates used in this report
Recommended adjustments of values and latest update
The ASEK 7.0 report (Swedish Transport Administration, 2020) recommends updating the values both with respect to CPI and GDP per capita. The combination of CPI and GDP per capita increase results in a total increase of 5%, which is used to update all the 2017 values in the tables in this report.
4 Methods and assessments of noise
Methods
- The value of annoyance/disturbance
- The value of health impacts
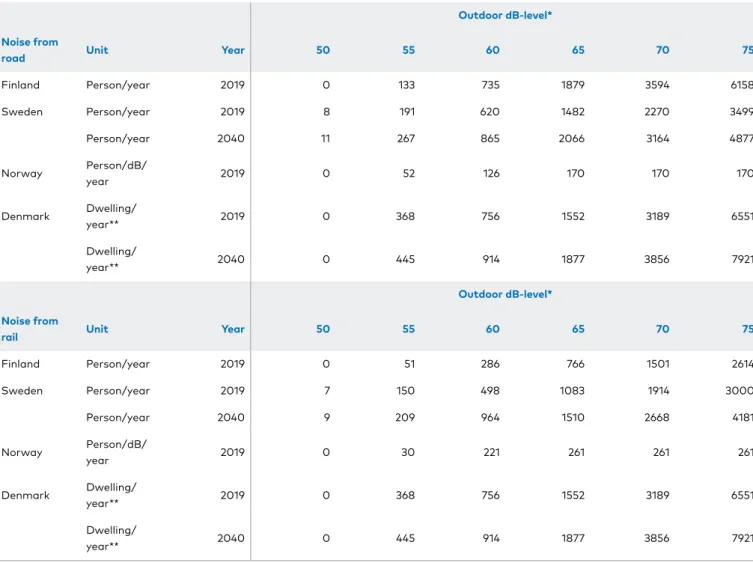
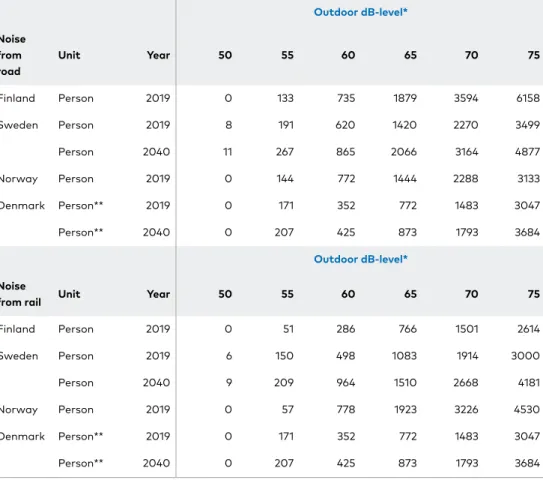
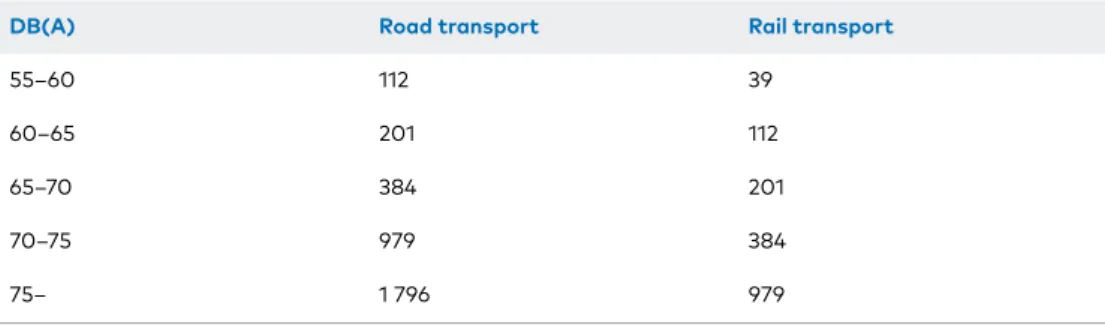
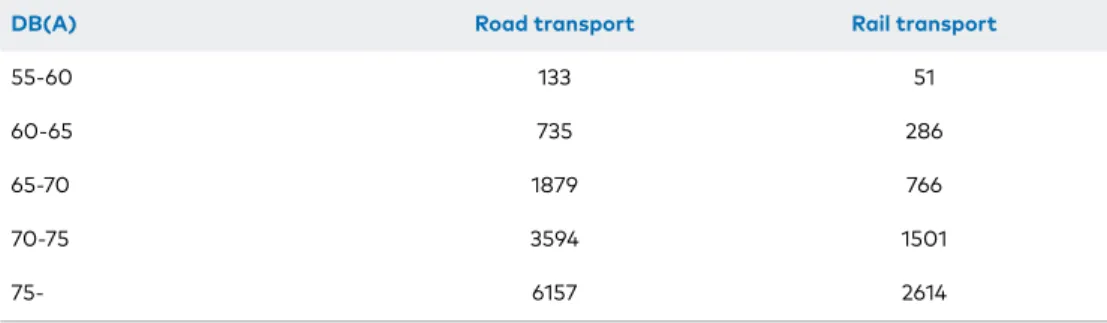
The valuation of noise from rail transport is based on the valuation of road transport. Accordingly, the cost of both road and rail noise is based on the social cost of road noise.
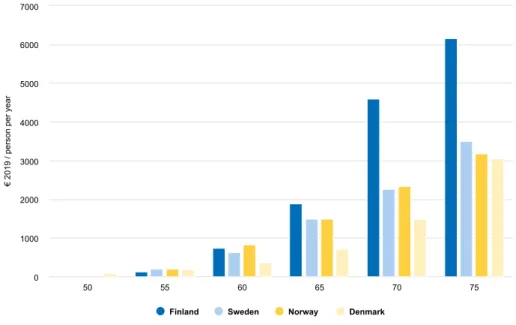
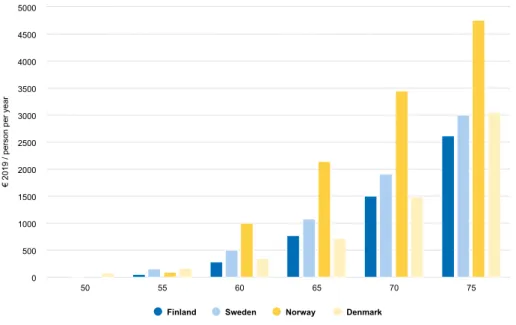
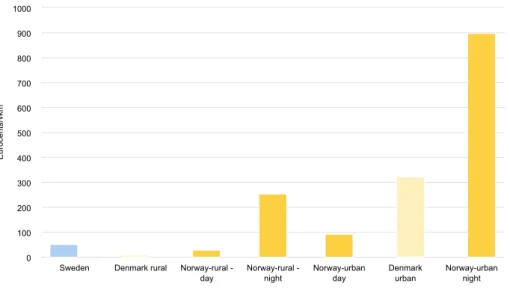
Recommended total values of noise
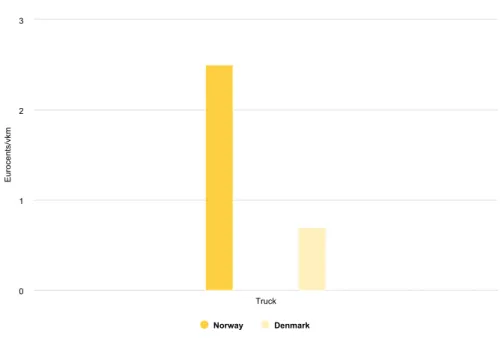
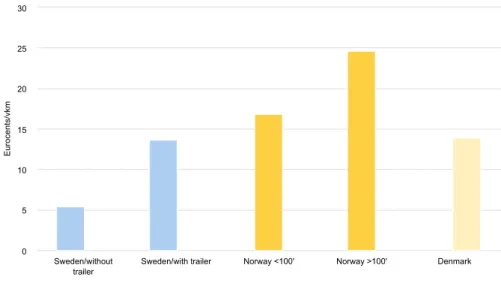
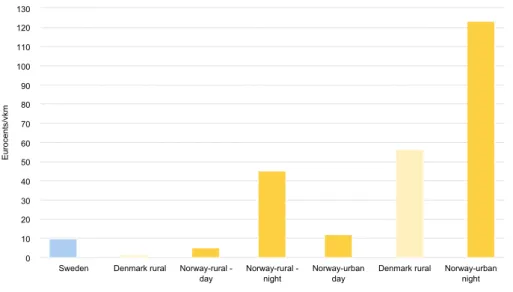
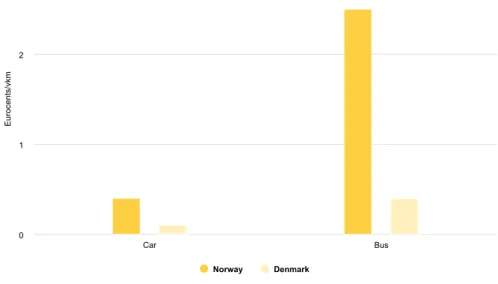
Recommended values of noise per vehicle km
Values are higher for freight trains than for passenger trains, higher in urban areas than in rural areas in Denmark and Norway, and in the case of Norway higher at night than during the day. In urban areas, Danish values are higher than Norwegian daytime values, and lower than Norwegian nighttime values.
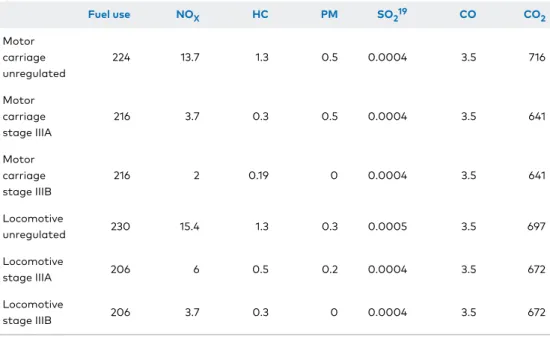
5 Emissions to air except climate emissions
- Calculation of emission factors per vehicle km
- Modelling the resulting exposure/concentration levels of pollution according to geographical area
- Monetary evaluation of damage
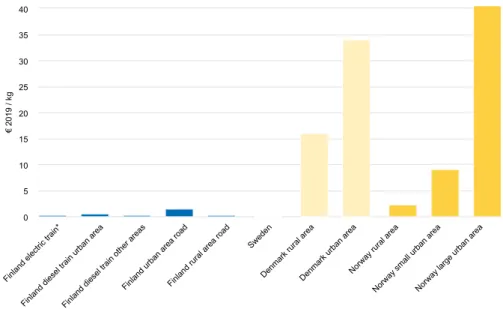
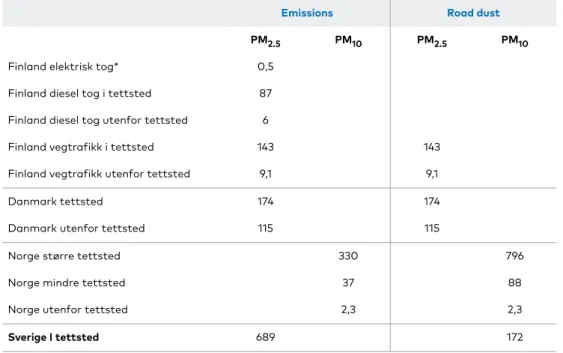
- Recommended values per kg of emission
- Recommended value of air pollution per vehicle km
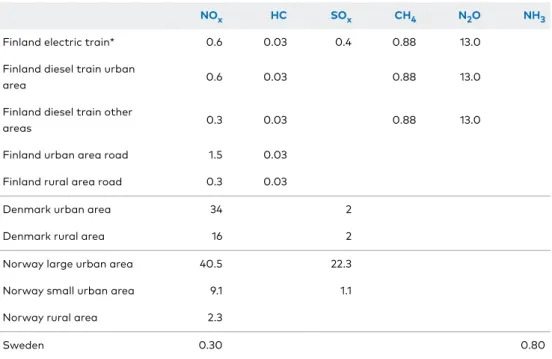
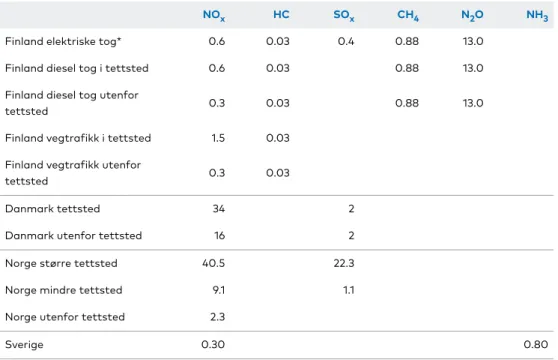
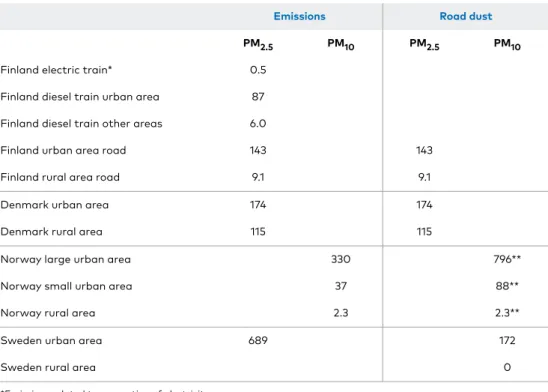
Recommended values for SO2 refer to cost estimates related to environmental acidification and damage to buildings. The actual recommended values for emissions excluding climate emissions in the Nordic countries in 2019 are shown in Tables 5.4 – 5.5 and illustrated in Figures 5.4 – 5.5.
6 Climate effects
Recommended values for climate emissions
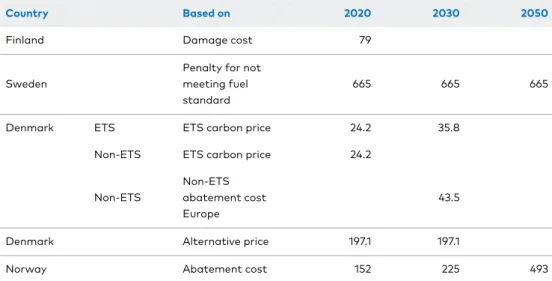
The value of CO2 equivalents used in Norway has so far been related to estimates of future prices of CO2 in the EU Emissions Trading System (EU ETS) in Klimakur. The estimates in Rødseth et al. agreement, where emissions of global warming must be limited to 1.5 degrees above pre-industrial levels. 2020) recommend a CO2 price of approximately NOK 1000/ton for emissions not included in the EU ETS in 2020, increasing with the discount rate in the future.
For sensitivity analysis purposes, the values NOK 500 and 2500/tonne should be used, at least in cases where the valuation is relevant to the outcome and/or the reduction of CO2 emissions is the main purpose of the project. Swedish values are much higher than those in other countries, but by 2050 the Norwegian value will exceed the Swedish value.
7 Overall comparison of valuation methods
The most extreme and important difference between the values in the Nordic countries concerns global warming emissions, where the values for emissions in 2020 vary from. The values differ marginally less for future emissions, as both Denmark and Norway use higher values for future emissions, but we are still looking at a variation of €45/ton CO2 in Denmark to. This is an extreme difference in the valuation of emissions, but Denmark also recommends an alternative price of €197/tonne CO2 equivalent, reducing the differences in valuation between the Nordic countries to €79/tonne for Finland compared to $665/tonne for Sweden.
This still represents a remarkable difference, as CO2 emissions from many other sectors have a common European price through the price of permits in the EU Emissions Trading System (EU ETS).
8 The methods used to integrate environmental effects without a
Denmark
Finland
Norway
Sweden
If time savings are the largest positive impact of the project and physical intrusion is the largest negative impact, it is possible to weigh the value of the intrusion against the travel time savings in a sensitivity analysis. Release of soil should be investigated in a sensitivity analysis and should not be considered in the main calculation to avoid double counting. For projects where winners and losers are separate groups, where the intervention is for an area of national interest, or where the intervention is not in conflict with saving travel time etc., ASEK (2018) concludes that expert assessment or an environmental impact assessment must form the basis for an assessment of the impact.
9 Considerations regarding the use of limited environmental
DENMARK
FINLAND AND SWEDEN
Hämtad från https://www.trafikverket.se/om-oss/var-verkehsam/sa-har-jobbar-vi-med/Fran-planering-till-byggande/. Uppskattning av icke-marginal betalningsvilja för minskning av järnvägsbuller: Tillämpning av tvåstegs hedonisk regressionsteknik.
NORWAY
The Paris Agreement (2015) https://unfccc.int/process-and-meetings/the-paris-agreement/the-paris-agreement. WHO Environmental Noise Guidelines for the European Region: A Systematic Review of Environmental Noise and Cardiovascular and Metabolic Effects: A Summary.
Treatment of External Effects from Transport in Denmark with
- Introduction
- Content of the unit prices
- The unit prices in Danish cost benefit analyses
- Noise
- Health costs
- Annoyance costs
- Total unit costs for noise
- Marginal noise costs
- Air pollution
- Unit air pollution costs
- Marginal air pollution costs
- Climate change
- Unit climate costs
- Marginal climate costs
- Other external costs
- Non-monetary effects
- References
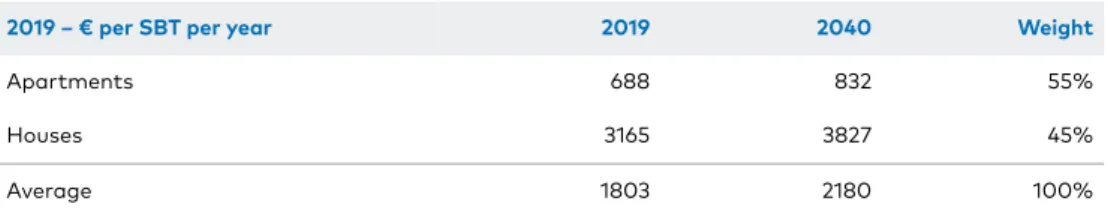
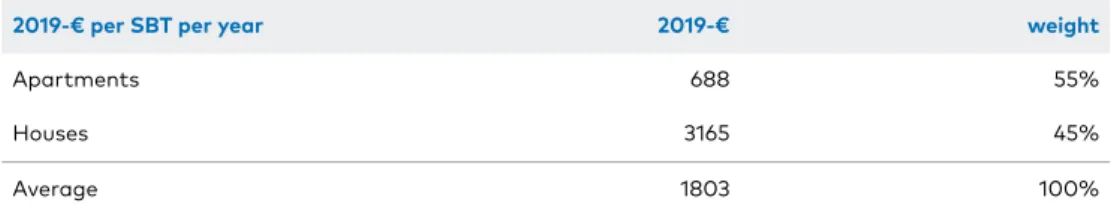
A consultant made a general update of the external costs for the Danish unit prices in 2010 (Transportministeriet, 2010), and many of the cost estimates are basically the same today. In addition, VSL has been revised since 2010 and the Danish Center for Environment and Energy (DCE, 2019) has made a revision of the air pollution costs and these are included in the current unit prices. The basis for the noise cost estimates is relatively old – the estimates were originally determined in 2003 and have since only been updated using inflation, GDP per capita growth and the current estimate for the value of statistical life (VSL).
The weighted average of the two house types is based on a weighting from the Danish mapping of noise-affected houses (Vejdirektoratet, 1998). The marginal costs are based on the above costs per SBT combined with detailed calculations of the increase in noise related to a marginal increase in traffic. Despite the general expectation of more fuel-efficient cars in the future, the emission factors will be kept constant after 2019.
Treatment of climate- and
Introduction
Finland
- Background
- Methodological considerations
- Recommended monetary values
- Noise
- Air pollution excluding carbon dioxide
- Carbon dioxide
- Methodology used for integrating effects without a monetary value
- Considerations regarding the use of limited environmental goods
The first guide to the unit values to be used in project evaluation in Finland was published in the late 1990s. The most recent update of the unit values used to do project evaluations for transport infrastructure investments in Finland is from 2012 (Gynther, et al., 2012). Factors taken into account when calculating the unit values of different types of emissions are their impact on health (morbidity and mortality), on vegetation (reduced growth of crops and forests), and the cost of climate change.
The value of health effects is partly based on market values from national accounts and health care costs. The value of a tonne of carbon dioxide used in Finland comes from the ExternE project (Bickel & Friedrich, 2001). Gynther et al., (2012) recommend that for projects far into the future, the value of CO2 should be gradually increased.
Sweden
- Background
- Methodological considerations
- Methodological considerations for the valuation of air pollution and carbon dioxide
- Recommended monetary values
- Noise
- Air pollution exclusive carbon dioxide
- Carbon dioxide
- Methodology used for integrating effects without a monetary value
- Considerations regarding the use of limited environmental goods
- Impact of extreme weather events
- Land use
The marginal cost of railway noise is based on the study discussed above by Swärdh et al. (2012), and the results were extended to include more train types and rail sections with different marginal costs. As with road noise, the most important factor in the marginal costs of rail traffic noise is the number of people affected. First, it is possible to evaluate the total actual environmental costs and exclude financial impacts (eg the cost of passenger taxes and tax revenue to the state).
The level in 1997 price terms together with the development of the valuation since is shown in Table B.3.11. The size of the average marginal cost for the whole country depends on how traffic is distributed in the road network. The marginal cost of emissions per liter of diesel is therefore the same regardless of the geographical location of the emissions.
Comparisons Finland – Sweden
Regardless, it is notable that the valuations in Finland differ between road and rail modes, with rail having a greater climate impact measured in euros per kilograms of emissions.
Treatment of climate and
Introduction
The assessment of monetary values of environmental and
- Noise
- Global emissions – effects of greenhouse gases
- Local emissions to air
- Calculation of emission factors for transport by transport mode
- Modelling dispersion of pollutants
- Modelling the resulting exposure/concentration levels of pollution according to geographical area
- Modelling exposure-response functions between concentration levels and health incidents
- Monetary evaluation of damage
- Emission costs per vehicle km
- Road transport
- Rail transport
- Air transport
- Maritime transport
- The methods used to
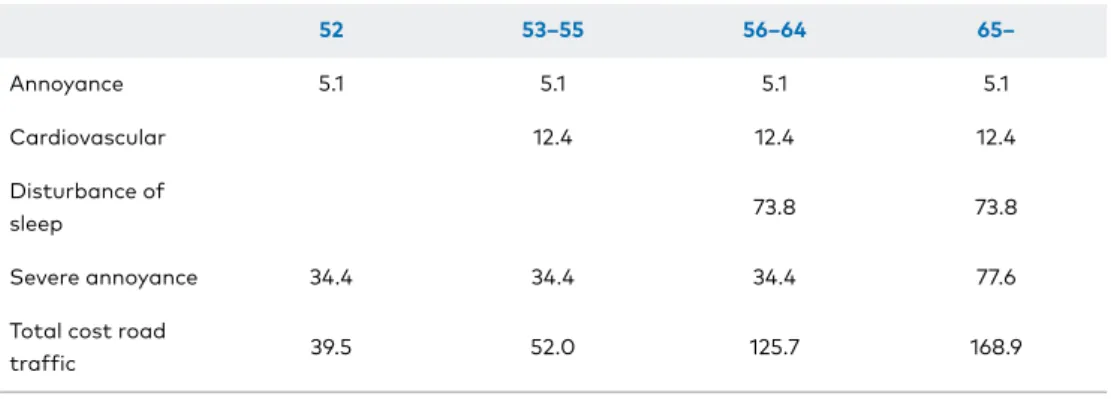
Traditionally, the value of noise used in the CBA in Norwegian transport is measured on the basis of willingness-to-pay surveys (to avoid nuisance caused by noise), often on the basis of collaborative analysis. Based on effect curves by Miedema & Oudshoorn (2001), the recommended exposure limit of noise nuisance per dB per person has been updated in Rødseth et al. Based on the estimated relationship between noise levels and the number of affected persons, the marginal health costs per dB per person per year are related to serious noise nuisance from road traffic calculated on dB) and dB).
Local emissions estimates are estimated based on damage costs due to health effects from air pollution. Emission factors for road transport are based on the HBEFA model (Swedish Transport Administration [2019b], Holmgren and Fedoryshyn [2015]), see table C.2.6. For example, 1 additional ton of PM released from emissions in Oslo will increase the PM concentration by 0.0075 mg/m3 as described in Table C.2.7 below.
Assessment of non-monetary environmental effects
Integration of assessments of non-monetary environmental effects
Considerations regarding the use of limited environmental
Verdivurdering av tid, sikkerhet og miljø i transportsektoren: Støy.TØI rapport, 1053e/. Hentet fra https://www.toi.no/getfile.php?mmfileid=17583.
Related literature
Update of values for Finland and Sweden
- Updating values
- Updated Finnish values
- Noise
- Air pollution
- Carbon dioxide
- Updated Swedish values
- Noise
- Air pollution
- Carbon dioxide
- References
The effects of air pollution are divided into three categories in ASEK 7.0: local, regional and global effects (Swedish Transport Administration, 2020). Previous values in the Swedish framework (ASEK 6.1 and earlier) are based on values from 1990 and have been updated according to economic growth. In the new ASEK 7.0 report, the methodology is revised, and the basis of the new.
Table D.3.5 and Table D.3.6 present the local and regional costs of air pollution as Euro per kg of emissions in 2019 prices. The air pollution valuation presented in Table D.3.5 and Table D.3.6 is updated with respect to the previous Swedish values, and the new values apply to better grades. Carbon dioxide and CO2 equivalent values have been updated according to ASEK 7.0 in Hammes (2020).
About this publication
Transport infrastructure investment –