Investigation of current crisis phenomenon in continuous electrode plasma accelerator channel within the framework of both.
POSTER SESSION
KEY EXPERIMENTS IN PLASMA-AERODYNAMICS TODAY
Klimov A, Bityurin V., et.al., Plasma-assisted unmixed combustion in high-velocity vortex air flow, Proc. Opaits D., Macheret S., Shneider M., et.al., Experimental investigation of DBD plasma actuators driven by repetitive high-voltage nanosecond pulses with DC or low-frequency sinusoidal deflection, 38. Plasmadynamics and.
JET NOISE CONTROL BY NOZZLE SURFACE CHFD ACTUATOR
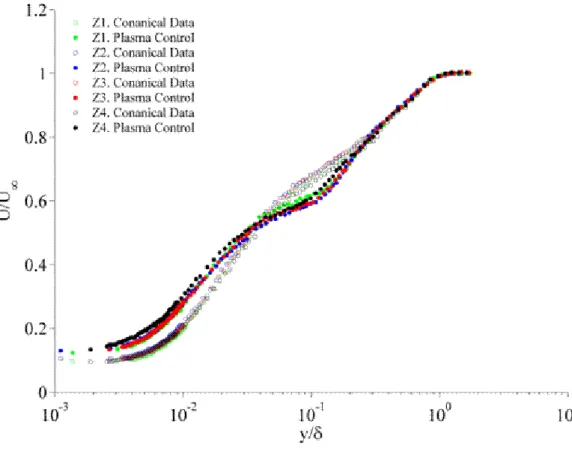
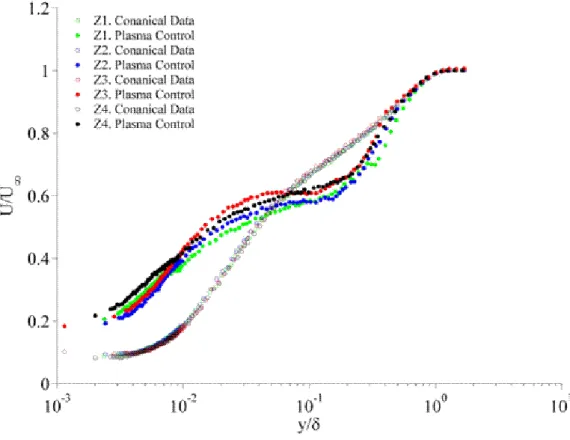
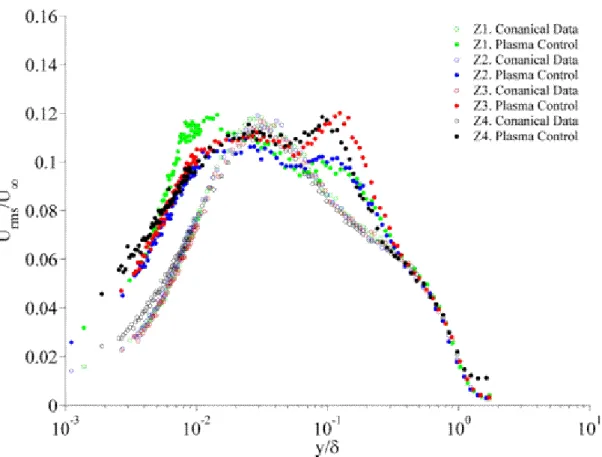
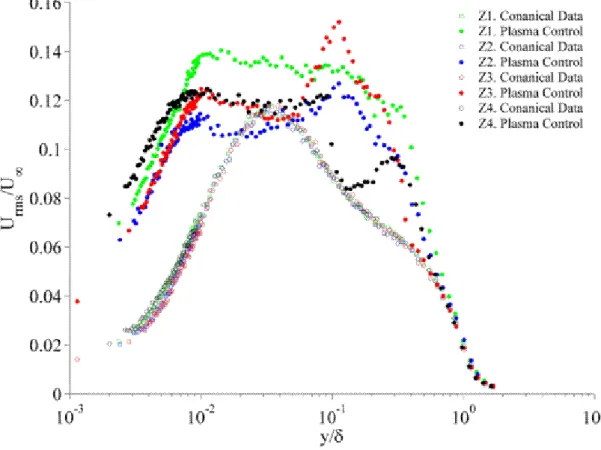
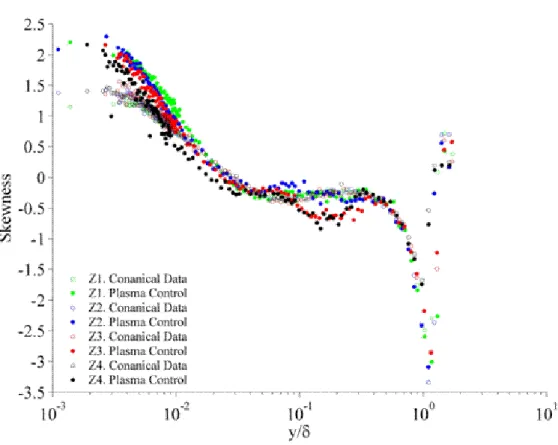
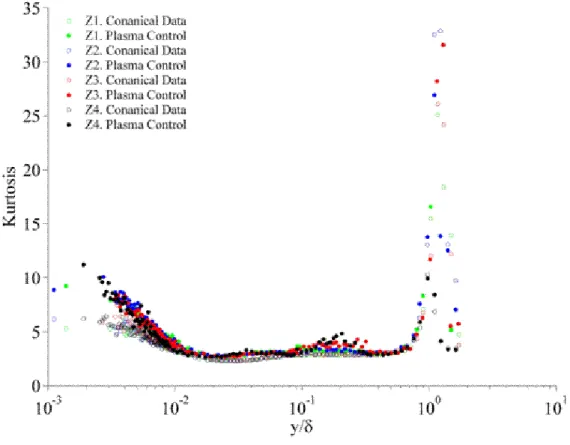
TURBULENT BOUNDARY LAYER CONTROL BY SPANWISE TRAVELLING WAVES CREATED BY DBD PLASMA ACTUATORS
Introduction
It has been shown27 that scrubbing events are the main contributor to skin friction in the turbulent boundary layer. From the literature reviewed, we expect to see a skin friction drag on the order of 30% with.
Experimental Setup
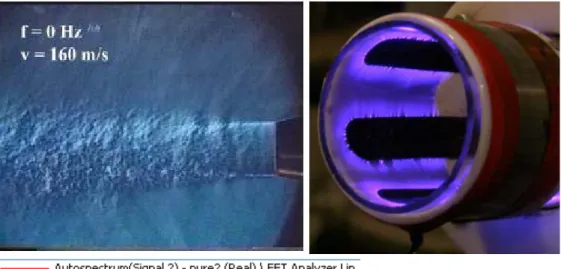
The measurements are taken another 2.3 m downstream of the journey, where the turbulent boundary layer is fully developed. During the boundary layer experiments, the sinusoidal voltage input to the plasma supplies is varied from 6.3-7 kVp-p at a fixed frequency of 25 kHz, requiring up to 12 supplies.
Results and Discussion
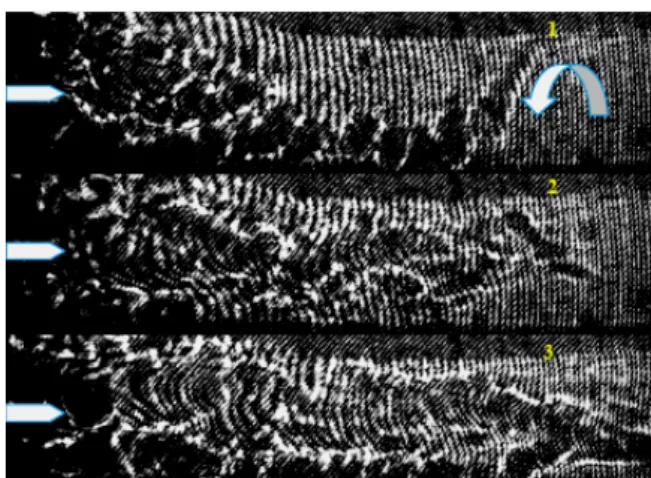
Secondary vorticity is generated at the wall which is moved in the direction of the traveling wave. It shows that there is a change in near-wall structure of the turbulent boundary layer due to different forcing configuration.
EFFECT OF A HEAT SOURCE ON THE EVOLUTION OF A CYLINDRICAL VORTEX
It has been shown that the intensity of the cylindrical vortex decreases due to the influence of the thermal source. The proposed method can be used for further investigation of the effect of heat flux on vortex structures.
STUDY OF A LONGITUDINAL CAPACITY COUPLED HF DISCHARGE IN A SWIRL AIRFLOW
Boytsov A.Yu., Klimov A.I
- Experimental setup
- Results and discussion
- Discharge parameters
- Electric field distribution
- Discharge evolution in time
- Conclusions
- References
It should be noted that OH emissions are mostly obtained in areas close to the discharge core. The distribution of the HF field amplitude along the discharge channel was measured with a capacitive probe.
PROPERTIES OF DC DISCHARGE NEAR SURFACE IN SUPERSONIC GAS FLOW AT LOW GAS PRESSURE
Schweigert
The peak values of mean electron energy and ionization rate are reached at the boundary of the cathode sheath. The electron energy distribution exhibits nonlocal behavior as a function of electric field strength, and ionization occurs outside the cathode sheath.
SLIDING SURFACE DISTRIBUTED NANOSECOND DISCHARGE IN THE LAMINAR AND IN THE TURBULENT BOUNDARY LAYER
In the turbulent region of the boundary layer, the discharge radiation becomes inhomogeneous with the separate curved plasma channels. It was shown that the energy input to the region of the boundary layer of gas is comparable to the enthalpy of the gas behind the shock wave.
PECULIARITIES OF FLOW PAST BODIES IN THE PRESENCE OF STEADY AND PULSING TOROIDAL-TYPE UPSTREAM ENERGY
DEPOSITION
Formulation of the problem
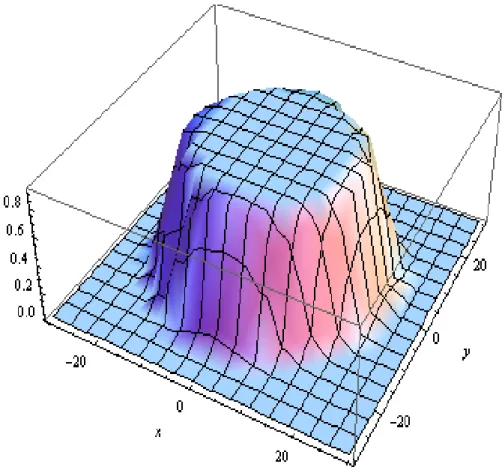
Scales for different physical parameters can be combined with the basic scales: p∞,ρ∞ – the static pressure and density of the undisturbed upstream flow and l∞ – a linear scale (typically the radius of the center part of bodies). 1 The supersonic flow along the sphere in the presence of energy deposition of the toroidal type: formation of a front separation zone (a), temperature wake “explosion” (b), pulsating separation zone (c).
Regimes of steady flows for toroidal-type ener- gy deposition
Pulse-periodic regimes of toroidal-type energy deposition
The critical period duration is proportional to the extension of the energy deposition region. Depending on the geometry of the energy deposition region and the body, different regimes were observed.
THERMAL CHOKING OF A CYLINDRICAL OR SPHERICAL MASS SOURCE
- Statement of the Problem
- Asymptotic Solution Near a Peculiar Point Let us build up asymptotic expansions of
- Circulation Influence on the Thermal Crisis in a Cylindrical Mass Source
- Transition Through Sonic Speed
In the case of the source, the spatial expansion therefore opposes Mach number variation due to heat addition. In Figure 9, critical energy parameter values E* are presented as a function of the adiabatic index γ in the case of heat input law (19) at the maximum mass flow (curve 1, circulation is Γ=0) and at.
![Figure 2. Spherical source flow to the stagnation zone, n=2, γ =1.4, uniform heat addition f= C =3/[4 π (r 2 3 - r 1 3 )]](https://thumb-eu.123doks.com/thumbv2/pdfplayernet/427072.46506/62.892.112.332.330.575/figure-spherical-source-flow-stagnation-zone-uniform-addition.webp)
SPECIFIC FEATURES OF SUPERSONIC STREAMLINING FOR ASYMMETRICAL ENERGY SUPPLY INTO EXTERNAL FLOW
- Introduction
- Statement of the problem
- Results
- Asymmetrically located limited length filament: “heat piston” effect and drag force
- Asymmetrically located limited length filament: “heat piston” effect and drag force
- Asymmetrically located infinite filament / shock layer interaction
- The mechanism of lift/pitch force origination in the case of zero attack angle
- Numerical analysis of periodical steady flow structures accompanying shear layer instability
- Conclusions
10 shows the dependence of the drag force on the front surface on the defining filament parameters (αρ, Δl and y). The location of the stagnation point at the front of the body is lower and the drag force reduction is greater at larger values of y/D.
THE INFLUENCE OF AN ELECTRIC DISCHARGE ON THE FLOW PATTERN OF SUPERSONIC IMPACTING JET
Experimental facility
Energy input into the supersonic flow is organized with the help of an electrode system; as one of the electrodes the nozzle lip or the barrier can be used. A simplified gas dynamic pattern of the jet flow: D – nozzle outlet diameter; Xc – distance from the nozzle.
Experimental results
The influence of the nozzle-barrier separation h/D on the oscillation frequency of the arc shock wave d/D=1.0 and. The effect of electrical discharge on the frequency of oscillation of the arc shock wave for various.
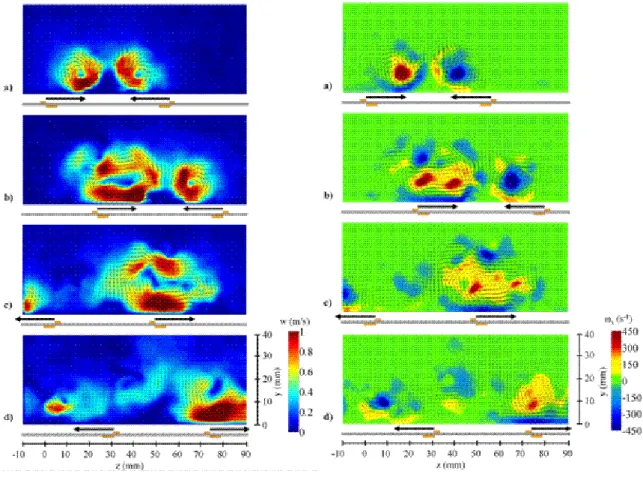
INVESTIGATION OF VORTEX FLOW INDUCED BY DIELECTRIC BARRIER DISCHARGE IN QUIESCENT AIR
The investigation of unsteady gas flow was carried out using the same methods described above. The schlieren visualization and PIV measurement at time 2 ms after the discharge starts with the amplitude of voltage 3 kV.
TO A THEORY OF GAS DISCHARGE WITH COMPLEX KINETICS IN FREE SPACE
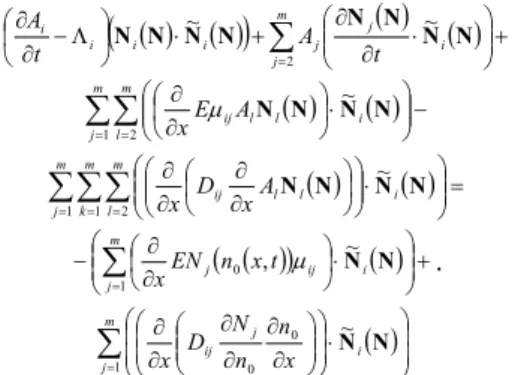
- The multicomponent diffusion equation 1 Initial system of the equations
- The unicomponent diffusion equation with nonlinear source
- The complicated system of the equations 1 Full system of the equations
- Example of calculation of effective diffusion and birth coefficients of particles for two-
The behavior of the system of the equations (1) at n→n1 can be found using Fourier transform δN( )x,t =∫dkδN( ) ( )k,texpikr, where. Moreover, there may be a question about the uniqueness of the solution of the system of equations (20).
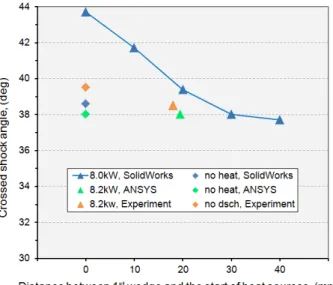
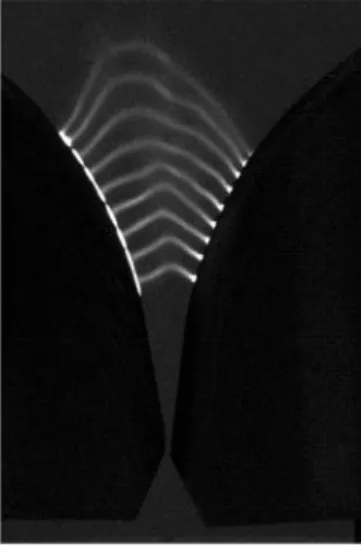
NUMERICAL SIMULATIONS OF SUPERSONIC FLOW IN CONVERGENT-DIVERGENT DUCT WITH DICSHARGE SUPPLY
Increasing the distance between the 1st wedge and the location of the electrodes not only results in a decrease in the crossed impact angle. The variation of the location of the heat sources leads to significant modification of the resulting flow structure, in particular an increase of the distance between the 1st wedge and the location of the electrodes results in a decrease in the crossed impact angle.
NONSTEADY-STATE BEHAVIOR OF A “GLIDING ARC” IN AIR FLOW
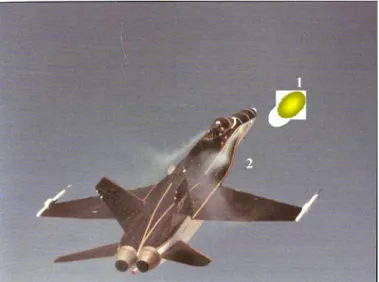
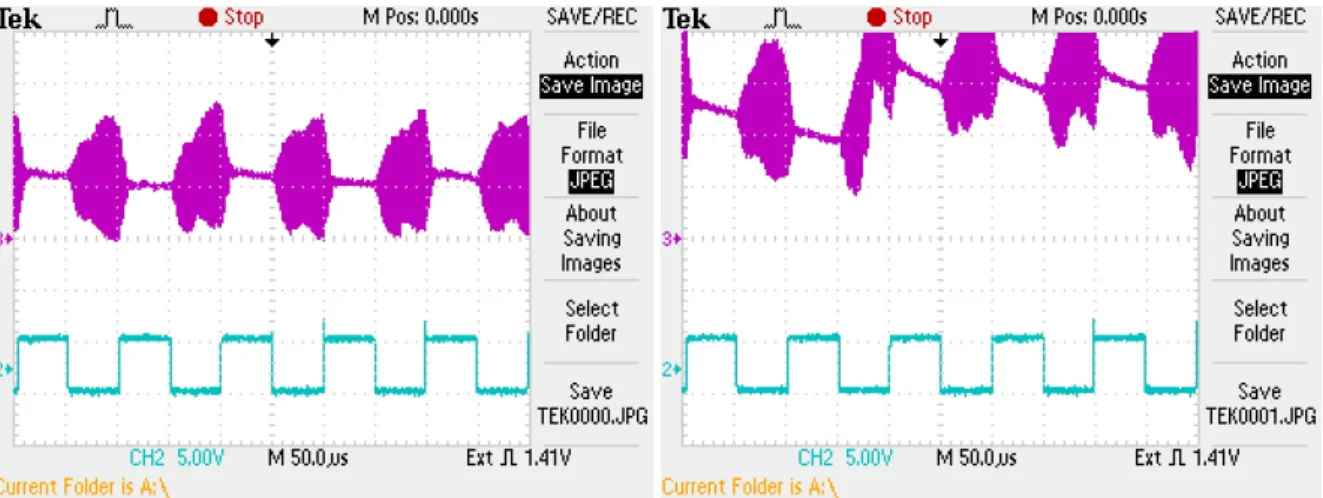
The above data were obtained in the experiments by recording the current and voltage waveforms together with the photography of the discharge image by the CCD camera. Voltage and current waveforms and gap CCD frames at different time instants (exposure time − 50 µs, V0=3 kV, gas flow 0.1 g/s).
INVESTIGATIONS OF THE EROSIVE TYPE DISCHARGE
PARAMETERS INFLUENCE ON THE PROCESS OF THE PLASMOIDS FORMATION
Description of modeling approach
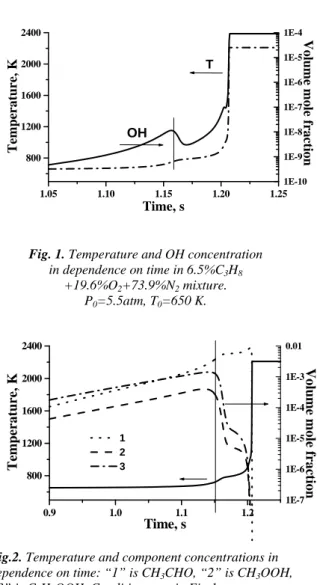
The analysis of leading reactions of cool flame stage in C3H8:O2 and C3H8:air mixture showed that the preferred mechanism of formation of organic peroxide under conditions of alkyl radical production by discharge becomes the way through the formation of propyl peroxy radicals iso-C3H7O2 and n- C3H7O2. With assisted ignition on discharge, the cool flame induction time is observed both for rich mixture and close to stoichiometric.
Conclusion
NUMERICAL STUDY OF PLASMA INITIATED IGNITION STAGES FOR ETHYLENE-AIR MIXTURES
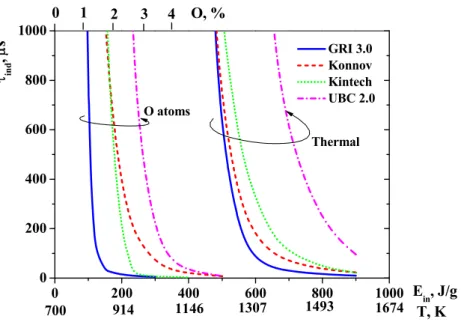
The amplitude of the gas temperature increase (T = 255 K) at time zero was suitable to have almost the same induction time as in the case of initiation by O atoms. Calculated induction time as a function of the SEI for initiation by thermal heating, pulse discharge with.
PROCESSES RESPONSIBLE FOR NEAR-THE-AXIS IGNITION OF METHANE-OXYGEN MIXTURE BY MEANS OF RING-SHAPED
ELECTRIC DISCHARGE
- Experimental layout
- Experimental results
- Discussion of experimental results Analysis of experimental results allows us to
- Conclusions
15, the time corresponding to the maximum intensity of the OH band (see Fig. 8) is plotted as a function of the energy released in the ring discharge. At this point, the gas-dynamic response of the medium to the annular discharge ceases.
ULTRA–LEAN FLAMES STABILIZATION BY HIGH–VOLTAGE NANOSECOND PULSED DISCHARGE
Ultra–lean flame stabilization tests
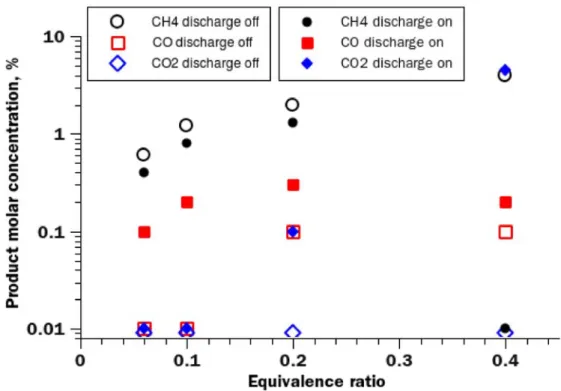
Non-thermally created radicals initiated chain reactions within times shorter than that of gas mixing, efficiently igniting the stream in the afterglow of the nanosecond spark. When the drain was off, the CO, CO2 and CH4 levels were 0-0.1%, which proved that no oxidation occurred on the surface of the steel evaporator.
Discussion
With a similar energy input, most of the heat would have dissipated before ignition occurred. For example, a twofold increase in energy deposition reduces the ignition delay time by more than two orders of magnitude.
Conclusions
This efficiency gain demonstrates the high sensitivity of the ignition efficiency to the geometry of the plasmatron, providing scope for design optimization under different operating conditions. Y., “Simulation of the ignition of a methane-air mixture by a high-voltage nanosecond discharge,” Plasma Physics Reports, Vol.
THE EFFECT OF NONEQUILIBRIUM EXCITATION ON THE IGNITION OF HYDROGEN-OXYGEN MIXTURES
A. Popov
- THE EFFECT OF HYDROGEN AND OXYGEN ATOMS ON THE IGNITION OF
- THE EFFECT OF O 2 (a 1 Δ g ) ON THE IGNITION DELAY TIME AND THE
Here we analyze the influence of the obtained data on the rates of reactions involving singlet oxygen (3-5) on the ignition of hydrogen-oxygen mixtures. The contribution of the chain branching reaction (3) is also small at the given temperatures [47].
![Fig. 1. The chain length in a mixture of H 2 : O 2 = 2 : 1 at P = 20 torr and discharge current I = 150 mA as a function of the initial temperature of gas: the points indicate the experiment of [21], the curve - calculation,](https://thumb-eu.123doks.com/thumbv2/pdfplayernet/427072.46506/142.892.470.788.335.558/mixture-discharge-current-function-temperature-indicate-experiment-calculation.webp)
LIQUID AND GASEOUS HYDROCARBON FUELS IGNITION IN THE AIR STREAM WITH THE HELP OF A DISCHARGE
CREATED IN A PROGRAMMABLE PULSE MODE
- Experimental Installation
- Mathematical Modeling
- Conclusion
- Acknowledgments
- References
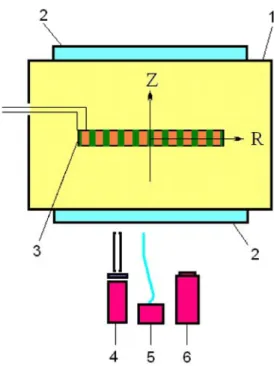
It can be performed when creating a discharge in the programmable pulse mode [1]. Points (1)-(4) show the position of the pressure gauges, and point (5) shows the position of the electrodes for generating a DC discharge.
LOW-ENERGY ELECTRON ATTACHMENT AND DETACHMENT IN VIBRATIONALLY EXCITED OXYGEN AND AIR
- Theoretical approach
- Validation of theoretical approach
- Electron attachment in vibrationally excited oxygen
- Electron detachment in vibrationally excited oxygen
- Plasma production and decay in vibrationally excited oxygen-containing mixtures
- Conclusions
The rate constant of three-body electron binding to O2(v = 0) (v is the vibrational quantum number) can be written as [10, 11]. The three-body electron binding rate constant to O2(v), ka(v), at T = 300 K as a function of the characteristic electron energy, 3D/2μ.
MODELING OF TOLUENE CONVERSION IN NON-THERMAL NITROGEN PLASMA
Dependence of the byproduct concentration at the reactor outlet on the specific energy input. Comparison of the results of numerical calculations performed in the framework of this model with experimental data [2] on the degree of removal of toluene, its composition and concentration of by-products.
DETONATION INITIATION THROUGH A GRADIENT MECHANISM WITH APPLICATION OF NONEQUILIBRIUM NANOSECOND
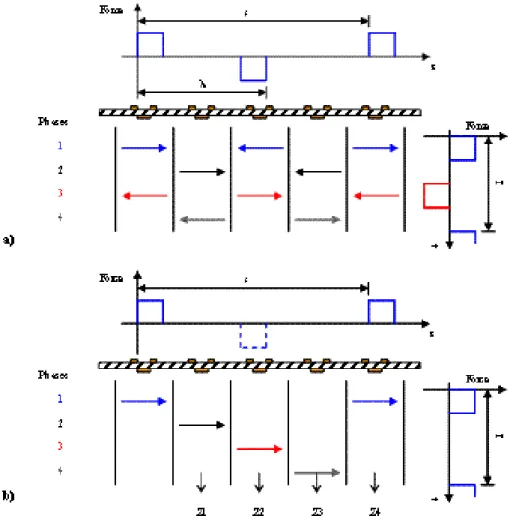
Discharge Development: Gradient Shape The construction of the four–cell discharge
However, the discharge was expected to develop similarly in all the channels due to the symmetry of the chamber. An estimation of the concentration gradient of the O atoms along the interelectrode gap was obtained by integrating the intensity over the discharge duration.
Gradient Mechanism Under Different Conditions
For a clear comparison, data points for the experiment in a transient mode at 0.2 bar under 2 J of energy input are shown in the same figure (blue square). Additionally, an x-t diagram of the experiment at 1 bar in the same mixture at DC with a cell is shown in the same figure for comparison (gray line).
Discussion of Experimental Results
Propagation of the spontaneous combustion wave inside the exhaust channel at this pressure is shown in Fig. Optimization of Deflagration to Detonation Transition: Reduction of Length and Time of Transition," Shock Waves, Vol.
SUBMICROSECOND DISCHARGE IN NONHOMOGENEOUS MEDIA AND IN HIGH-SPEED FLOW
Lateral jets formation
The strongest cumulative flow is clearly associated with the curvature of the initial plasma channel. On concave sides of the plasma channel, the shock wave propagation results in strong compression followed by strong rarefaction behind the shock.
Discharge localization
A typical schlieren pattern of a discharge breakdown in the presence of two gases is shown in Fig. This statement is confirmed by measuring the history of E/N and the resistance of the discharge channel in the high current phase of the discharge.
Filamentary high-power discharge in high- speed flow
The shock wave is generated in the aircraft in the supersonic flow as seen in Fig.18, but the exhaust does not "feel" it. Schlieren pictures of the interaction of the discharge with the CO2 stream and the He jet in the subsonic air flow (M=0.3) at different delays are shown in Fig.10.
THE FORMATION OF POSITEVELY CHARGED PLASMA STRUCTURE IN NANOSECOND DISCHARGE WITH SLOT
CATHODE
Since the bulk of fast electrons, from the sides of the slot, make oscillatory motion in the cavity, they produce additional ionization. With the disturbance of neutrality, there appears an internal electric field which is directed towards the center of the area with excessive positive volume discharge and which greatly increases the external field.
REMARKS ON GROUND-BASED MHD EXPERIMENTS
- Problem Magnetohydrodynamic Interaction in Electromagnetic Tube [3]
- Problem 2: MHD Interaction in Non- Equilibrium Argon Plasma Flow [4,5]
- Problem 3: The Newest Experiments in Argon Plasma Flow [1,2]
- Problem 4: MHD Interaction in Seeded Airflow [8]
The stability of the MHD flow behind the secondary shock can be seen in Fig. Another feature of MHD interaction is considered to be a decrease in the surface heat flux.