LOCAL DISTRIBUTION AND ACCUMULATION OF POLYCYCLIC AROMATIC HYDROCARBONS (PAHs) IN THE ARCTIC SNOW COVER, BARENTSBURG, WESTERN SPITSBERGEN
Master Thesis
M.Sc. Program for Polar and Marine Science POMOR
Saint Petersburg State University / Hamburg University by Elena Mikheeva
Saint Petersburg / Hamburg 2017
2 LOCAL DISTRIBUTION AND ACCUMULATION OF POLYCYCLIC AROMATIC HYDROCARBONS (PAHs) IN THE ARCTIC SNOW COVER, BARENTSBURG, WESTERN SPITSBERGEN
Elena Mikheeva
Master Program for Polar and Marine Sciences POMOR / 022000 Ecology and environmental management
Scientific supervisors:
Dr. Anna Nikulina, Arctic and Antarctic Research Institute, Russian Scientific Arctic Expedition on Spitsbergen archipelago
Dr. Richard Seifert, Universität Hamburg, Center for Earth System Research and Sustainability (CEN)
Abstract
The study of polycyclic aromatic hydrocarbons in the upper snow cover was conducted in small mining town Barentsburg located at Spitsbergen archipelago.
Specific climate and orographic conditions as well as distance from major PAH sources make Barentsburg ideal for assessment of local anthropogenic contamination. The study was focused on short-termed distribution of PAHs rather than accumulation in snow cover. Upper snow cover contained PAHs of local pyrogenic and petrogenic origin. In dependence of sampling site location prevailed one of them. Total concentration of PAHs in both dissolved and particulate fractions ranged within town from 63.72 ng/L along cargo road to 578.51 ng/L near the coal combustion power plant. In the mixture of PAHs phenanthrene was dominant in both aquatic form and bonded with particulate matter. This compound is quite stable and is released during non-complete coal combustion as well as by diesel/gasoline combustion by snowmobiles and autos. Heavier compounds, like dibenzo[a,h]anthracene and benzo[a]anthracene were found only bound to particulate matter in concentrations of 15.83-43.43 ng/L and 12.97-90.51 ng/L of meltwater correspondingly. The main areas of their distribution are coal storage and power plant. Small amounts of particulate benzo[a]pyren were found in snow of scooter parking areas and near power plant. Others pollutants, as acenaphtylene having high photochemical reactivity, are apparently transformed into others compounds in short time and not detectable at all. For areas, almost restricted from the local influence of PAH pollutants (background areas) selected PAHs levels did not exceed detection limits.
3 МЕСТНОЕ РАСПРЕДЕЛЕНИЕ И НАКОПЛЕНИЕ ПАУ В АРКТИЧЕСКОМ СНЕЖНОМ ПОКРОВЕ, БАРЕНЦБУРГ, ШПИЦБЕРГЕН
Магистерская Программа Полярные и Морские Исследования / 022000 Экология и Природопользование
Научные руководители:
Др. Анна Никулина, Арктический и антарктический научно-исследовательский институт, Российская научная арктическая экспедиция на архипелаге Шпицберген
Др. Рихард Зайферт, Университет Гамбурга, Центр исследования и устойчивости Наземных Систем
Аннотация
Поселок Баренцбург, расположенные на архипелаге Шпицберген, был выбран для исследования полициклических ароматических углеводородов (ПАУ) в поверхностном снежном покрове. Особенные климатические и орографические условия, наравне с удаленностью от основных массовых источников ПАУ, делают Баренцбург идеальным для оценки местного антропогенного загрязнения. Данное исследование сфокусировано в большей мере на кратковременном влиянии ПАУ в снежном покрове и их распределении в зависимости от локальных источников, чем на накоплении. В снеге городской зоны были обнаружены ПАУ как пирогенного, так и петрогенного происхождения. В зависимости от места отбора проб, наблюдалось преобладание одного или другого типа загрязняющего вещества по происхождению. Общая концентрация ПАУ как в растворенных фракциях, так и связанных со взвешенным веществом, в городской области колебалась от 63,72 нг/л вдоль грузовой дороги до 578,51 нг/л талой воды вблизи электростанции, работающей от сжигания угля. Фенантрен в смеси ПАУ доминирует как в водной форме, так и в связанном с взвесью состоянии. Это соединение является довольно стабильным и выделяется не только при неполном сжигании угля, но и при сгорании дизельного и бензинового топлива в двигателях снегоходов и автомобилей. Более тяжелые соединения, такие как дибензо(a,h)антрацен и бензо(а)антрацен, были обнаружены в концентрациях 15,83-43,43 нг/л и 12,97-90,51 нг/л в соединении с твердыми частицами и в талой воде соответственно. Основными местами, в которых эти соединения были обнаружены, являются хранилище угля и район около электростанции.
Незначительные концентрации бенз(а)пирена во взвешенном веществе были найдены в снежном покрове в городе в местах стоянки снегоходов и у ТЭЦ.
Другие загрязняющие вещества, такие как аценафтилен, обладают высокой фотохимической активностью, и, по-видимому, за короткое время деградируют в другие соединения, вследствие чего в смеси не обнаруживаются. Для районов, в которых воздействие загрязняющих веществ ограничено (фоновые области), концентрации определяемых ПАУ не достигают пределов количественного определения.
4 Table of content
List of abbreviations ... 5
Introduction ... 6
PAHs sources in the environment ... 8
PAHs properties ... 10
PAHs in the Arctic ... 12
PAHs regulation ... 15
Recent PAH studies at Spitsbergen ... 17
Methods ... 20
Sampling campaign ... 21
Sample processing ... 22
Measuring and result processing ... 24
Results... 26
Discussion ... 29
Power plant influence ... 31
Snowmobile route and Cargo road ... 32
Town sites ... 34
Source apportionment ... 37
Light influence on PAHs transformation ... 39
Conclusions ... 42
Acknowledgments ... 43
References ...44
Appendix 1...52
5 List of abbreviations
PAH Polycyclic aromatic hydrocarbons NAPH Naphthalene
ACY Acenaphthylene ACE Acenaphthene FLU Fluorene PHEN Phenanthrene ANTH Anthracene PYR Pyrene FLT Fluoranthene CHR Chrysene
BaP Benzo[a]pyrene BbF Benzo[b]fluoranthene BkF Benzo[k]fluoranthene IPY Indeno[1,2,3-cd]pyrene DBahA Dibenzo[a,h]anthracene BghiP Benzo[g,h,i]perylene BaA Benzo[a]anthracene
6 Introduction
Atmospheric deposition as a transfer of substantial amount of different types of chemical contaminants from the atmosphere to all types of environments nowadays is broadly studied by environmental chemists. Atmospheric contaminants originate from various sources, have different structure, chemical and physical properties, and hence differ by time of life, toxicity, potential for accumulation in the environment and for bioaccumulation and biomagnification.
Polycyclic aromatic hydrocarbons (PAHs) are one of the common persistent organic contaminants. This group of contaminants encompasses the compounds that consist only from atoms of carbon and hydrogen and have aromatic rings of different size in the structure. PAHs high ability to accumulate in all types of environment: atmospheric air, hydrosphere (marine and surface waters), in soils and sediments, cryosphere (both ice and snow), and even worse in biosphere (from bacteria to humans). Generally long residence times in the environment make PAHs dangerous.
According to Kanu et al. (2005), persistence of PAH is determined by the half- life time and rate of decomposition; it take at least 2 years for 95% of compound to degrade. PAHs can be absorbed by human body though the skin and are proved to cause carcinogenic effects (Regulation EU 2006). Presence for a long time under the influence of PAHs also leads to allergy progress, can cause heart strikes and advance of cancer formation (Matsumura et al. 1972; Kanu et al. 2005; Schober et al. 2007;
Brook et al. 2010, Kim et al. 2015).
The assessment of a long-term PAH accumulation in different types of environment belongs to a state-of-the-art research. Photochemical processes are mostly responsible for slowly transformation of PAHs to a wide range of degradation products which are even more persistent and more toxic for biota and humans (Manzetti, 2013). Estimation of short-term distribution and accumulation of parent PAHs is quite important step in the understanding of their further pathways and fate in the environment.
7 This project aims to quantify PAHs and assess their distribution in snow cover of mining town Barentsburg, Western Spitsbergen. Instead of considering the whole snow pack to estimate total accumulation of PAHs and their release to environment with a melt, study is focusing on upper snow cover, hence making a snapshot of the local contamination. Based on PAHs properties and individual peculiarities, taking into account local geographical settings, an attempt to appoint the sources of PAHs and their possible fate in arctic conditions is made.
8 PAHs sources in the environment
Despite PAHs are considered pollutants, they have natural sources too. PAHs of natural origin come into the environment mostly during the emission from volcanoes and naturally occurring forest fires (National Research Council (US), 1983).
In addition, PAHs in large amounts are present in coal and oil, but this is mostly a reservoir of these contaminants, while their distribution is a result of human activity, particularly combustion of mineral fuel. PAHs of “anthropogenic” origin are subdivided into two main groups: petrogenic and pyrogenic. Petrogenic PAHs are getting into environment during oil drilling, mostly by oil spilling. The pyrogenic type of PAHs is transferred through the atmosphere from coal, crude oil and biomass burning. They are also released through fuel combustion by the car engines.
Depending on their chemical structure PAHs are accumulated and stored in specific types of environment. According to Friedman et al. (2012), processes of accumulation are very complex and firstly depend on weight of compounds and their ability to create bonds with organic carbon and other type of carbon (e.g, black carbon) (Fig. 1). Basically PAHs are hydrophobic.
Sixtenn PAHs are listed as priority pollutants by the United States Environmental Protection Agency (US EPA) due to their overall predomination in the environment caused by anthropogenic activity. They are usually found in the environment in higher concentrations than others PAHs. At the same time, these pollutants have the most harmful effect to the human health in comparison to other PAHs. (ATSDR, 1995; Ravindra et al. 2008)
Of these sixteen PAHs phenanthrene and pyrene are generally present in the gas phase in the atmosphere, where mostly turned into oxidized form and stored up in near-surface air. In contrast the great portion of released by the emission benzo[a]pyrene (BaP) is bond to black carbon (BC) and subsequently deposited from atmosphere. Nevertheless a part of BaP absorbed by BC in the atmosphere is transformed into gas phase and then undergoes oxidation (Friedman et al. 2012).
9 Figure 1. Global budget of atmospheric phenanthrene (red), pyrene (green), and benzo[a]pyrene (purple). Inventories are in Mg (boxes) and rates are in Mg yr-1 (arrows).
10 PAHs properties
The researchers (Lane et al. 1991; Pampanin and Sydnes, 2013; Oliveira et al.
2014) agree, that determination of PAHs concentrations in the environmental components is a complicated procedure. PAH content is mostly governed by several factors and conditions of environment that have to be taken in account: 1) chemical and physical properties of each particular molecule; 2) conditions, affecting the PAH compound pathway; 3) interaction of PAH compound with substrate (i. e. particulate matter, organic matter) – origin and properties of absorbed PAH (Kim et al. 2013;
Lane, 1991). Therefore, to accurately assess contaminants concentrations is necessary to understand their chemical and physical properties.
Main physical factors impacting the processes of PAHs distribution in atmosphere are vapour pressure and temperature which determine the phase of PAH or gas-particle ratio. Henry’s law constant and affinity to particle agglomeration explain the water solubility of PAHs. The dominant way of PAHs deposition – wet or dry – is defined by these properties. (Kim et al. 2013) As most of PAHs compounds are hydrophobic, they have low Henry’s constants (CCME, 1992).
Chemical properties of PAHs differ and depend on structure of molecule.
However, for evaluation of their concentration, the chemical reactions responsible for transformation of parent PAHs into new compounds and their removal from the studied environment are of great importance (Ravindra et al. 2008; Lane, 1991). It is clear that sometimes the products of natural transformation of PAHs can also have adverse effects to biota (Szczybelski et al. 2016).
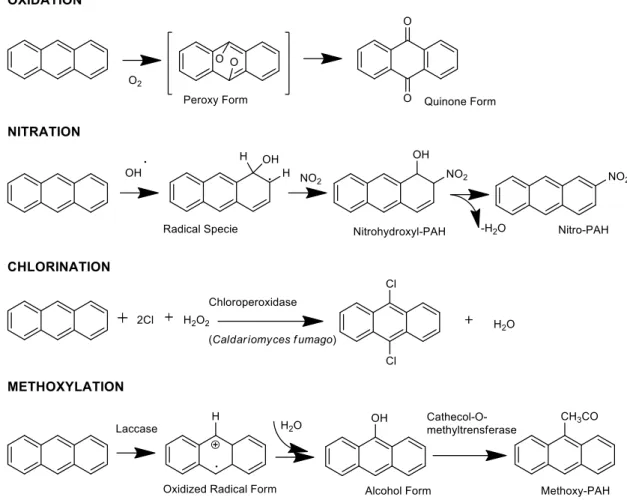
PAHs are susceptible to photoreactions (oxidation and nitration) under UV radiation (Fig. 2) occurring spontaneously in the atmosphere. Moreover, they may undergo halogenation under the catalyzation by chloroperoxidase enzyme of some fungal species, as well as methoxylation triggered by the fungi Trametes versicolor (Fig. 2) (Szczybelski et al. 2016).
11
Figure 2. Typical PAH-degradation processes exemplified on anthracene (after Manzetti et al. 2013).
12 PAHs in the Arctic
In the Polar Regions, all types of contaminations have much higher influence on environment and biota. Firstly, the accumulation of polycyclic aromatic hydrocarbons in the environment is increased over last decades due to increasing of transport activity and drilling activities (OSPAR, 2008). Secondly, the Arctic, and polar ecosystems in general, are fragile because of unbrached food webs, high metabolic rates of arctic species and domination of organisms with high fat content (AMAP 1997). Here PAHs uptake occurs at all food chain levels, and due to intensive bioaccumulation and biomagnification processes within the food web increased concentrations of these carcinogenic compounds are observed (Stevenson and VonHaa, 1965; Lee et al. 1972, AMAP 1998).
Over the last decades due to the development of new observing and measuring technics the issue of long-range transport as an additional source of persistent pollutants in the Arctic emerged. However, there is no general opinion on the role of long-range transport on PAHs concentration in the distant regions of Arctic. While Pedersen and coauthors (2015) consider the possibility that due to PAH’s persistency in the air, they are coming into Arctic environment not only from in situ release but from over the world, they suggest that long-range transport influence is not yet extensive. In the recent study, Abramova et al. (2016) based on their research and works of G.E. Shaw (1995) and Quinn et al. (2007) studying “Arctic haze” phenomena, claim that long-range transport has a huge influence on PAH content on the area such as Spitsbergen archipelago.
Climate change seems to contribute to increasing of PAH concentrations in the Arctic environment changing pathways and fate of persistent organic pollutants.
Melting of icecaps and permafrost leads to release of preserved over decades PAHs from cryosphere to surface and ground waters, soil and air (Pouch et al. 2017).
13 Study area - Spitsbergen archipelago
Spitsbergen is an archipelago located between 74° to 81° north, and 10° to 35° east. The historical Norwegian name of this land is Svalbard, it includes 3 largest islands: Spitsbergen, Nordaustlandet and Edgeøya. The Spitsbergen landscape is described by rugged mountains, with steep flanks, as well as large, glacially eroded fjord systems. The border-zone between cold arctic air from the Polar Basin and mild maritime air from the oceans to the south is situated at the exact location of archipelago. From meteorological point of view, this means a zone of cyclones passages that is generating unstable, often stormy weather with periods of a strong wind in the winter and fogs in the summer (Isaksen et al. 2016).
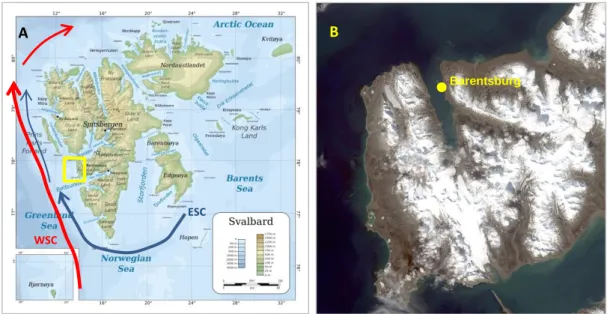
Figure 3. (A) Topographical map of Spitsbergen archipelago from http://www.mapsland.com. Arrows show the main currents: blue – cold Eastern Spitsbergen Current (ESC), red – warm Western Spitsbergen Current (WSC) (after Svendsen et al. 2002); (B) Satellite image of Nordenskjold Land made in June 2016 (Arctic and Antarctic Research Institute).
Vegetation distribution and active growth of flora are restricted by temperature fluctuations, a short vegetation period, low nutrient content, wind exposure and a soil movement caused by freeze–thaw cycles. On the other hand, warm Atlantic waters moderate climate conditions. The temperature conditions for a plant growth are not particularly cruel as in other Arctic regions. As a result at the Spitsbergen area are predominant tundra and polar desert. The warm Atlantic air and water also influence climate at the archipelago in general leading to warming of fjords water, changes in permafrost, intensification of erosion, introduction of new
ESC WSC
A
Barentsburg
B
14 species (Isaksen et al. 2007; Pavlov et al. 2013; Friederiksen et al. 2014; Gjelten et al.
2016).
The human settlements and economic activity are allowed only at the territory of Spitsbergen Island, while the protected natural areas (7 national parks, 6 reserves, 15 bird sanctuaries and one geotop protected area) prevail on the islands. Legally the archipelago is the unincorporated area under the administration of a governor appointed by the Norwegian government. Svalbard Treaty regulates some law peculiarities over Spitsbergen, regulates demilitarization and gives the signatories equal rights to commercial activity (mainly coal mining and tourism). Presently one active Russian settlement, namely mining community of Barentsburg, is located on the west bank at Grønfjorden in south-western part of Spitsbergen (Spitsbergen- Svalbard, 2012; "Svalbard": World Fact Book, 2017).
The region of Grønfjorden presents middle-mountain area with a sharply dissected landscape. The height of the mountain peaks ranges between 200 and 600 m above a sea level, ridges are separated by a well-developed system of valleys accumulating large amounts of snow in winter. The hydrological network is formed by numerous streams, almost always originating from glaciers and snow patches (Koroleva et al. 2008).
For the area of Barentsburg, due to the special features of the town location, the seasonal weather is strictly affected by a wind direction. In winter season strong north and north-western winds are predominant, while during the summer season the main direction of a wind is southern and south-eastern (data from https://rp5.ru/, at Barentsburg meteorological station). The polar night begins here in the end of November and lasts till the beginning of April. The full onset of snow cover fall onto middle of October. Snow melting and river break-ups start in the end of April, the snow melts till the end of June releasing together with rivers huge amounts of fresh water into the fjord.
15 PAHs regulation
As Arctic is a region where quite a lot of stations of oil and coal extraction and processing are located (mostly in Arctic Russia and Alaska and a few in Canada), the occurrence of pollution by leaking, spilling and dispersion is high, including terrestrial areas. According to Filler and coauthors (2008), “under some estimates about 5% of the world’s oil spills are contained in the Arctic field”. It leads to the necessity to regulate this type of contamination in specific Polar conditions. Not only oil spilling accounts for accumulation of PAHs in natural objects. Coal/gas/biomass burning is the other source of PAHs input into the environment. Contaminants of pyrogenic origin can be spread over the great distances.
So far there are no universal regulation guidelines to determine the average levels and maximum allowable concentration (MAC) of PAHs in the environments accepted by all Arctic countries. Each country uses its own cleanup levels and other rules for determining quality of environments; not all of them include specific features for Arctic region.
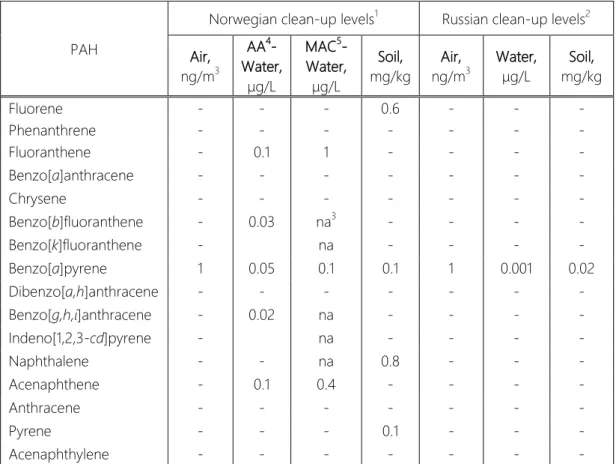
Nowadays no certain concentrations are specified to help to assess pollution level of snow cover. As PAHs are accumulated in snow during the winter and then virtually instantly released into other environmental components one may keep in mind the guidelines for restriction levels of organic contaminations in the air, soil, sediments and natural waters to approximately estimate PAHs levels in snow (Table 1).
The Svalbard Treaty of 1920 recognizes the sovereignty of Norway over the Arctic archipelago of Svalbard (Spitsbergen). The exercise of sovereignty is, however, subject to certain stipulations, not whole Norwegian law applies; and the treaty mostly regulates the demilitarization of the archipelago. From 2012 at this territory, Norway and Russia are making use of this right (Original Spitsbergen Treaty, 1920).
Spitsbergen is a territory of Norway, while small town Barentsburg, where the study was conducted, under the Russian Federal Law.
For better legislative estimation of maximum allowed and mean levels of 16 chosen PAH, the guidelines of Norway and Russia were compared (Table 1).
16 Environmentalthreshold concentrations are not specified for all sixteen PAHs by both Norwegian and Russian environmental regulative guidelines.
Benzo[a]pyrene (BaP) is considered the most hazardous compound; therefore guidelines provide environmental limit maximum allowed concentrations for it. The Russian Federal Law limit possible concentrations of BaP in soils and water much more strictly then Norwegian, while maximum allowable BaP content in the air is similar to European.
Table 1. Comparison of environmental threshold concentrations of PAHs defined by Norwegian and Russian guidelines
PAH
Norwegian clean-up levels1 Russian clean-up levels2 Air,
ng/m3
AA4- Water,
μg/L
MAC5- Water,
μg/L
Soil, mg/kg
Air, ng/m3
Water, μg/L
Soil, mg/kg
Fluorene - - - 0.6 - - -
Phenanthrene - - - - - - -
Fluoranthene - 0.1 1 - - - -
Benzo[a]anthracene - - - - - - -
Chrysene - - - - - - -
Benzo[b]fluoranthene - 0.03 na3 - - - -
Benzo[k]fluoranthene - na - - - -
Benzo[a]pyrene 1 0.05 0.1 0.1 1 0.001 0.02
Dibenzo[a,h]anthracene - - - - - - -
Benzo[g,h,i]anthracene - 0.02 na - - - -
Indeno[1,2,3-cd]pyrene - na - - - -
Naphthalene - - na 0.8 - - -
Acenaphthene - 0.1 0.4 - - - -
Anthracene - - - - - - -
Pyrene - - - 0.1 - - -
Acenaphthylene - - - - - - -
1 2008/105/EC EQS: of the European Parliament and of the Council of 16 December 2008 on environmental quality standards;
2 Federal Law № 52-FZ “The sanitary-epidemiological welfare of population”, 1999;
3 na = not applicable;
4 AA = average annual;
5 MAC = maximum allowable concentration.
17 Recent PAH studies at Spitsbergen
The location of Spitsbergen archipelago presents an example of a mixture of unique conditions. Its remoteness from large areas of human industrial activity makes archipelago perfect for studies of contaminant distribution, accumulation and degradation with specificity of polar or cold regions (Abramova et al. 2016).
Some of recent research on fate of PAHs in Arctic environment over Svalbard is focusing on bioaccumulation and biodegradation of PAHs by bacteria. For example, Szczybelski et al. (2016) studied bioaccumulation potential of PAHs in Arctic benthic species. Crisafi et al. (2016) examined cold-adapted marine bacteria able to degrade PAH contaminants in waters of Kongsfjorden.
A number of studies conducted at Svalbard are dedicated to accumulative concentrations and origin of pollutants, mostly in the marine environment. For instance, Pouch et al. (2017) are interested in determination sources and accumulative concentrations of PAHs in sediments in fjords around Svalbard focusing on PAHs absorbed by the organic matter and fine mineral particles resulting in composing a new layer of sediments.
Thereby, research at Spitsbergen aims to assess PAHs accumulation rates and long-term cumulative effects in the marine environment. However Abramova et al.
(2016) made an attempt to estimate the annual concentrations of PAHs in snow cover focusing their research at the PAHs associated with particulate matter (PM), their distribution and main sources around Longyearbyen and Barentsburg in 2013- 2014. The work of Polkowska et al. (2011) dedicated to PAH’s contamination of surface water along with precipitation processes in Fluglebekken basin, south- western Spitsbergen. This presents a basis for further investigation of PAHs distribution and accumulation in soil and offshore sediments (Abramova et al. 2016).
According to studies conducted on Spitsbergen in the last decade the highest cumulative concentrations of PAH have been reported for surface water and marine sediments (Table 2). Furthermore, acenaphthene and naphthalene prevail in the mixture of PAHs in marine environment, while a dominant compound in soil and near-surface air is phenanthrene. Authors explain these results by the main source of
18 Table 2. Review of PAHs concentrations reported from recent studies conducted at Spitsbergen.
Study area Environment Measured PAH
Range of concentrations
Dominated PAH Reference
Surface water by Foxfonna glacier
Sea water, snow and ice
Σ16 PAH 1098.4–107562 ng/L
ACE Pacyna et al. 2014
Fuglebekken basin Surface water Total PAH 4–600 ng/L NAPH Polkowska et al. 2011
Byfjorden Seawater NAPH 3.9–14.4 mg/L - Bagi et al. 2014
Zeppelin mount Air Total PAH 0.6–2.0 ng/m3 PHEN Cecinato et al. 2000
Ny-Ålesund Soil Σ16 PAH 0.3–324 ng/g dw PHEN Wang et al. 2009 Hornsund fjord Sediments Σ12 PAH 33.52–1973.57
ng/g dw
- Pouch et al. 2017 Kongsfjorden Sediments Σ12 PAH 51.93–1482.13 ng/g
dw
- Pouch et al. 2017 Barentsburg,
Longyearbyen
Snow particulate matter
Σ16 PAH 7.9 - 24633 ng/g 1-MENAPH, PHEN
Abramova et al. 2016 Grønfjorden Marine water 15 PAHs 41.0 ng/L PHEN,NAPH Personal comm.,
RPA “Typhoon”, 2017 Barentsburg Snow pack 15 PAHs 22.0-313.0 ng/L PHEN,NAPH
Barentsburg Snow pack 15 PAHs 23.6-158 ng/L PHEN,NAPH, BBF,BKF
Demin et al. 2011 Grønfjorden Surface marine
water
15 PAHs 2.8-1049 ng/L PHEN,NAPH, FLT
Demin et al. 2011 Grønfjorden Near-bottom
marine water
15 PAHs 2.5-859 ng/L PHEN,NAPH, FLT
Demin et al. 2011 Grønfjorden Ice cover 15 PAHs 25.7-929 ng/L PHEN,NAPH,
FLU,CHR
Demin et al. 2011 Grønfjorden Marine
sediments
15 PAHs 13.0-2281 ng/g PHEN,NAPH, FLU,CHR
Demin et al. 2011 Stemmevatnet Ice cover 15 PAHs 59.3-244 ng/L PHEN,NAPH,
FLU
Demin et al. 2011 Stemmevatnet Sediments 15 PAHs 2.8-1699 ng/g PHEN,NAPH,
BBF
Demin et al. 2011 Grønfjorden rivers,
Stemmevatnet
Surface water 15 PAHs 0-713 ng/L PHEN,NAPH, FLT
Demin et al. 2011 Barentsbburg Soil 16 PAHs 67.3-8140 ng/g PHEN,NAPH,
FLT
Demin et al. 2011 Snow mobile routes
in Longyearbyen
Soil 15 PAHs 21.4-1883.1 ng/g dw
PHEN,CHR,BBF Kallenborn et al. 2011
accumulated PAH: for marine environment the ship fuel has a great influence, while at the near-surface air and soil the main source of PAH is light fuel and coal combustion (Cecinato et al. 2000; Wang et al. 2009; Pouch et al. 2017).
19 The North-western branch of RPA “Typhoon” (Saint-Petersburg) has been conducting industrial monitoring of the state of the environment including PAH in the snow cover, natural and marine waters for more than a decade. A methodology of snow sample processing used by “Typhoon” lies in the base of this research.
Although the short-term accumulation of PAHs is not particularly studied, this can be of great value for estimation of annual deposition rates and recognizing of exact sources of contaminants. PAHs flux rates from the atmosphere to surface in the period of the wet (snow) precipitation obviously present important direction of research. This study aims to some extent to fill this gap and try to separate the different sources of PAHs in south-western Spitsbergen around Barentsburg.
20 Methods
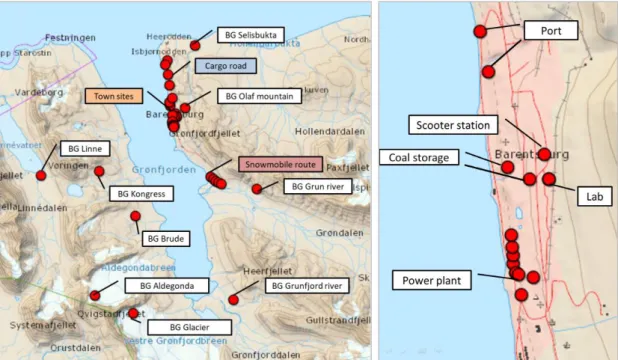
Small town Barentsburg in south-western part of Spitsbergen with slightly over 400 citizens was chosen as an observation area (Fig. 4). The location of this place is convenient for studying of PAHs sources due to its remoteness from other towns or others places of human activity. Ideally its location allows recognizing only local sources of PAH input: 1) power plant with two 30 m exhaust stacks working on coal (Fig. 5a); 2) coal storages; 3) regular roads mostly used by cargo transport; 4) seasonal scooter routes.
The purpose of current research was the measuring of main 16 polycyclic aromatic hydrocarbons content in the upper layer of snow pack at the sites presumably affected by each of above mentioned sources and to check if the sources are indeed local and recognizable. The mix of measured 16 PAHs consisted of NAPH, ACY, ACE, FLU, PHEN, ANTH, PYR, FLT, CHR, BaP, BbF, BkF, IPY, DBahA, BghiP, BaA. Simultaneously the content of the same 16 substances was analyzed in the snow cover at nine background areas located at some distance from the town, but probably affected by the long-range transport of pollutants from Europe. All of these compounds are commonly occurring in the environment yet build up their
Figure 4. Study area and sampling sites: BG – background areas; right side – detailed view of sites within town.
21 concentrations as a result of human activity, primary due to incomplete combustion of organic material, diagenesis and biosynthesis (UK SACs Project, 2001).
Figure 5. (A) Power plant in Barentsburg, one of the sources of PAHs; (B) snow sampling in the town.
Sampling campaign
All field and analytical works was carried out over a month from April 26 to May 26, 2017. The field work consisted of collecting of 4 series of samples of the upper snow pack in the areas mostly affected by PAHs. The background samples were collected one-two weeks earlier by spring group of “Spitsbergen-2017”
expedition by Arctic and Antarctic research Institute (AARI) (see Fig. 4).
Each sampling spot was chosen at a distance from snow scooter. Samples of surface (0-5 cm) snow were collected in disposable nitrile gloves by pre-cleaned metal scoop and densely packed into approx. 2 L disposable plastic zip bags to get about 1 L of snowmelt. Samples were stored in darkness under -20C until further analysis (Fig. 5b).
The first series referred to a snowmobile route along the Valley of Grøndalselva river: here 3 parallel samples were taken at each 5 sampling sites situated 50 meters from each other.
The second group of sampling sites was located along the regular road from heliport to town used mostly by open heavy duty vehicles: here snow was collected in 2 replicas at 5 sampling points in 500 meters from each other. Additionally, 2 samples were collected in the port and 2 – near the coal storage, all duplicated.
For the third series, the directional sampling was applied: the snow was collected at 5 sites 50 meters apart in the direction of prevailing wind from power
A B
22 station. The prevailing prior to sampling time wind direction was determined based on the data from Barentsburg meteorological station (https://rp5.ru). The last group of surface snow samples was taken in triplicate at four sites around the power plant at a distance of approximately 100 meters from the source of emission.
One reference sample for scooter traffic was collected directly at scooter parking lot in the center of Barentsburg. Two samples of snow are collected close to the laboratory building to check the influence of different meteorological conditions on PAHs concentration. At each of nine background sites one sample was collected in duplicates. Around power plant and close to the lab collected snow was freshly fallen while along the cargo and scooter routs snow was of several days old.
Altogether 82 samples were collected at 35 sampling sites. The detailed description of collected snow samples is shown Appendix 1, Table 1.
Sample processing
Preparatory and analytical work was completely carried out in the analytical laboratory at the Russian Scientific Center on Spitsbergen managed by AARI (Fig.
6a).
The analytical and auxiliary equipment which was used during sampling, processing and analysis of samples is:
Chromatograph liquid Shimadzu LC-20AD Prominence with RF-20 Fluorescence and SPD-M20A Photodiode Array detectors;
Ultrasound disperser IKA T-25 ULTRA-TURRAX;
Ultrasound bath RAS 2-0, 16/37;
Rotor-evaporator IKA RV 10 BASIC;
Water purification plant MILLI-Q DIRECT8;
Distiller GFL - 2008;
Additional sampling equipment and laboratory glassware, membrane filters either Vladipor MFAS-OS-2 or WHATMANN QM-A.
23 The sample preparation method was developed in the laboratory of North- Western branch RPA “Typhoon”, and has been successfully applied for PAHs monitoring in Svalbard snow cover over the last decade (Demin et al. 2011).
Figure 6. (A) Sample processing in analytical lab of Russian Research Center in Barentsburg; (B) Particulate matter on the membrane filter after filtration of sample meltwater, power plant site.
All samples obtained in the field stored in a freezer were melted at room temperature in a dark place. Each sample was filtered through a pre-washed by hexane, dried and pre-weighted 0.45 μm membrane of either VLADIPOR or Whatmann, 47 mm in diameter (Fig. 6b). For further preparation and analysis 900 ml of filtrated water was used. The filtrate was subjected to an extraction process: 900 ml of liquid fraction with 30 mL of hexane was stirred for 10 minutes in an ultrasonic stirrer at the speed 11. The additional 20 mL saturated KCl solution was used for a quicker fractions separation. The organic fraction was dried over preliminarily dried Na2SO4 and subsequently reduced in rotary evaporator to a volume of 0.5 mL with a following quantitative transfer into 2 mL vials. Next stage consisted of evaporating hexane from the extract in direct air flow down to slightly wet substance and replacing with 1 mL of acetonitrile (CH3CN). The extracts of samples in this form were analyzed at liquid chromatograph.
The filter with particulate matter was dried above dehumidifier in a desiccator, and weighed at analytical balance. The extraction of particulate matter was carried out in 30 mL of hexane in an ultrasonic bath at room temperature for 30 minutes.
After that, the solution was filtered at filters “white ribbon”, and further, at the same way as for filtrate samples, was reduced in a rotary evaporator to 0.5 mL, transferred
A B
24 to 2 mL vial. The hexane was dried in the air flux and replaced by 1 mL acetonitrile.
The obtained samples in this form were taken for analysis to the liquid chromatograph.
Measuring and result processing
All 82 collected samples as effluent and 51 samples as particulate matter were quantitatively analyzed. All samples have been taken in the double and triple repetition. The average PAH concentration for each study site was calculated based on the individual results of each series samples. In order to unify the PAH concentrations, the values of PAH content defined in particulate matter gathered on filters were recalculated over the volume of melt water filtered.
The levels of 16 mentioned before PAH: Naph, Ace, Flu, Phen, Anth, Pyr, Flt, Chr, BaP, BbF, BkF, IPY, DBahA, BghiP, BaA at the liquid chromatograph at fluorescence detector, while Acy was quantified at diode-array detector with lower resolution. The separation of PAHs was performed on chromatographic column Supelcosil 15*4,6 mm 5 μm with guard column Supelguard LC-18 at temperature 35°C under the gradient system acetonitrile-water starting from 40% of acetonitrile and gradually increasing concentration to 100%. Time of analysis was 47 minutes.
Chromatograms acquisition was conducted by two channels (according to characteristic wavelength of each PAH) of fluorescence detector and within interval of 200-400 nm by diode-array detector. Diode-array detector is usually applied to measure acenaphthylene, however it allows to perform additional qualitative identification of PAHs confirming their presence by absorption spectrum.
The concentrations of PAHs obtained by a liquid chromatograph as chromatograms were recalculated according to sample volume taken for extraction and partition coefficient:
,
Where mlc i – is the mass of the i-th component of determined PAH in the sample by a liquid chromatograph (μm),
25 mbg i – content of the i-th component on an empty filter (μm),
φ – partition coefficient, V – sample volume.
A partition coefficient was estimated experimentally by spiking samples of MilliQ water with three different standard solutions of certain concentration and processing them along with snow melt samples. For all series of samples the coefficient was set 1.10. A certified mixture of PAH 16 with a mass concentration of components 500 μg/mL (PAH Mixture PM-831-1, Ultra Scientific) was used for preparation of standard solutions for the calibration and quality control. The deviations of standard samples were not higher than 5% for each compound.
Sample preparation technique and measuring instrument provide a certain detection limits of PAHs (Table 3). The obtained concentrations of studied compounds which fell below detection limits could not be count as precise and were taken out of consideration. Mean values for each sample together with standard deviations are represented in the Appendix 1, Tables 2, 3.
Table 3. Limits of PAH determination according to applied method.
Compound PAH abbreviation Detection limit, µg/l
Fluorene FLU 0.006
Phenanthrene PHEN 0.006
Fluoranthene FLT 0.02
Benzo[a]anthracene BaA 0.006
Chrysene CHR 0.003
Benzo[b]fluoranthene BbF 0.006
Benzo[k]fluoranthene BkF 0.001
Benzo[a]pyrene BaP 0.001
Dibenzo[a,h]anthracene DBahA 0.006
Benzo[g,h,i]anthracene BghiP 0.006
Naphthalene NAPH 0.02
Acenaphthene ACE 0.006
Anthracene ANTH 0.001
Pyrene PYR 0.02
Indeno[1,2,3-cd]pyrene IPY 0.02
Acenaphthylene ACY 0.05*
*Limit of quantification was established experimentally, ACY is quantified by diode- array detector having lower sensitivity and therefore has low detection limit.
26 Results
Based on the measured and recalculated concentrations of individual samples the average value for each sampling sites was determined. All compounds were averaged for certain series of samples in both the filtrate (dissolved PAHs) and particulate matter bound PAHs gathered on filter (see Table 4).
Table 4. Total PAHs concentrations for each studied site and their distribution between dissolved and particulate forms.
Site ∑ PAH, ng/L ∑ PAH in
filtrate, ng/L
Portion of dissolved PAHs, %
∑ PAH at Filter, ng l-1
Portion of particulate PAHs, %
Snowmobile route 87.84 67.82 77 20.02 23
Laboratory site 123.73 46.34 37 77.39 63
Regular cargo road 63.72 39.79 62 23.92 38
Power plant 578.51 13.93 2 564.58 98
Port 126.00 47.58 38 78.42 62
Coal storage 940.29 108.62 12 831.68 88
Background area 11 26.94 26.94 100 0.00 0
Background area 22 21.77 21.77 100 0.00 0
1 mean value for snow samples from background area at Grønfjorden River;
2 mean valuefor snow samples from background area in Linne Valley. In other background samples the levels of individual PAHs did not exceed limits of quantification.
At first glance, in the both areas affected dominantly by the transport PAHs exist mostly in aquatic form (dissolved or rather bound to particles smaller than 0.45 μm in diameter). The highest concentrations of PAH was detected in the sites in the vicinity of power station and coal storage respectively. Obviously there is an influence of coal, both burned and non-burned. The PAHs content distribution in snow within a settlement is not that clear which hints on influence of both transport and burned coal sources.
Overall in studied sites only three compounds were found in filtrated part of snow samples in concentrations higher than detection limits. They are fluorine (FLU), naphthalene (NAPH) and phenanthrene (PHEN). All other compounds occur in aquatic fraction of the tested samples in amounts below the detection limit of the chosen technique.
27 Analysis of spatial distribution of PAHs in surface snow cover shows that fluorene prevails in the mixture of PAHs in significant amount in the vicinity of port (6.1 ng/L) and coal storage (6.8 ng/L), as well as at some points along a snowmobile route (8.1-10.4 ng/L).
Presence of phenanthrene in a liquid phase of samples was discovered in snow samples affected by snowmobile (6.4-18.2 ng/L) and cargo transport (8.8-12.8 ng/L), in the vicinity of power station (7.9-17.0 ng/L) and coal storage (11.1-11.2 ng/L).
A slight increase of phenanthrene concentrations was observed in time period when fresh-fallen snow was collected and processed (Appendix 1, Tables 2, 3): at the lab site and few samples near power plant. This compound was found in the surface snow even in areas selected as background sites in quantities close to the detection limit 6.5 ng/L (BB9, BB10).
Naphthalene was also widely distributed over studied area. Significant contents of naphthalene have been found along a snowmobile route (20.8-38.8 ng/L), while along a permanent cargo road concentrations were even higher (26.6- 37.6 ng/L). For all samples taken around a power plant, concentration of naphthalene varied in broad range from 21.4-24.7 ng/L in the aquatic phase.
Concentrations of PAHs bound to particulate matter (PM) gathered on 0.45 µm filters were recalculated over the volume of processed liquid sample (Appendix 1, Table 3). Opposite to the filtrate fraction most of PAHs associated with PM, except indeno[1,2,3-cd]pyrene and acenaphthylene, were observed in snow samples in detectible amounts. Except for the snow samples from power plant series where the concentration varied from site to site in a huge range (for example for PHEN – 170.3- 2186.0 ng/L (PM); FLU – 37.9-507.7 ng/L; CHR – 45.0-430.0 ng/L), the content of PAHs measured could be averaged over the areas sampled.
The highest PAHs concentrations were measured in sample from the closest to power station point with the highest PM content. The highest total concentrations of PAHs are found in the samples containing highest amounts of PM (and consequently PM bound PAHs) unevenly distributed over the studied area. The distribution of PM which represented in winter mostly by coal dust is determined to
28 large extent by meteorological conditions prevailing in certain moment of time.
Among dissolved PAHs the common contaminant was phenanthrene (7.9-13.8 ng/L) (Appendix 1, Table 3). Naphthalene in the amount of 21.8-24.2 ng/L was also detected in snow samples from several sites.
29 Discussion
Over Barentsburg area concentrations of ∑PAH varied considerably (Fig. 7).
The highest total content of both dissolved and particulate PAHs was found near open coal storage although the most of PAHs were contained in particulate matter.
The same tendency characterizes snow samples collected near power plant. PAHs levels in the city were much lower and evenly distributed between dissolved and particulate phases. Astonishingly total PAHs amounts in the vicinity of seasonal snow scooter route were higher than along regular cargo road. That shows the increasing impact of tourist activity on the Spitsbergen archipelago. In samples where the concentration of PM was high (for example BB20-BB28, power plant series) the total content of PAHs is also high.
The levels of PAHs in dissolved form are undetectable in background areas except for the Linne Lake valley (BB29) where traces of PHEN that can be related to the snowscooter route running nearby. The same is observed for Grondalen river sampling site in a distance from scooter route; there are no significant amounts of PM containing PAHs but filtrate portion of surface snow sample contains PHEN and NATH similar to scooter route samples. Both fractions of PAHs were successfully measured in the nearest to Barentsburg background site Olavbekken (BB10). Here both phenantrene and naphthalene were detected in filtrated portion of the sample while the particulate matter fraction did not contain significant amounts of PAHs.
Apparently the influence of power plant extend to this area through smaller than 45 µm particulate matter bound naphthalene which can be also transported from Longyearbyen to the west. Unfortunately there was no possibility to measure PAHs in particulate matter of most background samples.
Strangely the snow from scooter parking lot in the center of Barentsburg did not exhibited high content of PAHs but BaP was found in the mixture. The composition of PAHs at this site is quite similar to one situated near laboratory.
However the second sampling near the lab building after the snowfall showed no BaP but higher content of PHEN.
30 The main goal of this research was to make a snap-shot and assess short- term PAHs distribution and accumulation under local factors influencing. Due to different approach, results from Barentsburg cannot be directly compared to one obtained by Abramova et al (2016) in Barentsburg and Longyearbyen in 2013 and 2014 who are more interested in total winter accumulation of PAHs in snow pack.
Obviously concentrations of measured PAHs are relatively low in the surface snow layer comparatively to the entire snow pack. But the tendency keeps – the highest concentrations characterize a vicinity of coal storage (terminal) decreasing to power plant area and further more in residential area. Abramova et al. (2016) found also elevated levels of BaP in particulate matter near coal stock piles and especially high ones - near fuel storage.
Data of RPA “Typhoon” obtained in April 2017 showed that total content of PAHs in the entire snow pack did not exceed the levels measured later in May in the surface snow even at the sites located in Barentsburg. This probably explained by the
Figure 7. Concentrations of PAH in filtrate (A) and bound to PM (B) for surface snow samples collected under the power station.
2186 ng/L
31 averaging of results over the whole pack where more polluted levels changed by less polluted ones.
Expectedly high concentrations of PAHs extracted from particulate matter, firstly, may be explained by high sorption potential of particulate matter and, secondly, by low water solubility (WS) of PAHs, although there is a difference between water solubility of individual PAHs (Table 5). Individual PAH contents extracted from filtrate are correlated with WS in general. Such compounds as FLU, PHEN and NATH have low mass weights (LMWs) and therefore are characterized by higher water solubility. These compounds were quantitatively detected in the liquid part of snow samples from most of sampled sites (Fig. 7). FLU was not found in the site of regularly used cargo road, and at the site close to the laboratory FLU appears only in the PM bound form.
ACY also has a LMW and a high solubility in water, but this contaminant was not found in any examined snow samples. This pollutant has a double bound with active hydrogen which easily susceptible by photochemichal reactions, such as photo dimerization (Fig. 8) (Horspool and Lenci, 2003). Therefore under the conditions of polar day ACY can be almost entirely broken down to others forms.
Figure 8. Scheme of ACY transformation into two diametric products under the UV light.
Power plant influence
The highest total content of PAHs in surface snow was found in the sites near power station which is considered the main source of PAHs. However the series of snow samples taken at different distance downwind from power plant showed that several parameters play role in distribution of contaminants. Concentrations are not directly connected to the distance from the source of pollution (Fig. 7). PHEN occurred in high concentrations in both dissolved form and PM bound form. PHEN is one of the most stable PAH (Kallenborn et al. 2010) substances, and commonly
32 found in the different types of environments (Cecinato et al. 2000; Abramov et al.
2016; Wang et al. 2009; Kallenborn et al. 2010).
The ratio of dissolved to PM-bound components is the same as for other series of snow samples associated to other sources of contamination. Although in the particulate matter collected from the snow samples the highest concentrations of PAHs are found in the closest to power station sites, there is no general decrease in all individual PAHs contents with the distance from the source. The second site with high PAHs concentrations is the furthest from the power plant. The reason for this distribution can be fact that samples were collected and processed in the day of snow falling under the strong wind. Apparently PAHs from the exhaust were adsorbed by snow and transported from place to place by wind. The wind direction, strength and very specific orographic conditions in the settlement of Barentsburg, set on one of the terraces between fjord and higher mountains, may be significant for PAHs deposition with fresh snow. That was showed by Stader and co-authors (2016): the eddy wind effect in the lower atmospheric layer can strongly affect fluxes of PM and through this a distribution of particle-bound PAHs in the cities. In contrast over the whole snow pack accumulated through winter season the difference between relative close sites can be unnoticeable (Abramova et al. 2016).
Snowmobile route and Cargo road
The snowmobile route connects Barentsburg and Longyearbyen that leads to the full-loading of this route in spring time with the beginning of polar day and tourist season. The location of snow sampling sites along the route allowed assuming predominantly only one of PAHs sources. Snowmobile route runs within Grønriver valley, where no impact of such source as usual cargo transport can be expected as well as the influence of non-burnt coal. According to the primary wind direction in Grønfjorden area (southern directions), the contribution of aromatic pollutants coming from the power plant is less probable, than in Barentsburg itself.
Meanwhile, the amount of scooters regularly using the route suggests that the most of PAHs in upper snow cover should come from the combustion of snowmobile fuel.
33 Very small quantities of PAHs were found in both filtrate and PM-bound portion of snow samples in sites along the snow scooter route. NAPH being a component of mineral oil origin is frequently detected in high abundance in samples from areas affected by the transport. High percentage of naphthalene among other PAHs compounds characterizes the emission of gasoline engines and raw gasoline (Young 2000; Ravindra et al. 2008; Jia and Batterman 2010). Apparently, snowmobile activity in Grønriver valler may cause a release of some amounts of unburned fuel with a high level of NAPH. The obtained data confirm that NAPH content exceeds higher levels comparing to other compounds (Fig. 9a).
The combustion of vehicle fuel can be also responsible for emerging of such compound as IPY. However, this PAH was detected only in surface snow samples at the one sampling site. Its source is usually reported to be oil and oil combustion (Ravindra et al. 2008 and references therein) or gasoline emission (Guo et al. 2003).
It appears patchy high level of IPY can presumably be attributed to the spilling of a non-burned gasoline at this location from a broken scooter's gasoline tank.
Figure 9. Average values of each of individual PAHs at every studied site (except samples collected directionally from power station): A – in aquatic fraction; B – in particulate matter fraction.
34 For regular cargo road from heliport to town, the main source must be diesel fuel coming from the heavy-duty vehicles. On the other hand, another much less loaded scooter route runs close to the road. Also this area is located in a distance but on power plant leeward side, that can contribute additional PAHs released by the coal combustion. But no increased levels of PAHs of coal combustion provenance were found near the road. It suggests a substantial dispersion of power plant exhaust due to highly changeable weather conditions and distance of the road from power plant.
Both filtrate and PM fractions of snow samples showed measurable amounts of only NAPH and PHEN. NAPH has as a major source the power plant, while PHEN in studied area can come from both the power plant and diesel and gasoline fuel.
Town sites
Few different sites were investigated within Barentsburg itself: site close to the lab, port district and the area of coal storage. First two sites are affected by all PAH compounds released during the fossil fuel burning as well as gasoline (snowmobile, autos and cargo transport). According to distribution of individual PAHs, mostly light dissolved PAHs like PHEN and NAPH prevail here (Fig. 9). However, the snow samples from port area are also affected by the non-burnt coal due to coal transport from the mine to the harbor. Such compound as DBahA in particulate matter fraction can get into the snow pack with the non-burnt coal dust (Achten et al. 2009) equally to combustion of diesel fuel (Ravindra et al. 2008). That is confirmed by correlation to coal storage site, where the impact of fossil coal is much greater (Fig.
9). DBahA has relatively short half-life in the atmosphere (Table 5). Released during the non-complete coal combustion DBahA must be transformed into other forms making the process of precipitation less efficient in removing this pollutant in gaseous form from the atmosphere (Irwin et al. 1997).
DBahA is potentially more toxic then naphthalene and phenanthrene and classified as “probably carcinogenic” PAH to human beings based on sufficient evidence in animals (Straif et al. 2005, Kim et al. 2013). Its presence in the settlement
35 snow cover may cause adverse effects as lung and skin cancer under the prolonged exposure to increased concentrations. Fortunately only a small group of people lives in Barentsburg permanently while the most of the inhabitants stay here 2-3 years, at most 5 years.
The FLU is high volatile compound mostly occurring in the gas phase after the release during the combustion. It can be deposited from the atmosphere by particulate matter or aerosol. In freshly-fallen snow samples collected in the center of Barentsburg near the laboratory this PAH is primary bound to particulate matter. In the snow of port area, FLU is characterized by low content in particulate matter subsample while is slightly detectable in filtrate. FLU has a short half-life time in the atmosphere and is rapidly turned by the photo oxidation to the CH2O2 (Table 5) (http://www.speclab.com/; Nkansah et al. 2014). Being volatile and having WS of 1.9 mg/L (Table 5), FLU can be dissolved in the aquatic phase and eventually removed from the solution. In the port area the collected surface snow was several days of life and formed a snow crust. This means melting of the snow in the days before sampling and possibility of transferring FLU from particulate matter to solution frozen afterwards.