The findings of the performance analysis confirmed that such companies indeed have a high positive long-term post-market performance (statistically different from zero) compared to other types of IPOs. According to the purpose and tasks of the study, the research questions that are suggested: how do IPOs backed by growth capital perform in the long run.
THEORETICAL BACKGROUND OF INITIAL PUBLIC OFFERINGS
- Initial public offerings
- Long-run performance
- Factors influencing IPO performance
- Financed IPOs & growth capital-backed IPOs
- Hypotheses formulation
Their articles “The New Issues Puzzle” (Ritter and Loughran, 1995) and “The Long-Run Performance of Initial Public Offers” (Ritter, 1991) mainly argue and prove that IPOs underperform in the long run. It is suggested that the effect may be rather insignificant and limited due to the borrowing process, i.e. “the shares of IPOs cannot be sold short (except by the underwriters) at the start of trading. I propose that the main concept of the study is long-term performance, that is, the measure of how companies involved in these deals perform in the long term and what value they create for shareholders within the proposed time frame.
EMPIRICAL RESEARCH OF GROWTH CAPITAL-BACKED IPOS’ LONG-
Measurement of long-run IPO performance
The first is so-called "initial" - short-term development of the new share, usually one or more days after the offering, the method of cumulative abnormal returns is used. But considering all the disadvantages of BHAR method over CAR, it is more widely used approach due to the fact that summation of simple returns while n months return is the product of monthly returns. Barber & Lyon (1997) state “cumulative abnormal returns are a biased predictor of long-term buy-and-hold abnormal returns.
Consequently, on conceptual grounds, we favor the use of buy-and-hold abnormal returns in tests designed to detect long-run abnormal stock returns. Benchmarking is particularly important in terms of capturing excess returns in the market, the methodology of abnormal returns implies this procedure. My proposal for this section is to find peers for the companies presented by size and industry and calculate their abnormal returns in order to compare the results with the companies backed by growth capital.
In addition, I propose to calculate the cumulative rate of abnormal returns, i.e. for the first and the first three days after the first offer. Therefore, I will use the average abnormal returns of the portfolio v for the long-term and short-term performance measures.
Estimation of factors influencing the performance
The volume variable represents the issue size of the initial offering relative to the outstanding shares. I suggest that the absolute value is quite misleading in terms of difference ie. the number of shares offered may vary from one company to another. Theoretically, it could indicate the influence of the offered stock on the company's performance.
Furthermore, I want to estimate the influence of the market-to-book ratio at the time of IPO on the performance measure. The important consideration is that financial industry companies are in the sample, this may be misleading in terms of the details of growth capital backed companies, but I assume that these financial firms may also invest in tangible assets or make acquisitions in the future , therefore they can be in the sample. The literature on the buy-and-hold abnormal returns indicates the high right skewness of the data, so several significantly large abnormal returns may potentially affect the results of the positive performance.
This model helps estimate the probability that the outcome is equal to one, in other words the probability of positive performance in the long term and the influence of the factors on that performance. The other consideration concerns the number of factors that could be used in the model, that is, the number of independent variables.
Data and sample
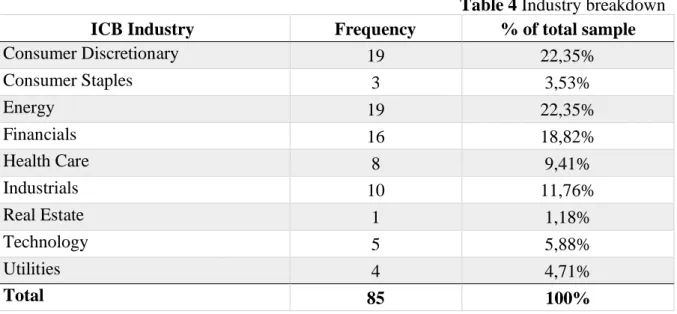
The third criterion is considered the most important, and the reason why this type of financing is called "growth capital-backed" is precisely that financial sponsors invest in the growth of either tangible assets or in planned acquisitions. Sponsorship in technology is not viewed as equity-backed growth, but as a venture capital investment. The subject of the research is the definition of the starting point, i.e. the year from which I should start creating the pattern.
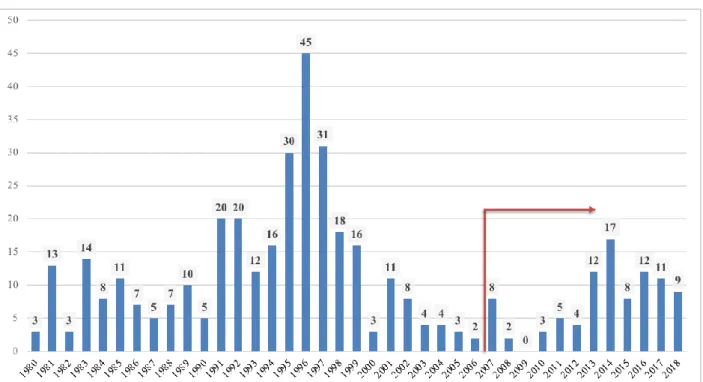
The inclusion of such a difficult time horizon could be justified by the interest of what was happening to the growth equity-backed companies in terms of their performance. Moreover, after the bubble crisis of 2000, the number of growth capital-backed companies developing an initial offer was not extremely large and only started to increase in 2007. This is due to the fact of the availability of information and the other argument is that the American market can be considered the most developed in terms of initial public offerings and sufficient in terms of information asymmetry, therefore IPOs supported by growth capital are properly identified.
This could be a contradiction to the stated claim in the article, because the author outlines the distinction between classic venture capital financing and growth capital financing, i.e. More precisely, if the company is in the biotech industry, it is automatically considered conventional venture capital, but not growth capital.
Descriptive statistics
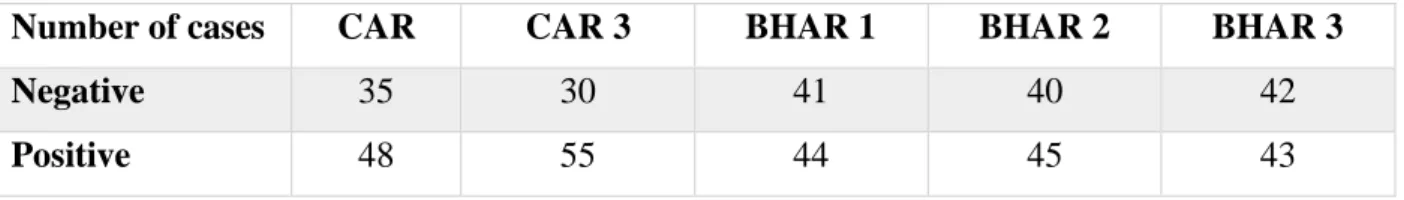
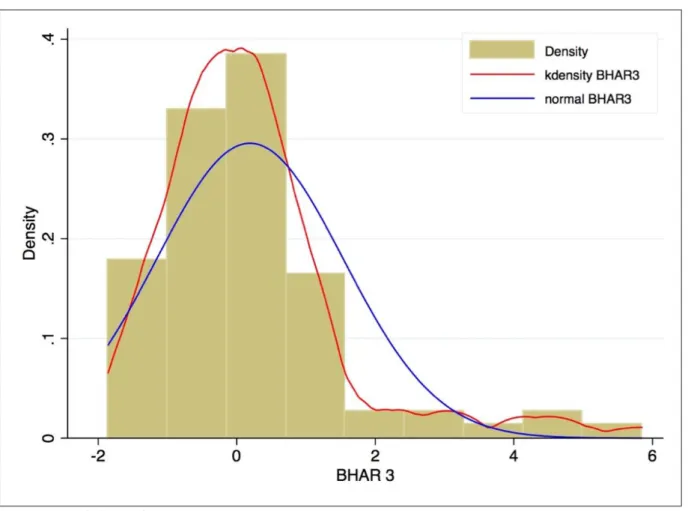
As the results in Table 5 show, the cumulative one- and three-day abnormal returns show an average positive performance of about 1.5%. Moreover, it could be observed that the highest variance and standard deviation are exactly in the estimation of the three-year period. I suspect this is due to the longer time horizon observed, as monthly returns showed high variability. It is already visible that the distribution has right-skew properties, as the kernel density estimation line (probability density line) is to the left of the normal distribution function.
As can be seen in Table 7, both CAR and BHAR3 have skew.2SE greater than 1 (which is an indicator for the importance of skewness), so these variables are positively skewed and significantly different from zero. Therefore, I suggest that this could be a valuable extension of the proposed research, as the number of positive and negative results seems to be sufficient. As the results showed, the mean of each variable except the two-year BHAR is significantly different from zero.
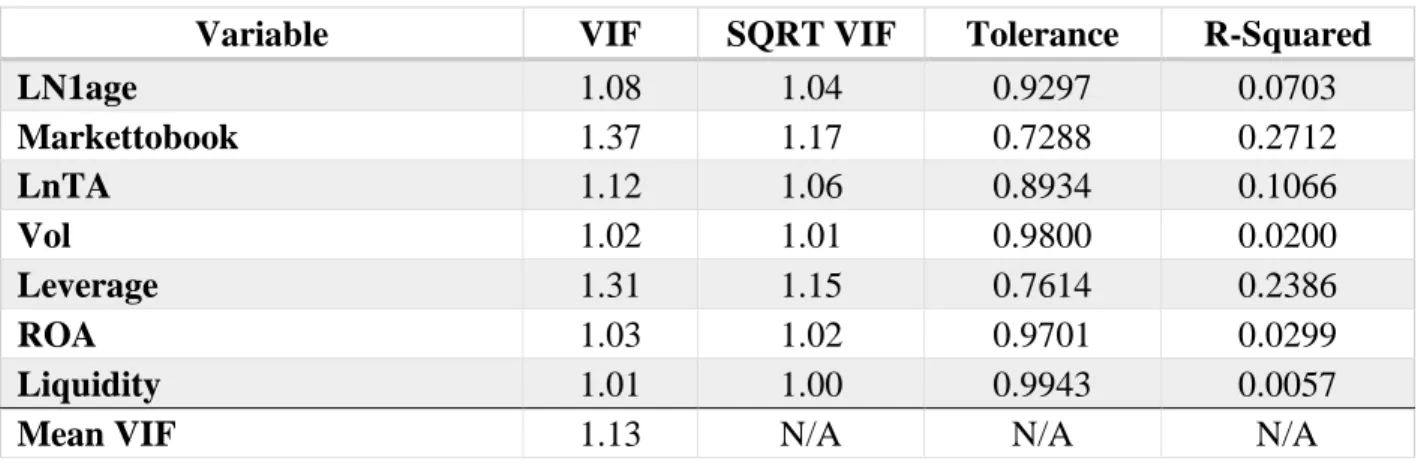
Therefore, further analyzes could be applied and the conclusion of statistical significance of the mean coefficient could be derived. The other coefficients could be considered small, and the conclusion is that the multicollinearity problem among the variables will not be present.
Econometric analysis
Standard error values are shown in parentheses In general, it can be seen that value-weighted models perform much better in terms of the R-squared metric, so that the variances of the independent variables better explain the variance of the dependent ones. Furthermore, in the short-term performance models from Tables 14 and 15, the signs of the magnitude coefficient remain correct. Short-term performance, on the other hand, significantly affects the long-term and therefore I assume the correct specifications of the models.
Another vital point to check for regression models is whether we have proper specification of variables, i.e., the model has no omitted variables. This partial derivative represents the marginal impact of assessments on the probability of a positive outcome, it is called the marginal effect. The impact on the probability of asset returns and the year is not as significant as short-term performance.
Several methodologies can be used to assess the adequacy of the model. Liquidity is now affecting the probability of a positive outcome, and it is positively affecting, i.e., companies with higher initial liquidity will be more likely to have positive acquisition returns over the three-year time horizon. Again, we can see how short-term performance significantly affects the probability of a positive outcome, i.e., positive long-term abnormal returns.
The same significant influence of the short-term performance (CAR variable) is observed in Table 28.
Managerial implications
These investors could also be viewed from the point of view of the investment time horizon, i.e. could be long-term or short-term investors, these strategies mainly depend on the objectives and could not be specifically described. First, the insider could be aware of the conditions of their company and the factors of a successful IPO. The decision of this exercise could be supported by the short-term performance presented in the results, which means that the underwriting banks could foresee potential growth and positive returns in the days following the IPO, and support for the idea of the exercise is presented.
This focus on precise indicators will undoubtedly not guarantee the successful performance, but they could be useful milestones for evaluating further strategy. From the perspective of investors, that is, the other side of interested parties, this research could contribute in terms of specificity awareness. This would bring the idea of the perception of these two indicators, e.g. the higher share offered to the public may be indicative of future underperformance.
Leverage can again be an indicator of a developing company, reduced agency problem and more effective execution of investment projects with the use of debt capital. I suggest that this issue be eliminated from the sample since the growth equity-backed companies are specific in nature and their ROAs can be compared across the featured industries.
Limitations
The proposed research aims to identify long-term performance of specifically financed initial public offerings – the type of venture capital financing called growth capital backing. Therefore, the aim of this paper was to investigate the long-term performance of a specifically financed (growth capital-backed) IPOs and to see what factors influence such performance. Along with long-term performance calculations, short-term was also calculated to observe the patterns and their further influence on the long-term.
The sort-targeted performance was calculated with cumulative abnormal returns, while they were long-term using buy-and-hold abnormal returns. The return on assets could contribute positively to long-term aftermarket results, as some were statistically significant. As growth capital-backed IPOs perform better in the long term, it can help sustain decisions for both sides of stakeholders.
The further development of the research could be done in terms of conceptual background, that is, a more standardized and robust identification of growth capital-backed companies could be carried out. The long-term underperformance of initial public offerings: Evidence from venture- and non-venture-backed firms.