Materials
of the IEEE International Conference
«Video and Audio Signal Processing in the Context of Neurotechnologies»
June 26-30 2017
St. Petersburg, Russia
Organizers
Pavlov In s t i t u t e o f Ph y s i o l o g y
R
ussianA
cademy ofS
ciencesFASO Russia
FEDERAL AGENCY
OF SCIENTIFIC ORGANIZATIONS
Нейроиконика
Нейромеханика
Website: https://spcn.co/
Proceedings o f the Conference
Color palettes with assigned properties in metric space
Sauta* O.I., Rumyantsev** P.A., Kaziev** I.A., Kurylev** M.B., Kryukovsky** E.S., Fazleyev** A.Yu.
* JSC ”VNIIRA ”
** JSC ”VNIIRA-NAVIGATOR”
e-mail: kazis_@mail.ru
The possibility of developing color palettes with the specified color characteristics for use in avionics based on an equal-contrast isotropic space calculated using a spherical (metric) model is considered. Such color palettes are used in ergotic systems to encode information of proximity to the earth, a cartographic landscape in order to develop on-board equipment on aircraft to ensure flight safety.
Keywords: color, color palettes, anisotropic color space
The problem o f creating equal-contrast (isotropic) spaces for color monitors, in TV, in avionics, and photoiconics is very relevant at the present time. Until recently, the creation o f equal- contrast spaces was solved using the MKO-76 (CIE) formulas (ДЕ Lab and ДЕ Luv) and the calculation o f small color differences (SCD). However, there are also large color differences (LCD), which are measured and calculated as well as small differences. In the practice of colorimetry, there was no need to measure such large differences until recently, so for this purpose it is necessary to create isotropic, equal-contrast spaces. It was in avionics that such problems appeared where color coding is successfully applied in systems o f proximity to the earth, aircraft navigation systems with color indication o f navigation maps, landscapes and in other multifunctional aviation complexes.
The purpose o f this work is to create a tool for building equal-contrast and uniform color palettes in avionics. Color coding has a positive effect on the pilots' activity in determining the spatial position o f the aircraft and removing it from dangerous situations [1]. In color alarm systems, the following colors are used: red - alarm, green - notifying, blue - notifying, yellow - warning, white - notifying. These colors constitute a minimal color palette that can be expanded to 7-16 colors or more, depending on the purpose o f the system. With a large number o f colors in the palette, errors in determining the color can be made when it is perceived by the pilot.
1. "Equal-contrast"palettes are considered in which the contrast o f color stimuli relative to the background o f the display screen is set by the identical sensation. Equal-contrast palettes allow:
- provide detection o f stimuli with a given probability o f detection and the required detection time [2];
- exclude errors in determining the colors o f the palette;
- determine the parameters o f the color stimuli o f the palette in the design o f the equipment, its production and control during operation.
2. It is shown that to create color equal-contrast palettes it is necessary to use the metric color space (MCS) [3]. In the MCS (Fig.1), the color characteristics o f stimuli through color tone (ф),
saturation (S) and lightness (B) are uniquely determined. Parameters o f stimuli are calculated from their spectra [4].
векторном пространстве
Рис. 4 Цветовая палитра с "равномерным"
шагом по цветомову тону
In the MPC, the achromatic brightness contrast is a particular case o f color contrast k e and can be calculated from the formula [5] (Fig. 2):
krel = {1 + (А/Ар)2 - 2(A/Ap)[SSpf o s hp + (1 - S2)0’5 (1 - V ) 0’5]}0’5, where Др = I p i—ф21,
where А, А р - moduli o f vectors o f stimulus color and background; S, Sp - saturations of stimulus color and background; Др - the angle between the color tone o f the stimulus and the background.
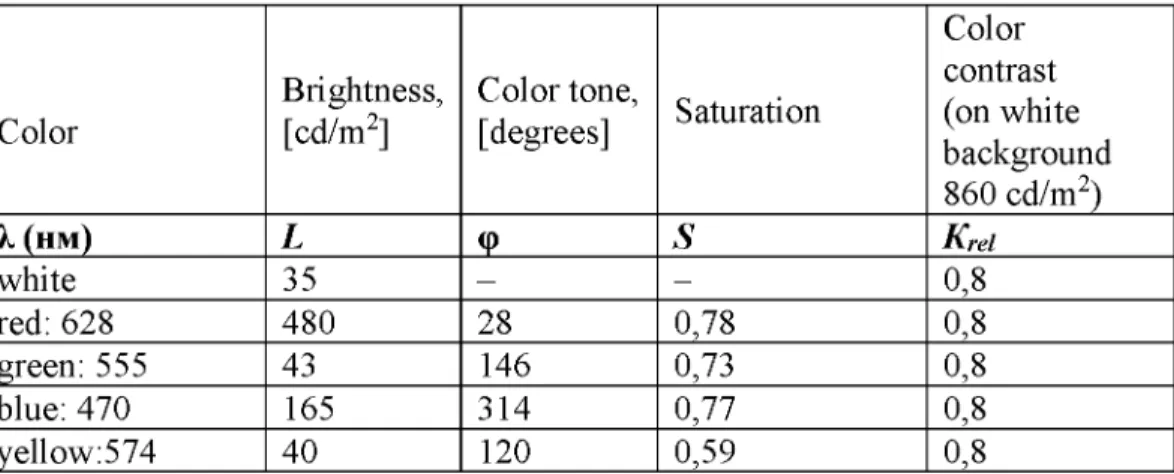
In an equal-contrast palette for all stimuli, the k e value should be the same for the display background (see Table 1, Fig. 4).
1. Achromatic (brightness) component Iw = L.
The photometric brightness L is measured. For measurement, a photometer is used whose spectral characteristic is corrected for the function o f the relative spectral efficiency o f day vision V(k).
2. Red-green component Irg
The determination o f Irg is made by measuring the spectral density o f the light flux by a TKA- VD type spectrometer and by numerically integrating (summing) the product o f the spectral density values o f the light flux and the values o f the weighting function V gW=(x (A )-y (A ))
3. Yellow-blue component Iyb
The determination o f Iyb is performed in the same way as Irg by measuring the spectral density o f the light flux by the spectrometer and numerically integrating (summing) the product o f the
spectral density values o f the light flux and the values o f the weighting function Vyb
(A) = 0,4 y(A) - 0,4Z(A)
5
where x(A) are the specific color coordinates XYZ in the MKO-31 system.
4. Calculating the intensity (power) o f color I.
I Iw +
I
IrgI
+I
Iybl5. Computing the components (scalar coordinates) and the color vector module А Ac = ( I)° ’5, Aw= ( I )0’5 , Arg = (Irg) 0’5 , Ayb = (Iyb)0’5.
6. Calculating the color component (scalar coordinate) Ac Ac = (Arg 2 + Ayb2)0,5
7. Calculating saturation S S = Ac / Aw
8. Calculation o f the component (scalar coordinate) o f the uniformly energetic white W (whitenesses)
W=Aw / Ac = (1 - S2)0’5
9. Calculating the color tone ф (angle in the color plane) in degrees ф [deg] = ( - 1 ) mArccos( Arg / Ac) + n 180,
m = 0, n=0, for Irg > 0, Iyb> 0
m = 1, n=1, for Irg< 0, Iyb > 0
m = 0, n=1, for Irg < 0, Iyb < 0
m = 1, n=2, for Irg > 0, Iyb < 0
The angles in the plane in the chromaticity are measured with respect to the direction "0-3 hours", counterclockwise.
10. The results o f measurements and calculations are presented in Table 1 for two photometric brightness values o f 150 cd/m2 and 75 cd/m2.
radiation - lightness B.
В = (L)0,5/ W= (L)0,5/(1 - S2)0,5.
It is known that the ability to provide a perception o f the difference between the details o f the light field o f a visual indicator screen is a decisive characteristic o f the operation o f the display equipment. Ergonomic design, as well as other stages o f the life cycle o f the visual information display equipment, needs a numerical indicator characterizing the perception o f the difference in the details o f the color image, based on measuring the physical characteristics o f the light stimuli. Such indicator, determined in a metric color spaceT(MCS), is relative contrast to £rel. Relative contrast krel can serve as a working tool for determining the technical specification of the indicator, setting the regulatory requirements for the light indicators o f a color indicator, their production and operational control o f the relevant psychophysiological characteristics o f human
perception o f the light. For example, we refer to such standards as the effectiveness o f detecting colored objects, separating the multicolored fragments o f the image and the background, distinguishing the details o f the image with color coding, a palette o f encoding colors, optimizing the choice o f colors for various combinations o f "color mark" - "background color" and others.
The standards krel in these cases should be no less than some maximum permissible value. In the same way, krel can be used to normalize the permissible color and lightness irregularities. To ensure that the irregularities are not visually detected, the values o f krel should not exceed the threshold values. Similarly, it is possible to normalize other image defects, the perception of which is not permissible.
The initial data for the calculation o f krel are presented in Table 1, the indices 1 and 2 in the formula for krel are assigned so that А1/А2 <1.
The results o f calculations krel with the identical photometric brightness equal to 150 cd/m2 are given in Table 1.
In the MCS, the achromatic brightness contrast is a particular case o f color contrast krel and can be calculated by the above formula, where A1, A2 are the moduli o f the stimulus and background color vectors; Si, S2 are saturation o f stimulus and background colors; Дф is the angle between the color tone o f the stimulus and the background.
In an equal-contrast palette for all stimuli, the values o f krel should be the same for the display background (Fig.4).
Table 1 Equal-contrast palette o f colors in metric color space
Color
Brightness, [cd/m2]
Color tone,
[degrees] Saturation
Color contrast (on white background 860 cd/m2)
X (нм) L Ф S Krel
white 35 - 0,8
red: 628 480 28 0,78 0,8
green: 555 43 146 0,73 0,8
blue: 470 165 314 0,77 0,8
yellow:574 40 120 0,59 0,8
3. A special case o f a "uniform" palette is considered, in which the hue changes from a red color (X = 700 nm) to a green (X = 555 nm) monotonically through equal intervals (angles) (Fig.
4). In the MCS, the angles that contract the arcs o f 1-2, 2-3, ... 6-7 are the same. Therefore, the change in the color tone in the palette by sensation should be uniform. The table 1 shows the calculation data between the corners o f the color tone в and the magnitude o f the dominant wavelength Adom by the color tone o f the palette o f seven colors with uniform color tone variation. Using the MPC allows to implement color palettes with the specified properties:
"equal-contrast" color palettes and "uniform" color palettes.
References
1. Silvestrov M.M., Begichev Yu.I., Varochko A.G., Koziarov A.M., Lukanichev V.Yu., Naumov A.I., Chernyshev V.A. Ergatic integrated systems o f aircraft/Under the editorship o f M. Silverstov. - M.: Branch o f Military
Publishing. 2007. 512 p. [in Russian]
2. Travnikova N.N. Efficiency o f visual search. - M.: Mechanical Engineering, 1985. 128p. [in Russian]
3. Judd D., Vyshetsky G. Color of science and technology. - M.: Mir, 1978. - 592p. [in Russian]
4. Polosin L.L. Method for evaluating the quality o f reproduction o f color images by optoelectronic systems. / / Author's abstract. Doct. SPb: SPbGTMO, 1997. - 34p. [in Russian]
5. Kaziev I.A., Rumyantsev P.A., Sauta O.I., Shmulevich V.L. Estimating the contrast in metric color space with luminance, saturation, and hue coordinates // Journal o f Optical Technology. 2015. Т. 82. № 9. С. 629-633.
Anisotropy and gold proportions in visual apparent motion
Kolbanov V. V.
I. P. Pavlov First Medical University, St.Petersburg, Russia;
e-mail: kolbanovv@bk.ru
Visual phenomenon of apparent motion ф -motion) was investigated monocularly and binocularly in 22 men. Distance between light sources was 6° in each of eight meridians of visual field, flash duration - 25 ms, variable time delay between flashes - from 75 to 150 ms.
Time ranges of the phenomenon were from 75 to 140 ms in the centre of visual field and from 80 to 150 ms in parafoveal areas. In the region of blind spot apparent motion had the same character as in other meridians within 12-18° eccentricity. Minimal time delay with phenomenon beginning was in left meridian, with phenomenon disappearance - in left, right and lower meridians of visual field. Maximal time interval for phenomenon disappearance was in the upper part of visual field. Differences between meridians were similar during the monocular and binocular observations, but binocular variations were smaller. These results make it possible assuming that brain mechanisms of the visual apparent motion are kindred with analysis of real motion.
Keywords: light flashes. central and periphery vision, monocular and binocular observation, visual apparent motion, anisotropy
Introduction
Apparent motion is the visual illusion in which the visual movement perception appear in the absence real object motion. First investigator who discovered this phenomenon was S.Exner [1] , but by far later M .W ertheimer [12] made first attempt to analyse in detail the dependence this illusion on several parameters complex. For the phenomenon explanation W ertheimer proposed a hypothesis o f excitation spreading according to which interaction between excitations conditioned by both stimuli take place in brain or in the retina. According to W ertheimer opinion the phenomenon may appear with pause between light stimuli from 60 to 200 ms. Later by efforts o f many authors another parameters o f apparent motion were studied and classified.
According to majority o f classifications apparent motion was named as optimal motion (ф- phenomenon) or as P- motion. Its appearance is conditioned by many parameters among which next may be named as main:
• stimuli intensity,
• stimuli dimensions and forms,
• exposition duration,
• angular distance between stimuli,
• time delay between stimuli,
• repetition frequency o f stimuli pair,
• observation continuance.
Interdependence between these parameters does not studied finally, but some fundamental interrelations were formulated in form five laws o f Korte [7] . According these laws optimal motion may appear within delay range 80 ... 400 ms [9].
Results o f some authors investigations demonstrate perceptive nature o f this illusion.
Phenomenon beginning are connected with existence o f motion direction detectors selective oriented and having anisotropic peculiarities [4]. Visual ’’motion inertia” is explained by special
connections between directoral sensitive motion detectors which create feedback and provide
“pre-tuning” o f detectors disposed farther along the rectilinear trajectory [10].
Arguments in favour o f central mechanisms o f apparent motion presumably in primary cortex regions are received indirectly. Notions about cortical interaction between adjacent neurons have a central place in explanations o f physiological essence o f this illusion [2].
In comparison o f real and apparent motions perception some distinctions are revealed [5], but psychophysiological investigations much more convince in correctness o f hypothesis about identity their mechanisms [11]. Probability o f apparent motion appearance in dependence on time delay showed relative uniformity within the limits about 6° [6]. However minimal distance between stimuli (threshold) increased with eccentricity from 6 to 25 degrees [3].
Methods
This investigation purpose was the elucidation (clearing up) o f anisotropy character in apparent motion phenomenon.
The panel in frontal flatness (campimeter) with light emitting diodes was used for the phenomenon investigation along eight meridian o f visual field. Apparent motion was observed monocularly and binocularly by 22 adult men. Light flashes duration and time interval between two flashes were provided by circular rotation o f metal conductor gliding along the arc with two stripe o f metal closing the electric circuit. Distance between stripes was changing for the regulation time delay between two stimuli. Contact and pause were conditioned by motor rotation with angular velocity 1 per second. Distance between light source in each meridian was redirected to visual field centre (0 ... 6 degrees) or to near periphery (12 ... 18 degrees). Flash succession had a centrifugal character.
Background illuminance was 10 lx, both stimuli had angular size 14 minutes in diameter, flashes luminance - 5 cd/m2, each flash duration - 25 ms.
Results and Discussion
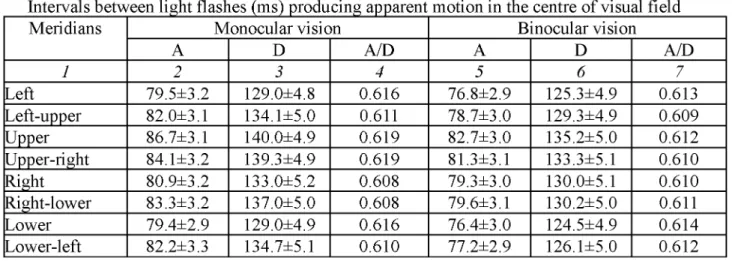
The investigation results are demonstrated in tables 1 and 2. Both tables have identical construction. In first column are named visual field meridians, at columns 2 and 5 - time intervals between flashes appropriate to phenomenon appearance (A, ms), columns 3 and 6 - disappearance time (D, ms), columns 4 and 7 - ratio o f appearance to disappearance time (A/D).
Table 1 Intervals between light flashes (ms) producing apparent motion in the centre o f visual field
Meridians M onocular vision Binocular vision
A D A/D A D A/D
1 2 3 4 5 6 7
Left 79.5±3.2 129.0±4.8 0.616 76.8±2.9 125.3±4.9 0.613
Left-upper 82.0±3.1 134.1±5.0 0.611 78.7±3.0 129.3±4.9 0.609
Upper 86.7±3.1 140.0±4.9 0.619 82.7±3.0 135.2±5.0 0.612
Upper-right 84.1±3.2 139.3±4.9 0.619 81.3±3.1 133.3±5.1 0.610
Right 80.9±3.2 133.0±5.2 0.608 79.3±3.0 130.0±5.1 0.610
Right-lower 83.3±3.2 137.0±5.0 0.608 79.6±3.1 130.2±5.0 0.611
Lower 79.4±2.9 129.0±4.9 0.616 76.4±3.0 124.5±4.9 0.614
Lower-left 82.2±3.3 134.7±5.1 0.610 77.2±2.9 126.1±5.0 0.612
Table 2
Intervals between light flashes (ms) producing apparent motion in paracentral parts o f visual field
Meridians M onocular vision Binocular vision
A D A/D A D A/D
Left 90.6±3.3 146.7±4.9 0.618 84.8±2.5 138.1±4.8 0.614
Left-upper 95.5±3.3 156.2±5.1 0.611 88.4±2.3 144.2±4.9 0.613
Upper 96.7±3,3 157.0±5.3 0.616 88.9±2.2 144.5±4.7 0.615
Upper-right 94.6±3.3 155.0±5.7 0.610 88.9±2.6 144.9±5.0 0.614
Right 90.9±3.4 149.4±5.5 0.608 85.3±2.6 140.6±5.0 0.607
Right-lower 91.0±3.3 147.3±5.5 0.618 85.5±2.9 139.9±5.1 0.611
Lower 90.1±3.1 146.2±5.6 0.616 83.3±2.8 134.8±5.0 0.618
Lower-left 91.1±3.2 147.8±5.6 0.616 85.3±2.6 139.3±4.9 0.612
Obtained results permit notice that pauses between flashes corresponding to phenomenon appearing and disappearing always are less in the visual field centre than at near periphery.
Thresholds o f time delays decrease when observation is binocular against monocular.
Differences between meridians have almost identical character with monocular and binocular observations, but they have quantitative distinction only. Threshold light flashes delay is minimal in the lower half o f visual field. By indirect way these results testify about mainly central nervous phenomenon mechanisms so far as images incidence on the non-identical retinal regions can't provide information cultivate identity in retinal neuronal chains. Binocular interaction facilitating the phenomenon appearance can't find the explanation o f the illusion essence by peripheral mechanisms only. These mechanisms localized probably in central neuronal nets o f visual system, accomplishing furthermore real motion analysis. In region o f the blind spot apparent motion retain same qualitative peculiarities as in other meridians attached to same eccentricity. There was not a single event o f phantom flash in the region o f blind spot as in Lockhead a.o. investigations [8]. Optimal motion in this zone preserve its smoothness and thus confirm its central origin.
Extrapolation o f apparent motion trajectory is fulfilled some better during binocular observation than at monocular. Apparently this advantage is conditioned by binocular summation least o f all.
Interocular distinctions and excitation synchronization in visual centres have far greater importance in such case.
Common peculiarity is exposed in all visual field meridians. Time intervals o f phenomenon appearance in ratio to disappearance time (A/D) fluctuate near to 0.618 in accordance to the law o f “gold section”
References
1. Exner S. Ueber das Sehen von Bewegungen und die Theorie des zusammen-gesetzten Auges // Sitzungsb. d. k.
Akad. d. Wissensch., Wien. - 1876. - III Abth. - Bd. 72, Heft 8, Abt. 3. - S. 156 - 190.
2. Foster D.H., Thorson J., McIlwain J.T., Biederman-Thorson M. The fine-grain movement illusion: a perceptual probe o f neuronal connectivity in the human visual system // Vision Res. - 1981. - Vol. 21, No 7. - P. 1123 - 1128.
3. Foster D.H., Gravano S., Thorson J. Acuity for fine-grain movement illusion varies little with retinal eccentricity, unlike that for two-dot spatial resolution. //J. Physiol., Gr. Brit. - 1982. - Vol. 328. - P. 36 - P.37.
4. Hirata T. Perceived direction o f apparent movement //Tohoku Psychol. Folia. - 1982. Vol.41, No 1-4. - P. 35 - 41.
5. Kolers P.A. The illusion o f movement // Scientific American. - 1964. - Vol. 211, No 4. - P. 98 - 106.
6. Kolers P.A., Grunau M., von. Fixation and attention in apparent motion // Quart. Journ. exp. psychol. - 1977. - Vol. 29, No 3. - P. 389 - 395.
7. Korte A. Kinematoskopisce Untersuchungen //Ztschr. f. Psychol. - 1915. - Bd. 72, Heft 1-2. - S. 193 - 296.
8. Lockhead G.R., Johnson R.C., Gold F.M. Saltation through the blind spot // Percept. Psychophysics. - 1980. - Vol. 27, No 6. - P. 545 - 549.
9. Neehaus W. Experimentelle Untersuchung der Scheinbewegung // Arch. f. d. gesammte Psychologie. - 1930. - Bd. 75, Heft 1-2, S. 315 - 458.
10. Ramachandran V.S., Anstis S.M. Extrapolation o f motion path in human visual perception // Vision Res. - 1983.
- Vol. 23, No 1. - P. 83 - 85.
11. Robins C., Shepard R.N. Spatio-temporal probing o f apparent rotational movement // Percept. Psychophysics. - 1977. - Vol. 22, NO 1. - P. 12 - 18.
12. Wertheimer M. Experimentelle Studien uber das Sehen von Bewegung // Ztschr. f. Psychologie. - 1912. - Bd.
61, Heft 1. - S. 161 - 265.
Abstracts of the Conference
Development of a method for increasing noise immunity in the filtration of phonocardiograms Aimukhanbetov E., Koishybaev D., Abdulkhairov M.
ITMO University, St. Petersburg, Russia
To increase the accuracy and stability of the registration of phonocardiograms in electronic stethoscopes, a new treatment method is needed which will allow us to obtain clear waves of cardiograms. To eliminate the negative effects of phonocardiograms, a cascade algorithm based on a bandpass filter was constructed.
This cascade algorithm, in contrast to others, can enhance low-frequency sound waves of the heart and improve the accuracy of identifying the components of phonocardiograms. In order to demonstrate the work, the developed cascade algorithm was modeled in the computer-aided design system Proteus. The results of the study show the limitations of all methods for processing phonocardiograms based on the electronic stethoscope and full compensation for the influencing noise. The article also presents the results of simulation of the electronic stethoscope printed circuit board, tracing and its 3D model. The algorithm of cascade filtration is recommended to be used in tasks of preliminary processing of biomedical signals, where it is possible to isolate the diagnostic features of the analyzed signals.
Echo thresholds in horizontal plane for stationary and moving lagging signals Agaeva M.Yu.
Pavlov Institute of Physiology Russian Academy of Sciences, St. Petersburg, Russia
The precedence effect refers to a group of auditory phenomena that is related to ability to localize sound sources in reverberant environment. In the present study, the precedence effect was explored using a sound localization task in the free field for lead-lag paradigm. This study compared the echo thresholds for stationary lag and moving lag. The lead was always stationary (+15°). The stationary lags were located at -86°, -52°, -18°. The moving lags traveled to or from the lead along two paths situated at two locations (-86° ^-52° and -52° ^ -18°). Results suggest that for the moving lag, the echo thresholds were not affected by path location and direction of movement (to or from the lead). The averaged echo thresholds ranged from 6.2 to 6.9 ms. In contrast, for the stationary lag, the echo thresholds depended on the lag location. The averaged echo thresholds increased from 5.1 to 7.1 ms when the lag was getting closer to the lead.
Noise robust processing of a speech signal in robot control tasks Abdulkhairov M., Aimukhanbetov E., Koishybaev D., Serikkazhiyeva R.
ITMO University, St. Petersburg, Russia
Existing algorithms for filtering voice signals in the presence of intense noise do not satisfy the requirements. Therefore, the development of methods for increasing noise robust in the transmission of speech signals for robot control is an actual task.
To improve the efficiency of filtering, adaptive filters with extended frequency bands can be used. This approach can improve noise robust and reduce the value of errors in the robot control task.
The review of algorithms of filtering of speech signals is presented. Based on the proposed algorithm for filtering the speech signal, which significantly expands the range of the signal-to-noise ratio of the control noisy speech signal. A comparative analysis of the characteristics of the developed algorithm with known
methods of filtering the speech signal is carried out. The developed algorithm of an adaptive speech signal processing. The efficiency of the proposed cascade filter is demonstrated by computer simulation.
The presented noise robust algorithm allows you to extract information about yourself during the characteristic in conditions of unstable dynamics and in the presence of interference, which allow you to control mobile robots. Practical application of this method allows to significantly expanding the management capabilities of mobile robots.
Visually evoked emotional reaction recognition based on physiological tremor acquisition Aleksandrov A.A., Uplisova K.O., Ivanova V. Yu.
Saint-Petersburg State University, St. Petersburg, Russia
The paper is dedicated to novel technique for emotionally significant stimuli recognition assessment based on physiological tremor analysis under various experimentally emulated types of affective load.
Physiological tremor acquisition was implemented by bilaterally attached 3-axial digital accelerometers, fixed on external side of index fingers. The first experimental protocol includes randomized presentation of four variant visual stimuli, one from the followed - subject’s second name, random shuffled letters of second name, graphic representation of simple arithmetic expression with correct or incorrect answer. The other one was the experimental remake of applied polygraph testing technique “concealed information test” with visually presented simple number set from zero to seven. Data preprocessing was realized basing on singular spectrum analysis filtration and trend reduction. Amplitude and instantaneous frequency dynamics was assessed by Hilbert transform. The data analysis explained unconscious psychomotor reactions under emotionally loaded visual stimuli perception. The same result was obtained in both experimental protocols. The significant changes in short-term (250 - 750 ms) evoked physiological tremor dynamics were established on visually applied stimuli with the most significant affective load.
The neural basis for absolute disparity coding in the primary visual cortex Alekseenko S.V.
Pavlov Institute of Physiology Russian Academy of Sciences, St. Petersburg, Russia
The human visual system is sensitive to disparity between the two retinal images. Disparity is analysed by binocular neurons located in many cortical areas and is used for spatial localization, 3D shape perception, scene segmentation and guidance of eye movements. Disparity analysis is first performed in area V1, where visual pathways from two eyes are combined for the first time. Cumming and Parker (1999) have shown that V1 neurons do only detect absolute disparity which is the difference in the two retinal images with respect to the point of bifoveal fixation.
To understand the mechanism of absolute disparity detection we have analysed the distribution of monocular signals within V1 for dot-objects located in different spatial locations. The positions of monocular neurons activated by such objects are defined by the retinotopic organization of area V1 and by different directions of visual pathways from nasal, temporal and naso-temporal overlap zones in retinae. Viewing distance and gaze direction will not change this pattern of retinal projections to cortical area. It means that disparity-tuned binocular neurons of V1 (formed by the convergence of monocular cells) should encode the absolute disparity only.
Justification of the use of empirical mode decomposition for the processing of bioelectrical signals in the time-frequency domain: ECG, EEG, EMG
Altay Y.A., Kremlev A.S.
ITMO University, St. Petersburg, Russia
In the last five years actively developed preprocessing bioelectric signals technology (BES), which allows identifying the functional state of the organism (FSO) of a person at an early stage of the disease. In connection with the diversity of features and characteristics of BES in comparison with physical signals, the choice of the algorithm for processing and analyzing BES is a difficult task, namely for signals of electrocardiograms, electroencephalograms, electromyograms (ECG, EEG, EMG). By the time the problem of automatic processing and analysis of bioelectric ECG, EEG, EMG signals against noise, interferences and artifacts has developed into a separate direction of modern information processing methods. To solve the above problem, the existing algorithms for processing BES involve the use of stationary signals and linear algorithms. As a result of the processing, the diagnostic features are distorted and partially removed from the mixture of analyzed signals. However, BES is nonlinear and non
stationary. To solve this problem currently BES processing technique chosen based on empirical mode decomposition on that are designed to handle non-linear and non-stationary signals. The essence of this technique is an adaptive decomposition into empirical modes and then the Hilbert transform is applied to the obtained modes for the subsequent use of diagnostic information in the time-frequency domain. Also of note, BES processing in time-frequency domain allows to visualize the analyzed signals on the 3D surface, which will allow researchers to identify new diagnostic features which are invisible when 2D surface.
Power and shift invariant detection of dynamically coupled networks (PSIICOS) from non-invasive MEG data
Altukhov D., Ossadtchi A.
HSE, faculty of computer science; HSE, center for cognition and decision making; MSUPE, MEG- Center, Moscow, Russia
One of the most important tasks of modern brain electrophysiology is the study of so-called functional connectivity, a phenomenon in which spatially separated regions of the cortex and subcortical structures of the brain synchronize their electrical activity to solve a particular cognitive task. At the same time, there is no single "correct" method for assessing connectivity. Rather, the existing methods are a set of heuristics, each of which has its own advantages and disadvantages. Such a variety of methods is associated, on the one hand, with the fundamental limitations of electromagnetism and the ill-posedness of the inverse problem in electrophysiology, and on the other hand, the fact that the problem of assessing connectivity in non-invasive data is relatively new and poorly understood. The report will review existing methods in the field of connectivity estimation, and also offer an original approach to the problem, allowing under certain conditions to improve the quality of network detection in comparison with existing algorithms.
Algorithms and software for detecting neurons in images of the cat’s spinal cord slices Bakhshiev A.V., Mikhailov V.V., Merkulyeva N.S., Veshchitskii A.A., Musienko P.E.
The Russian State Scientific Center for Robotics and Technical Cybernetics, St. Petersburg, Russia
The development of data analysis tools for neuromorphological experiments is significant task that can increase the effectiveness of studying the neuronal control of sensorimotor activity and information processing. We proposed the method for semiautomatic detection of neurons at histological slices. The algorithm is based on converting the original image into the LAB color format and subsequent threshold filtering. It allows to detect neurons without knowing the size, shape and number of objects. A disadvantage of such solutions may be mentioned occurrence of noise caused by poor-quality images, and the presence of foreign elements in the image. A software has been developed to systematize information from a variety of experiments, perform neuron detection on selected slices, visualize the detection data and make their post-processing in a manual mode by adding and removing rectangles describing neurons from the original cut image. In addition to solving the problem of systematizing these experiments, the developed software can be used to mark up data and form training samples. Such samples can be used to synthesize new algorithms for detecting neurons, based on methods of machine learning.
Measurement and computer animation of phase shifts in EEG Belov D.
Saint-Petersburg State University, Department of psychophysiology, St. Petersburg, Russia
During the multielectrode EEG recording one can see that oscillation arises in one point, then spreads on the head surface and runs around it on some trajectory. Possible trajectory and rate variants of «EEG travelling wave» are very multiform and changeable. The general character of the dynamics descripted varied from man to man, depends on functional state and follows the certain regularities.
In the laboratory of EEG in S-Petersburg State University there was created the technique of computer animation of EEG parameters with the overlay of the picture on the brain cortex 3-dimentional model.
Oscillations originally arise in the areas marked as red ones and then spread from these epicentres. On the contrary, the blue areas indicate the «flowing points» of the potential travelling waves. It is possible to observe the brain model from any point or to depict it on plane as well as to launch animation with accelerated, slowed down or real time speed. It should be noted, that here we are dealing with not a simple visualisation of potential, but more complex original mathematical apparatus is used We use of cross-correlation function to estimation of time (or phase) shifts between EEG recordings of neighbouring electrodes.
Due to its mobility, animation has the advantages of traditional EEG in the form of curves, which represent the accurate time description of the processes. But in addition animation makes obvious the spatial processes correlation - it may be approximately considered, that we see through the skull how something spreads on the cortex surface on the changeable trajectory with the variable rate. So this technique combine to some extent the advantages of traditional EEG and tomography. Now the studies are conducting, which will allow the differentiation of pathological and normal EEG as well as distinguishing of the different forms of bioelectrical activity disturbances using animation.
Modelling of the psychophysical experiments results by neural networks Bondarko V.M., Bondarko D.V., Solnushkin S.D., Chikhman V.N.
Pavlov Institute of Physiology Russian Academy of Sciences, St. Petersburg, Russia
We compared experimental psychophysical data with modeling results to the study of signal processing mechanisms in visual system. It is believed that some visual illusions arise from the spatial-frequency filtering of images on the level of the primary visual cortex. In psychophysical experiments we investigated the Oppel-Kundt illusion. Spatial intervals were limited by two straight or curved parallel lines. Several additional lines divided spatial intervals into equal parts. The width of spatial intervals varied from 2.56 to 3.12 angular degrees. We founded the invariant dependence of the illusion on number of lines with respect to the interval size. Maximum of illusion was between the four and seven lines. The distortions of size relations of certain parts of the stimulus were determined by processes with receptive fields of the visual system. The spatial properties of simple and complex receptive fields of neurons of striate cortex were used. Model of modules (Gleser, 1985), consisting of 4-5 harmonics, gave a qualitative agreement between psychophysical measurement of the strength value of the illusions and the predictions of physical model. The size of module which gave maximal response on spatial interval with additional lines was taken as a size of illusion.
Development of the technology of microwave encephalography (MVEG) for the diagnosis of nervous diseases and mental disorders of the human brain, the study of human activity in the norm and the organization of a new type of neuro-computer interface
Brusilovsky L.I., Bryukhovetskiy A.S.
Network-Service, LTD, Moscow, Russia
NeuroVita Clinic of Interventional and Restorative Neurology and Therapy, Moscow, Russia
In the course of their own research, the authors were the first in the world to provide experimental evidence of the existence of human brain (HB) electromagnetic activity in the range of electromagnetic waves of UHF and MWF frequencies from 1.5 to 5.0 GHz with a signal power of -100 dBm .. 80 dBm (1e-13..1 e-11 W). In fact, a new channel for transmitting information to the HB has been discovered. The experimental studies made it possible to propose a fundamentally new technology for diagnosing and visualizing the state of HB, which the authors called microwave encephalography (MVEG), for diagnosing the norm and pathology of a number of functional and emotional states of hypoxia (depression, aggression, emotional instability), mental disorders and mental illness. The instrumental base of MVEG is the developed complex of high-sensitivity microwave equipment, software and program- method that will allow recording the amplitude-frequency characteristics of the electromagnetic activity of the HB in the UHF and MWF frequencies in real time and transmit data to the computer for further processing.
Features of visual processing in children with atypical development Cherenkova L.V., Sokolova L.V.
Saint-Petersburg State University, St. Petersburg, Russia
The effect of pre-exposure stimuli with a low spatial frequency on the time parameters of identification in pre-school children with typical and atypical development was investigated. Analysis of the dependence of the reaction time on the interval between the low-frequency prime and the high-frequency test stimuli showed that, in typical development, a significant decrease in the time of recognition of stimuli in the
interval from 100 to 300 ms after presentation of the prime is observed. In children with a delay in mental development, the effect of facilitating the recognition of the test stimulus begins to appear after 200 ms after the prime, but stabilizes after 400 ms. In children with autism spectrum disorder, there was no reliable dependence of the reaction time on the interval between the primer and the test stimulus.
However, we can note a tendency to decrease this parameter when identifying stimuli with a high spatial frequency in the interval 300-500 ms. In general, the results obtained indicate that, with typical development, the process of processing information in the low-frequency channel of the visual system affects the processing of information in the high-frequency channel of the visual system. When mental retardation is delayed, this effect is weakened, and in the disorder of the autistic spectrum is significantly impaired.
Local linearity approach for extracting physiologically plausible interpretations of non-linear decision rules in EEG classification
Dagaev N., Ossadtchi A.
Centre for Cognition and Decision making, National Research University Higher School of Economics, Moscow, Russia
Interpretation of decision rules provided by trained classifiers if of a great importance in neuroimaging studies. Explanations in terms of physiologically plausible activation patterns (corresponding to the forward model of a signal) are especially significant in cognitive science. However, whereas it can be easily done for a linear classifier, non-linear classifiers do not provide a straightforward way to derive such activation patterns. Here we propose a novel algorithm for extracting activation patterns from the trained neural network's decision rule. After a neural network has been trained to discriminate between two classes, one can derive physiologically plausible activation patterns given that the classes have an underlying XOR structure. These activation patterns will correspond to the forward model’s vectors reflecting the sources that vary between conditions. The derivation of these activation patterns is possible since the decision boundary found by the network is piecewise linear; that is, it is approximately linear in regions of the input space corresponding to the XOR conditions. Given that the identification of such regions is feasible, one can treat the neural network as a linear classifier at these regions. We demonstrate the validity of the present algorithm on both simulated and real data.
Application of scalable heterogeneous classifier of EEG patterns of fine motor imaginary decoding for Brain-computer interfaces (BCI)
Gundelakh F., Nagornova Zh., Sonkin K., Chevykalova A., Khomenko Y., Stankevich L., Shemyakina N.
SPbSTU, IEPHB RAS, IHB RAS, Moscow, Russia
The study aimed development of BCI on base of EEG single-trials decoding during fine imaginary movements. EEG registrations were made with participation of 10 subjects [mean age - 26.2±3.1[SD] by means of portable EEG-amplifier "SmartBCI" ("Mitsar", St. Petersburg) from 19 AgCl electrodes(10-20), in a frequency band 0.53 Hz-30Hz. The subjects performed real and imaginary movements in given rhythm, separately for four fingers of one hand. Only trials (600 ms length) with imaginary finger’s movements were analyzed. Comparative analysis of preprocessing of EEG signal transformations (weighted average reference, independent component analysis, current source density transform), extraction of new features from EEG patterns of imaginary movements (wavelet transforms, Mel- frequency cepstrum coefficients) was applied. Decoding of EEG patterns was carried out by committee of classifiers on base of ANN and SVM. Analysis of classification accuracy for motor imagery EEG pattern decoding in single-trial approach revealed that the best result was obtained using current source
density transform together with feature extraction of cepstrum coefficients and the complexity of a signal curve. Classification accuracy of 4 classes of fine imaginary movements was 66%±8[SD] at average and 79%- max.
Supported by RFBR #16-29-08296-ofi-m.
EEG of rhesus monkeys in resting-state conditions and under photic stimulation Harauzov A.K., Ivanova L.E., Varovin I.A.
Pavlov Institute of Physiology Russian Academy of Sciences, St. Petersburg, Russia
Monkeys are considered as a closest animal model for investigation of the human brain functioning. In our experiments we recorded intracranial EEG of rhesus monkeys by epidural electrodes placed on frontal, central, parietal and occipital lobes and also by subdural electrodes placed on the medial surface of parietal area (PGm). Recordings were performed in resting state conditions and in response to flash stimulations with frequencies ranging from 4 to 38 Hz with the step of 2 Hz.
Spectral analysis of the monkey’s EEG recorded in resting-state conditions revealed two dominant frequencies: at around 10 and 20 Hz. Frequency of 9-10Hz was more prominent at occipital and PGm areas, whereas frequency of 20 Hz was maximal at electrodes placed on lateral parts of parietal lobes. The third robust but small amplitude peak in the spectrum was observed in central frontal areas. Its frequency was about 38 Hz. EEG responses to photic stimulation depended on frequency applied and were maximal in occipital and medial parietal areas at flash frequencies of 14 and 28 Hz.
Investigation of cognitive abilities of rhesus monkeys Ivanova L.E., Podvigina D.N., Varovin I.A., Harauzov A.K.
Pavlov Institute of Physiology Russian Academy of Sciences, St. Petersburg, Russia
In behavioral experiments we studied the ability Macaca mulatta monkeys to perform cognitive tests with different levels of difficulty presented on a touchscreen. The task was to determine a dominant orientation within patterns ordered in different way. We analyzed learning rate, the number of correct answers and reaction time in dependence of the task complexity. At the same time we estimated investigatory activity by measuring time of reaction to a novel object.
The percentage of the correct answers was higher for more ordered test images and close to the one obtained before for human subjects in similar experiments. The investigatory activity index correlated with the learning rate and was lower for those monkeys, who demonstrated longer reaction time and had a tendency for attention distraction. The results enable us to model neuronal processes occurring in the human brain during object recognition, from coding of image physical characteristics to decision making.
The relationship between the level of investigatory activity and the learning rate makes the novel-object test a promising evaluative tool for choosing perspective monkeys for behavioral experiments, which can
significantly reduce the time of training.
Neural networks as a tool for forecasting innovation activity
Korableva Olga N., Doctor of Economics, ITMO University, Saint Petersburg State University, Professor, on.korableva@gmail.com. St. Petersburg, Russia
Erofeeva Kristina, ITMO University, Master degree student, erofeeva ks94@mail.ru, St. Petersburg, Russia
In order to understand the possible scenarios and develop strategies for responding to them, specialists from different fields of activity necessary to conduct a thorough analysis of the initial data that describes some phenomenon or process. Based on this analysis, predictions of these phenomena or processes using different methods. The results of this prediction are the basis for making strategic decisions. The field of innovation is no exception. Now more and more attention is paid to innovation at all its levels, from the scale of a private company and to the level of innovative activity of the country. This is so important because everyone is interested in improving own achievements in research and development. Therefore, forecasting of such activity is essential to adjust plans.
One of the most common methods for predicting indicators is application of neural networks. The popularity of neural networks is primarily based on their ability to learn and improve themselves. An important advantage of ANN is their high resistance to noise in the input data (the network is able to filter out unnecessary information). In addition, neural networks have a large computational power of neural networks. They are able to analyze large amounts of data with many variables. The same number of input variables, for example, in regression models would have reduced their effectiveness. Ann shows the best performance prediction accuracy compared to alternative methods.
The research is supported by the RFBR grant 16-29-12965.
Peculiarities of perception by first-graders of texts with a different format of visualization Koroleva E.E., Zashchirinskaia O.V.
Saint-Petersburg State University, St. Petersburg, Russia
The interrelations between the quality of perception and understanding of the text by first-graders and the text format were studied: the presence or absence of illustrations, the length of lines. 30 first-graders were examined, 15 of them were diagnosed with dyslexia. Using the specially formulated questionnaire of the respondent, the quality of perception and understanding of the text was measured, then the results were evaluated by student experts. Also with the help of the device "eyetracker" zones of interest and features of perception were defined. The results of children reading texts with different formats were compared, as well as the results of children with dyslexia and children without disrupting the reading skill. The results:
a link was found between the children's better perception of the text and the shortened length of the lines.
There is no significant connection between the presence of illustrations and the perception of the text. The connection of dyslexia with the worst perception of the text and a slower rate of reading has been revealed.
Working memory load in simultaneous language interpretation: an ERP study Koshkin R., Ossadtchi A., Shtyrov Yu.
Higher School of Economics, Moscow, Russia
We utilized the event-related potential (ERP) technique to study neural activity associated with different levels of working memory (WM) load during simultaneous language interpretation (SLI). We pioneered the use of the technique on conference interpreters articulating overtly. The amplitude of the N1 component elicited by task-irrelevant tone probes was significantly modulated as a function of WM load
but not the direction of interpretation. The N1 amplitude decreased with WM load suggesting shallower processing under high WM load regardless of the direction. Using our novel projection-based method we identified otherwise hidden WM load-dependent regularities in the P3 range. The results are discussed in terms of the Efforts Model of simultaneous language interpreting.
Localizing hidden regularities with known temporal structure in the EEG evoked response data Kuznetsova A., Koshkin R., Ossadtchi A.
Higher School of Economics, Moscow, Russia
We describe a novel data driven spatial filtering technique that can be applied to the evoked potentials in the EEG data in order to find statistically significant hidden differential activations, which can not be found by standard single-channel analysis. Underlying optimization problem is formulated as a generalized Rayleigh quotient maximization problem. The technique is based on the known morphological characteristics of the response: the optimal filter maximizes the difference in the target interval when the component typically occurs and at the same time minimizes the difference in the flanker interval. The technique is equipped with a relevant randomization-based statistical test to assess the significance of thus discovered phenomenon. The performance of the proposed method was evaluated with the simulated ERP data, the results are compared with the competing ICA-based method.
Furthermore, we describe an application of the proposed method to the EEG data acquired in two studies:
study devoted to the simultaneous language interpreting (group analysis) and analysis of the auditory neuroplasticity (single subject application). We show how the differential components can be detected after filtration and support our results with the permutation statistical test, topographies analysis and single-trial evidences.
Dependence of the characteristics of eye movements on the spatial-frequency properties of the stimulus
Lamminpiya A.M.
Pavlov Institute of Physiology Russian Academy of Sciences, St. Petersburg, Russia
During the reading process, the activity of the visual system depends on the activity of the visual channels, which distinguish different parts of the visible spatial-frequency range. We investigated the change in the nature of the eye movements during reading of texts, which images were subjected to digital filtering using wavelets. Provided data showing the dependence of the nature of eye movements on the space-frequency structure of the images. To explain the results, the role of mango- and parvo- systems in visual information processing within the visual field was considered. The spatial-frequency characteristics of the observed images are established, providing a completely unique type of eye movement - scan lines of text. Effective work with text is possible only in the presence and prevalence of spatial frequencies in the range from 3 to 8 cycle / degree. The decrease in the proportion of high spatial frequencies and the predominance of spatial frequencies to 2.5-3 cycle / degree results in the parvo- system, sensitive to high spatial frequencies, receiving insufficient information for efficient operation, but under the influence of the instruction, the reader continues scanning the still present lines, similar to the reading pattern of eye movements.
Some aspects of emotional response during social advertising’s perception by higher-educated students
Lomtatidze O.V., Alekseeva A.S.
Ural Federal University, Yekaterinburg, Russia
This work is devoted to the social advertising’s effect on the emotional potential of youth and includes complex psycholinguistic analysis of short movies with social orientation (social advertising). The analysis of several aspects of student's emotional response to the different stimulus zones of social advertising with use of methods of direct poll and eye-tracking was made. Respondents fix their comprehension of the main idea of the movie and allocate episodes which made the greatest impression on them. Eye-tracking allows specifying zones which mainly attract attention of students. The main emotions described by students after viewing of short movies with social orientation are «sympathy" and
"compassion", more than "pity", "grief" and "regret". Different episodes and shots of social advertising have the different affective potential, taking into account specific features of students, as it’s seen on the eye-tracking data: time of the first fixation, diameter of the pupil, fixation duration, number of fixations on the interest zones (faces of people, used images and symbols, verbal information - slogans and texts).
Fixing of the respondents on significant stimulus led to emergence of so-called dead/white zones (phenomena of change blindness) round them, so information which is in these zones is not perceived by students.
Representation of high-level visual information in biological and artificial neural networks Malakhova E.Yu.
Pavlov Institute of Physiology Russian Academy of Sciences, St. Petersburg, Russia
Convolutional neural networks (CNNs) share some properties with early stages of processing made by the human visual system in the way of processing natural images. Visualization of CNN kernels showed that they are tuned to detect space-frequency characteristics as well as color opponency, which is well-studied properties of neurons in the primary visual cortex. Visual signal passed through the initial stage of decomposition with mentioned kernels allows to build a semantically-separable representation of objects at the highest levels and make a decision about seen object. Here I investigate the way semantic categories such as faces, age and emotions can be represented in artificial neural networks and what kind of operations can be performed with inner representation. I hypothesize that functional correlates of invariant representations from artificial networks can be found in the higher levels of ventral visual pathway, such as inferotemporal cortex. Also, I compare approaches used for studying functions of higher levels of visual pathway, such as one-neuron recording and tuning curves, to available methods of visualization in artificial neural networks with a purpose to find advantages emerging from using the latest as a model of the human visual system.
Regularities of animate and inanimate objects in artificial Neural Networks Malashin R.O.
Pavlov Institute of Physiology Russian Academy of Sciences, St. Petersburg, Russia
Deep neural networks produce state of the art results in object recognition and detection of thousand image classes. As usual researches do not use relation between classes (hierarhy) during training, but
"underlining factors" have to be taken into acount by neural networks to achieve efficient recognition of variety of classes. We did experiments on singular value decomposition of CNN confusion matrix to perform object clustering by means of error analysis. The more powerfull method of representing a confusion matrix as a graph and finding its cut was also considered. For a small CNN trained on CIFAR-
10 the two methods have shown similar results, which justify more efficient SVD-approach. Experiments with Alexnet have shown that animate and inanimate objects of ImageNet dataset represent two major clusters with strongest inner relations. The obtained results can be considered to be the prove of presence of subject invariant reguarities inside groups of artificial and natural visual patterns.
Visual statistics in spatially organized sets Marshev V., Chetverikov A., Kuvaldina M.
Saint-Petersburg State University, St. Petersburg, Russia
Imagine beads on a table. Observers can effortlessly estimate summary statistics of such ensembles (Ariely, 2001). However, these beads look like isolated objects. whereas beads in a necklace look as a string. Would their summary statistics improve? We studied effect of spatial organization of perceptual ensembles on summary statistics using an implicit and an explicit procedures. We hypothesized that well- organized ensembles would be pre-attentionally grouped thus changing precision of estimated statistics.
For the explicit task, observers made 4-AFC judgements about mean (Marchant et al, 2013) orientation of tilted lines sets positioned either randomly or in circle. Bayesian ANOVA showed no effect of organisation on explicit averaging. In the implicit task observers searched for an oddly tilted line among distractors. Lines’ centres were either aligned or jittered. A priming “streak” of several trials with distractors oriented with one distribution was followed by test trials with different distribution.
Distractors’ distribution representation was estimated using test trials’ RTs. RTs were analyzed as a function of orientation difference between test trials targets and priming streaks distractors’ means (Chetverikov, Campana, Kristjansson, 2016).
Results showed that explicit averaging is insensitive to spatial organization. In contrast, the implicit procedure showed less accurate distribution estimate with well-organized stimuli.
Fractal analysis in post-processing of tomographic images Marusina M.Ya.
ITMO University, St. Petersburg, Russia
Cancer is one of the most common causes of human mortality. Early diagnosis allows several times to reduce the death rate from cancer. Screening is used for mass early diagnosis of cancer. Fractal analysis of medical images can be useful in this field of application. In the study, we used magnetic resonance (MR) images of healthy tissues and tissues containing metastatic cancer. The fractal dimension of the image and the Hurst index were selected as diagnostic features for tomographic imaging. ImageJ software package for image processing and special application FracLac for fractal analysis. MR images were processed in the ImageJ software. The area size of 120x150 pixels was selected and then processed in the FracLac application. The fractal dimension of pathological and healthy tissue samples was calculated. To determine the fractal dimension, the method of cell counting was chosen. Results: In the case of pathology (foci formation), the Hurst index is less than 0.5 (the region of unstable statistical characteristics), and for healthy tissue the Hearst index is more than 0.5 (zone of stable characteristics).
Conclusions: The study examined the possibility of creating a fractal rapid analysis to identify focal lesions of tissues and recommendations for its use. The Hurst index can be used as an important diagnostic characteristic for the analysis of medical images.
Neurophysiological correlates of efficient learning in the neurofeedback paradigm Minkov V., Smetanin N., Markina N., Dybushkin I., Ossadtchi A.
Higher School of Economics, Moscow, Russia
There is a number of studies made on activation evoked by the operant conditioning [1]. A group of brain structures responsible for the process are widely recognized to belong to the rewarding system [2] and the entire process of neurofeedback training is considered to be adequately described as a reinforcement learning process [3]. In this paradigm, the feedback signal presented to the subject is interpreted as a secondary reinforcer by the neural system. Depending on the ergonomic parameters of the feedback signal (latency, color, shape, pitch, timbre, etc) the efficiency of learning and the intensity of plastic changes will vary. Can we identify the correlates of efficient learning in the ongoing EEG recording?
Can we use these correlates to tune the parameters of the feedback signal to achieve optimal performance?
Here, we used occipital alpha neurofeedback upregulation to explore the posed questions. We exposed our subjects to the real and mock feedback and contrasted the multichannel EEG recorded during these two conditions using adaptive spatial filtering techniques in order to find the neuronal sources whose activity explains the difference between the two states. We found statistically significant differences in activity of brain structures previously implicated in the operant conditioning process.
[1] Raver, S. M., & Lin, S. (2015). Basal forebrain motivational salience signal enhances cortical processing and decision speed. Frontiers in Behavioral Neuroscience, 9. doi:10.3389/fnbeh.2015.00277 [2] Schultz, W. (2015). Neuronal Reward and Decision Signals: From Theories to Data. Physiological Reviews, 95(3), 853-951. doi:10.1152/physrev.00023.2014
[3] Kamiya, J. (2011). The First Communications About Operant Conditioning of the EEG. Journal of Neurotherapy, 15(1), 65-73. doi:10.1080/10874208.2011.545764
Influence of the foveola size on the characteristics of the evoked potentials in image recognition tasks
Moiseenko1 G.A., Vakhrameeva1 O.A., Maltsev2 D.S., Koskin2 S.A., Shelepin1 Yu.E.
1Pavlov Institute of Physiology Russian Academy of Sciences, St. Petersburg, Russia 2Military Medical Academy, St. Petersburg, Russia
The aim is to study the visual evoked potentials characteristics (VEP) in the objects recognition task depending on the foveola size.
The study involved 27 healthy subjects aged 22 to 35 years with visual acuity of 0.5 to 2 (15 emmetrops and 12 - with myopia from 0.25 to 5.5 D). Using VEP two studies series were carried out at the resolution limit of the visual system. The VEP registration was carried out according to the scheme 10-20 with reference ear electrodes. In both series the images were displayed monocularly. The 1st type of stimulus - reversible chess pattern. The chess cell size on the monitor screen was 13.8 ang. min. Further, the relationship between the amplitudes and latent periods of the P100 component in the occipital regions with the foveal diameters was analyzed. The second stimulus type - an image of animate and inanimate nature. The images size - 24 ang. min. The relationship between the components characteristics of N170 and P200 in the occipital, in the temporal, and in the frontal regions with the foveal diameters was analyzed.
The dependence of the characteristics of the VEP, early and first cognitive components on the foveola size, was first revealed.