The experimental investigation of the electric discharge over the flat plate in a hypersonic air flow at the magnetic field. Formation of the shock wave on a wedge in the hypersonic air flow at the local.
Spatial Symmetry of Converging Shock Waves in Hard-Sphere Model: Carnahan-
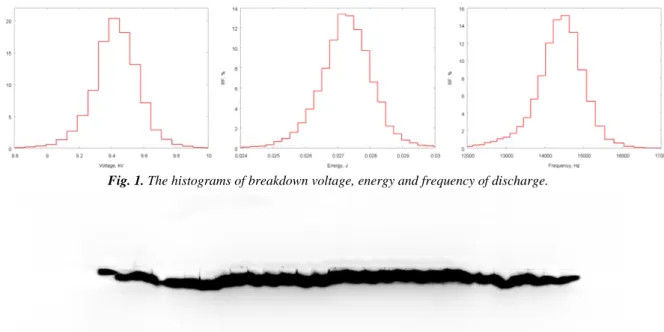
Observation of the structure of charged macroscopic particles on the metal surface
On the Three Interpretations for the Theoretical Existence of the Shock Wave
The Reality For The Laboratory Imitation Of The Stellar Elements Synthesis By The Very
The Non-Paradoxical “Forbidden” Arising of the Subshock Isothermal in the One-Dimensional (Сp/Сv ≡ 3) Plasmas By Means of the Thermodynamic Input of the “Photon Steam”
Оn hot High Beta Plasma Flows Near Magnetized Bodies in Rarefied Plasmas
PHYSICS OF SURFACE DIELECTRIC BARRIER DISCHARGE V. Soloviev
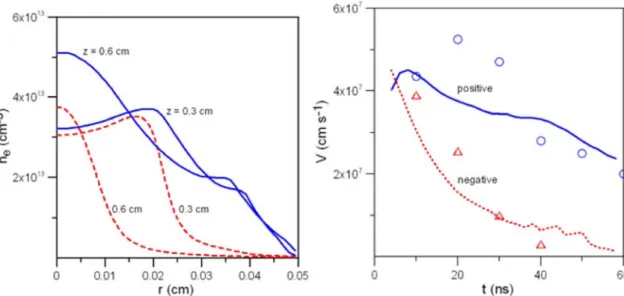
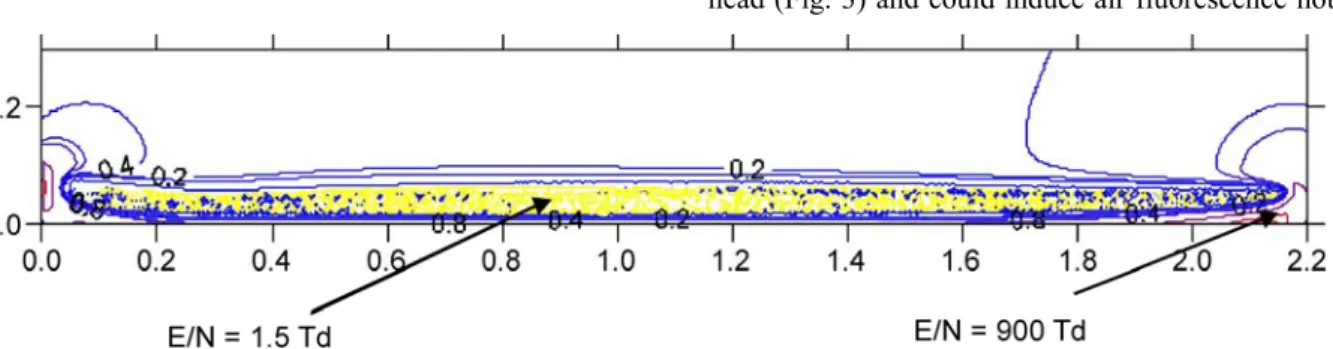
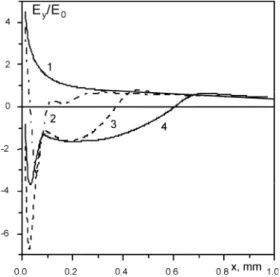
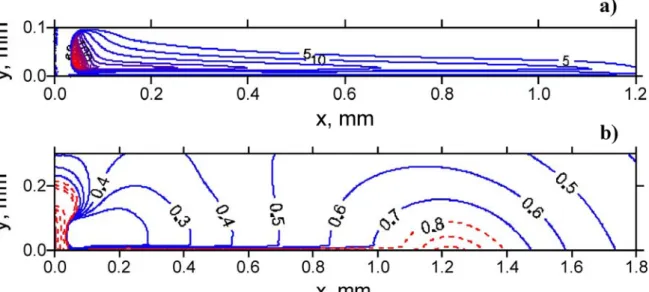
According to numerical simulation [10], the parameters of the streamer head do not vary appreciably after the formation of the streamer - the electron density contours for the streamer nose practically coincide at different times, as shown in Figures 5 and 6 show temporal evolutions of the normal component of the electric field Ey on the dielectric surface and the surface charge density at a constant voltage V = - 4.5 kV.
![Fig. 2. Streamer evolution predicted by numerical model [10]; electron density n e /n 0 contours for V = 4.2 kV, d = 1 mm, ε = 8; n 0 = 0.82×10 12 cm -3](https://thumb-eu.123doks.com/thumbv2/pdfplayernet/426729.46318/13.892.473.802.317.611/streamer-evolution-predicted-numerical-model-electron-density-contours.webp)
Time resolved measurements of the body force The momentum source due to charged particles
The second result means that the body force is the result of a positive ion surplus for a positive voltage half cycle and of a negative ion surplus for a negative one. The controversial experimental data mean that additional efforts are needed to clarify body force production.
Simplified analytical model of the body force The aforementioned experimental findings for
In this case, the body force, averaged over the micro-discharge cycle, must be constant and coexist with the series of micro-discharges. The body force is approximately the same for negative and positive tension, half cycle, forward and reverse stroke respectively.
Discussion
In the simplified analytical approximation of the electric field near the edge of the electrode used in Ref.[15] to estimate the breakdown voltage Vbd this electric field did not depend on ε. This can reduce the scanning action of the surface charge layer and allow the bulk charge to be increased to obtain a larger strength value.
Summary
BLUFF BODY AERODYNAMIC WAKE STRUCTURE CONTROL BY A HIGH FREQUENCY DIELECTRIC BARRIER
DISCHARGE
Experimental setup
The generator operated in the pulse-periodic regime, creating RF pulses of 30-100 us duration and repetition rate up to 10 kHz. Ammonia fume was injected into the rear point of the cylinder, tangential to the surface of the model.
Results and discussion A. Circular cylinder
The wave structure was studied by an array of 14 0.7 mm Pitot tubes, positioned 0.5–5 diameters downstream from the model, in the middle of its span. One can see the creation of large-scale eddies at a close moment, locked into the discharge pulse.
Leading edge separation on a wing model
- Conclusions
- PLASMA DESTRUCTION OF TOLUENE IMPURITIES IN N 2 : O 2
- THE KINETIC PROCESSES INITIATED BY THE PULSE NANOSECOND DISCHARGE IN HOT AIR
Dependence of the toluene concentration at the exit of the plasma reactor versus the specific energy for different oxygen contents in the gas mixture. This situation indicates that the developed plasma chemical model adequately describes the process of toluene conversion in the N2:O2 gas mixture.
![Fig. 1 shows a comparison of numerical results with experimental data [1] on the degree of toluene removal depending on the energy density in the N 2 : O 2 gas mixture at the three initial oxygen concentration [O 2 ] = 0% (pure nitrogen), 1.5% and 10](https://thumb-eu.123doks.com/thumbv2/pdfplayernet/426729.46318/30.892.105.417.714.939/comparison-numerical-results-experimental-toluene-depending-concentration-nitrogen.webp)
A. Popov
- The Effect of Hydrogen and Oxygen Atoms on the Ignition of H 2 : O 2 Mixtures
Apparently, we must first analyze the effect of various chemically active particles on the characteristics of the inflammatory process. The calculation results show that initial concentrations of hydrogen atoms [H]0/M = [NH3]/M ≥ 2% are required for the ignition of the mixture in question.
O → HNO + H;
- The Effect of O 2 (A 1 Δ G ) on the Ignition Delay Time and the Flame Propagation Velocity in
- KINETIC SIMULATION OF RADIO FREQUENCY DISCHARGE INFLUENCE ON THE PLASMA LAYER NEAR SURFACE IN
Here we analyze the effect of the data obtained on the reaction rates involving singlet oxygen (3-5) on the ignition of hydrogen-oxygen mixtures. The contribution of the chain branching reaction (3) is also small at the given temperatures [47].

SUPERSONIC GAS FLOW
Schweigert
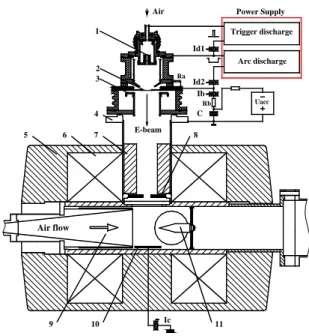
- ELECTRON BEAM AND GAS DISCHARGE IONIZATION OF A HYPERSONIC FLOW IN A MAGNETIC FIELD
ELECTRON BEAM AND GAS DISCHARGE IONIZATION OF A HYPERSONIC FLOW IN A MAGNETIC FIELD A HYPERSONIC FLOW IN A MAGNETIC FIELD. An electric discharge for the ionization of a hypersonic current can also be realized along a magnetic field.
- LONG SPARK DISCHARGE INITIATION IN SUPERSONIC AIRFLOW
- SIMULATION OF DYNAMICS AND STRUCTURE OF PLASMA MICROJETS
Moreover, electron beam ionization requires small losses of the beam that propagate magnetic field lines longitudinally. In the first case, the position of the plasma cathode outside the strong magnetic field simplifies the problem of electron beam formation (homogeneous gas discharge plasma emitting the electron beam is quite easily available; the acceleration gap of the electron source is removed as far as possible from the region of the hypersonic flow of increased pressure).
V. Naidis
- Introduction
- The model
- Results
- MICROWAVE ENERGY ABSORPTION BY PLASMA STRUCTURES
- Experiment
- The electrodynamic model of a microwave streamer
- Calculation results
- Results
- DIELECTRIC BARRIER DISCHARGE FOR MIXING ENHANCEMENT IN THE WAKE OF A CIRCULAR CYLINDER
- Numerical simulation
Radial distributions of the electron number density at different axial positions for positive (solid) and negative (dashed) streamers. In the mid-1990s, several groups used dielectric barrier discharge (DBD) for flow control [6–8].
![Figure 1. Radial distributions of air molar fraction at various axial positions, for conditions of experiment [3]](https://thumb-eu.123doks.com/thumbv2/pdfplayernet/426729.46318/60.892.475.785.357.665/figure-radial-distributions-fraction-various-positions-conditions-experiment.webp)
2.37 10 Watt
Conclusions
- ENERGY CHARACTERISTICS AND RELAXATION OF A
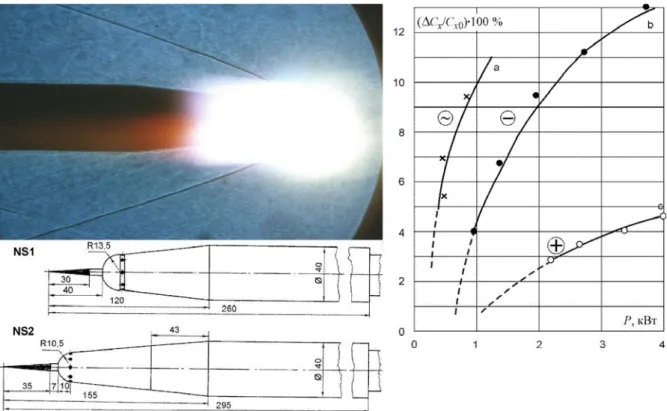
The speed of movement and the final position of the separation point in an area do not depend on the power of the source. Drag reduction by direct corona discharge along an electrically conductive flat plate for low Reynolds number flow // Phys. Separation Control Using Plasma Actuators - Stationary and Oscillating Airfoils // 42nd AIAA Aerospace Sciences Meeting and Exposition, Reno, Nevada, 2004, AIAA-2004-0841.
Control of current separation by plasma actuator with nanosecond periodic discharge // 46th AIAA Aerospace Sciences Meeting and Exhibit, Reno, Nevada, 2008, AIAA-2008-1367.
PLASMA SHEET”
- EXPERIMENTAL RESEARCHES OF FAST-FLYING BODIES INTERACTION WITH LASER-INDUCED SPARK PLASMA
- PLASMA DECAY IN AIR EXCITED BY HIGH-VOLTAGE NANOSECOND DISCHARGE
- L. Aleksandrov
- M. Anokhin
- V. Kindysheva
- Kirpichnikov
- N. Kosarev
- Nudnova
- M. Starikovskaia
- Yu. Starikovskii
- Experimental results
- Kinetic model
- Calculation results
- Conclusions
In the case of non-uniform plasma, such measurements provided electron density averaged over the diameter of the discharge tube. In this case, the equation for the evolution of the electron temperature in the discharge glow is expressed as We simulated the discharge afterglow taking into account the radial non-uniformity of the plasma.
Using a microwave interferometer, the time evolution of the electron density was measured in the afterglow of a nanosecond high-voltage discharge in air at 1-10 Torr.
WAKE
A. Levin
- THE IMPACT OF ELECTRIC DISCHARGE ON SELF- OSCILLATING SHOCK WAVES WHEN SUPERSONIC JET
The mechanism of formation of front separation zones in the presence of upper energy deposition. In [4], the appearance of a precursor structure during the high-temperature wake – bow shock interaction was observed. In fact, the scale of the precursor for the initial stage of interaction is determined by the thickness of the temperature trace.
The mechanism of the formation of front separation zones in the presence of upstream energy deposition was determined as a result of the interaction of the high-temperature wake with the shock layer.
IMPINGING ON THE FINITE OBSTACLE OF VARIOUS PERMEABILITY
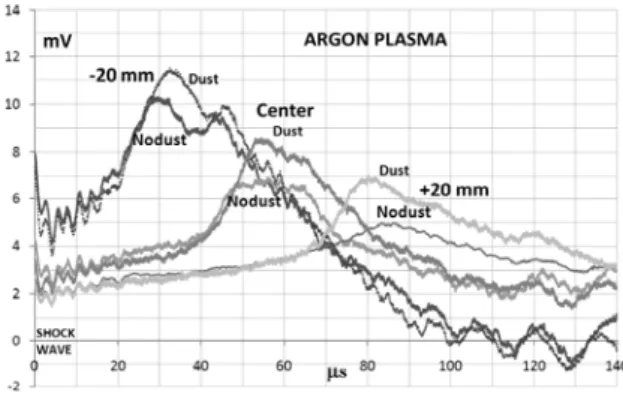
- INFLUENCE OF DUST CONCENTRATION ON SHOCK WAVE SPLITTING IN DISCHARGE PLASMA IN DIFFERENT GASES
- Installation
- Dustiness
- Conclusion
- THE BUFFET CONTROL BY LOCAL ENERGY AND MOMENTUM RELEASE IN THE VICINITY OF λ SHOCK
- A. Starodubtsev
- ION – ACOUSTIC SHOCK WAVE IN PLASMA
Weak influence of dust on the shape of the distribution of pressure behind the shock wave in the plasma of the glow discharge for the small concentration of dust (20mg in m3) for air (Air) and nitrogen (N2). Fig.4 The effect of dustiness of the atmosphere without discharge on the pressure distribution behind shock wave in the air at the point where the discharge center should be (-d-without the dust, + d- with dust 200 mg/m3). Propagation and the structure of shock wave front in the ion plasma with the presence of the negatively charged nano-particle (clusters, speckles).
Influence of the humidification of the atmosphere and its dustiness on the effect of the destruction of shock wave in the plasma of the glow discharge.
ABNORMAL STREAMING, DETONATION OF EXPLOSIVES)
ON FIREBALL GENERATION BY MICROWAVE RESONANCE IN PHOTONIC WIRE GRIDS
Microwave transmission tests by Pendry demonstrate the photonic response of thin wires stacked in cubic lattices [2]. Paschen's law initiates high-voltage breakdown in weak vortex cores, turning the wake flow into eddy plasma. Cavitation in cold, dense discharge plasma drives the photon response in equal sections for ionization and scattering.
Our helical vortex plasma has stratified space charge quaternion potentials for atmospheric fireballs in free space, in external fields, and in channel solutions.
GAS-DISCHARGE PROCESSES IN A STRATOSPHERE AND MESOSPHERE DURING A THUNDER-STORM
ON POSSIBLE NATURE OF BALL LIGHTNING AS OF AN OBJECT OF PLASMA ASSISTED COMBUSTION
Let's estimate the time of flow of charge from the surface of the created object to the ground. With the heating of the surface, accompanied by a decrease in the thickness of the BL cover, its radius increases, i.e., the main temperature increase occurs during the breakdown of the plasma into recombination.
From (15) one gets an estimate of the surface temperature without accounting for the combustion processes in the ball.
SOME FEATURES OF HIGH-VOLTAGE DISCHARGE WITHIN A STREAM OF THE WATER ANODE EROSION’S PRODUCTS
Gatchina’s discharge at different polarities Experiments were carried out using
In the case of the electrolytic cathode, more lines are energized, but they all decay rapidly as the current decreases. Low brightness discharge images taken at 20 ms intervals in the case of the electrolytic cathode (NaCl). Images of the discharge taken at an interval of 20 ms in the case of an electrolytic anode at the initial storage capacitor voltage of 5 kV (HNO3).
Discharge images taken at 20ms interval in the case of the electrolytic cathode at the initial voltage of the storage capacitor 5 kV (HNO3).
Discharge of a small current
When the magnitude of the current was of the order of ten milliamperes and more, further Fig. Dependence of the total voltage drop at the water and the discharge of the gap for two. The characteristic shape of the current pulses (Fig. 11 right) corresponds to the avalanche character of the semi-self-sustained discharge.
In addition to breakthroughs from the water surface, breakthroughs were also observed between different parts of the curved plasma column (Figure 12).
Conclusions
- NEW METHOD OF ELECTRIC POWER EXTRACTION FROM HIGH-SPEED PLASMA FLOW
- PROBABILITY LAW OF MW DISCHARGE IGNITION
- DISTRIBUTION OF H2O TEMPERATURE AND
It has been revealed that strong separation of electric charge is possible in plasma formation in fast air flow. Thus, charge separation by an external electric field in a high-velocity airflow can be effective even in a cluster plasmoid. The phenomenon of charge separation during plasma formation in a fast air flow with an external electric field is studied in detail in [4-6,10].
It is revealed that a strong electrical charge separation is possible in plasma formation in high-speed air flow.
CONCENTRATION IN ZONE OF PLASMA-ASSISTED HIGH-SPEED COMBUSTION
NONEQUILIBRUM PLASMA ACCOMPANYING THE IGNITION OF METHANE-OXYGEN MIXTURES
A.Filimonova 2 , M.R.Shakarov 3
- PROGRAMMABLE MICROWAVE DISCHARGE AS THE WAY OF COMBUSTION STABILIZATION OF LIQUID ALCOHOL, INJECTED
PROGRAMMABLE MICROWAVE EMISSION AS COMBUSTION STABILIZATION OF LIQUID ALCOHOL, STABILIZATION OF INJECTED LIQUID ALCOHOL, INJECTED COMBUSTION.
INTO TRANSONIC AIR STREAM
CLOSED VOLUMES
ADVANCED TURBULENT COMBUSTION MODELING
APPLICATION TO SUPERSONIC COMBUSTION
- A conceptual representation of turbulent combustion
- LES combustion modeling using a multi-phase analogy
- Subgrid flow modelling
- A multi-phase framework for subgrid combustion modelling
- Subgrid combustion modelling
- Modeling the subgrid time scale and the equilibrium reacting volume fraction
- Numerical method
- Results from LES of a premixed dump combustor
- The ONERA/JAXA Scramjet Combustion Experiment
- Combustion Chemistry
- Summary and concluding remarks
- TIME MEASUREMENT OF INDUCTION REACTION H 2 + O 2 IN THE DETONATION WAVE FORMATION IN A STOICHIOMETRIC
To derive the proposed model, let Ψ=[Yi,hs] be the composition space that. This represents the geometric mean of the Kolmogorov time (short) and time scale (long) associated with the subgrid speed range. Based on the results of previous studies, [63], comparing the influence of different reaction rate mechanisms, this investigation uses the 7-step mechanism of Davidenko et al, [64], with the rate parameters according to Table 4. From [ 61 ] it is clear that the 7-step scheme predicts autoignition and flame stabilization more accurately than the 1- and 2-step mechanisms also used in [ 63 ].
In the divergent combustor, the reflections of the pressure waves on both the walls of the combustion chamber and on the flame (represented by T) can be noted.
![Figure 1. Schematic of laboratory dump combustor of Gould, [53-54].](https://thumb-eu.123doks.com/thumbv2/pdfplayernet/426729.46318/158.892.136.596.137.216/figure-schematic-laboratory-dump-combustor-gould-53-54.webp)
MIXTURE AT THE PRESSURE WITHIN THE RANGE OF 1.1-2.3 ATM
ELECTRICAL DISCHARGE EFFECT ON A MULTISTAGE IGNITION AND COMBUSTION IN A CHEMICAL COMPRESSION
REACTOR
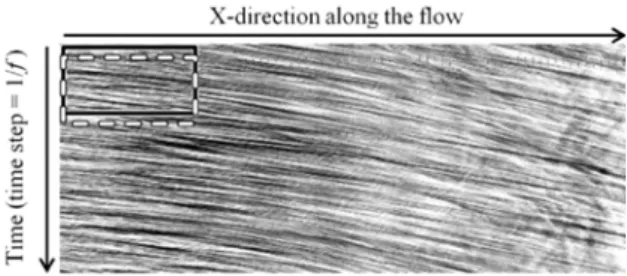
- FLOW STRUCTURE ANALYSIS BY CROSS-CORRELATION IMAGE PROCESSING
- SIMULATION OF HEAT TRANSFER TO THE SPASE VEHICLE EXPERT USING INDUCTIVELY HEATED PLASMATRON
- STRUCTURES OF THE SINGLE ELECTRODE RF GAS DISCHARGE IN SWIRLING AIR FLOW
- OSCILLATION FREQUENCIES OF UNSTEADY VORTEX RINGS
Field of view of line scan camera was located in 5 mm above and parallel to the airfoil. STRUCTURES OF THE SINGLE ELECTRODE RF GAS DISCHARGE IN OPERATING AIR FLOW DISCHARGE IN OPERATING AIR FLOW. Numerical simulation of the eddy flow structure with the heat source simulating the actual Joule heating in discharge in the cylindrical quartz channel with the open end is performed.
Thus, a convection heating of the paraxial region in the region of the reverse flow leads to the corona-burner discharge transitions.
Shugaev, Oksana A. Solenaya
STUDY OF A LONGITUDINAL PLASMOID CREATED BY CAPACITY COUPLED HF DISCHARGE IN SWIRL AIRFLOW
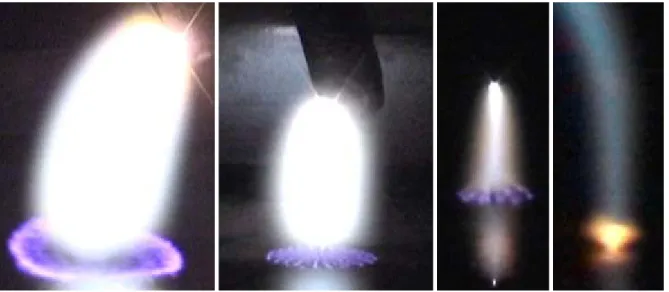
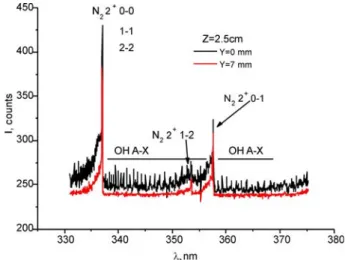
The processing of these spectra gives us important information about the non-equilibrium parameters of the LP plasma in the eddy current. It is found that the pressure in the eddy current increases by about 20-30% when the plasma is switched on. In this work, the physical properties of LP generated by CHFD in a high-speed vortex flow are studied in detail.
LP's physical properties and its parameters in eddy flow at different gas flow parameters and electric HF discharge parameters.
Main experimental results
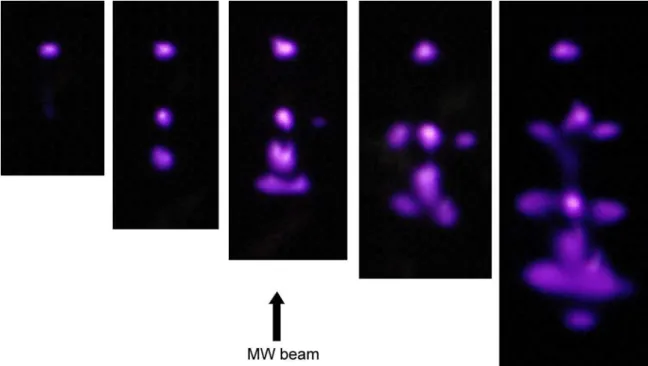
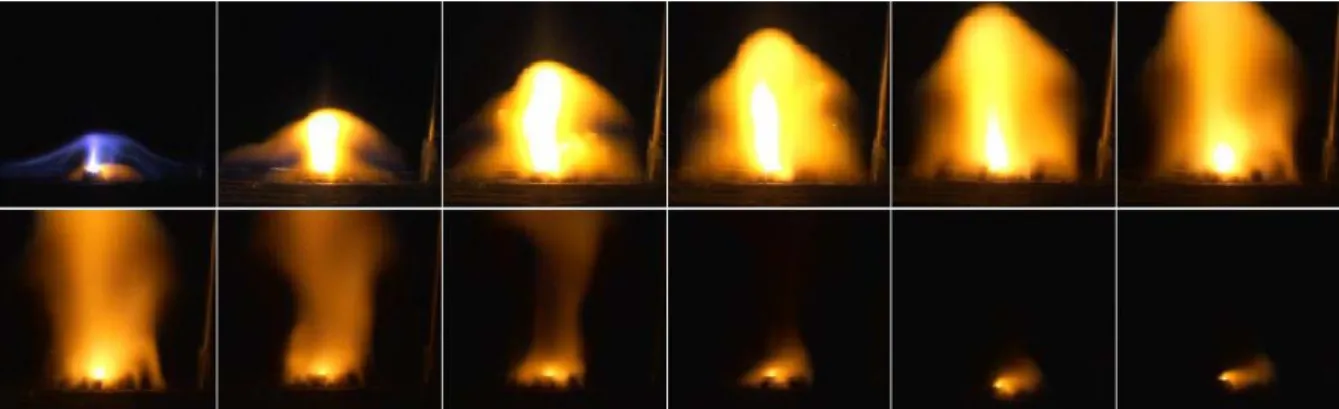
UV spectra (λ=250-300nm) of an LP generated by CHFD in swirling flow were recorded and analyzed in this work. LP Generated by Repeated Pulsation CHFD A free spin LP generated by CHFD is studied in this work. Typical frames of LP in the swirling flow behind the wedge are shown in fig.16.
The experimental setup WT-M for study of an LP created by HF discharge in vortex flow.
![Fig. 10b Theoretical estimations of average force per unit electrode lenght (lines) against experimental data [2]](https://thumb-eu.123doks.com/thumbv2/pdfplayernet/426729.46318/18.892.452.771.103.424/theoretical-estimations-average-force-electrode-lenght-lines-experimental.webp)
![Figure 5. Radial distributions of air molar fraction at various axial positions, for conditions of experiment [5]](https://thumb-eu.123doks.com/thumbv2/pdfplayernet/426729.46318/61.892.474.784.637.940/figure-radial-distributions-fraction-various-positions-conditions-experiment.webp)