The mentioned problems can be solved with a deeper understanding of the processes in the Russian M&A market. 7 The subject of the master's thesis is the success of M&A on the Russian stock market in the short-term and long-term perspective.
MERGERS AND ACQUISIONS ON THE RUSSIAN STOCK MARKET
The concept of mergers and acquisitions
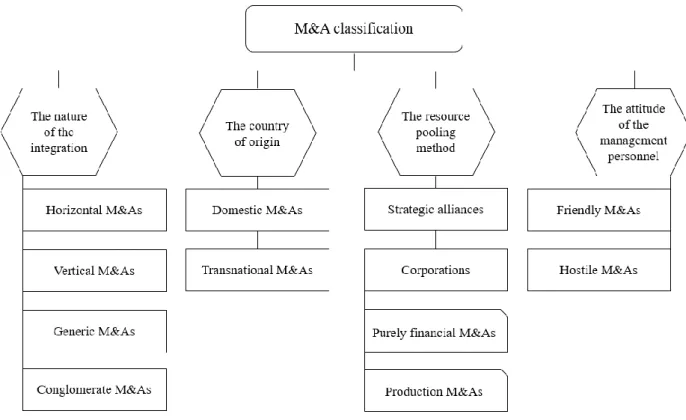
Types of mergers and acquisitions
Vertical M&A is a combination of companies from different industries connected by the technological process of manufacturing the final product, i.e. Transnational M&A is the merger of companies located in different countries (transnational mergers) or the acquisition of companies in other countries (cross-border acquisitions). .
M&A motives
Synergy occurs where the market value of the two combined companies is higher than the sum of their individual values.12. Other sources of synergy come from oligopoly power and better diversification of firms' risks.
The Russian market M&A overview
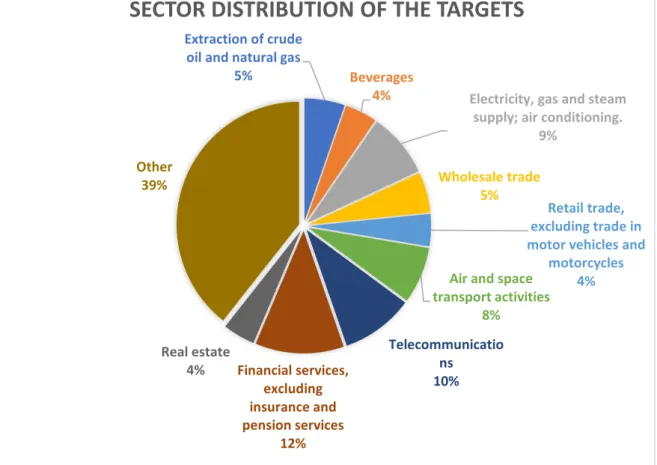
17 competition from other buyers on the market.22 Furthermore, there may be fiscal incentives and expected synergies. The energy sector dominates the Russian M&A market in terms of the value of transactions and ranks second in terms of number.
M&A Performance valuation
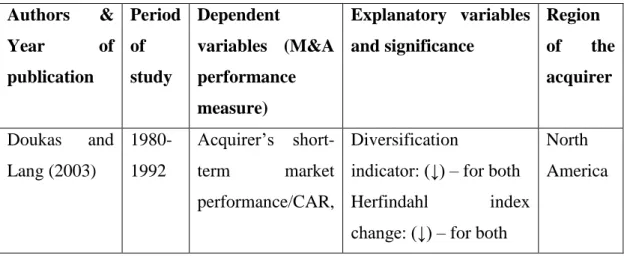
The main focus in M&A performance studies is acquirer performance, as M&A is seen as a key strategic choice of acquirers. The Methodology section provides a more detailed description and rationale of the selected M&A performance indicator. It is worth noting that many papers explore the influence of acquirer to target affiliation on M&A performance and most of them confirm a positive relationship between these two variables (Doukas and Lang, 2003; Lien and Klein, 2006; Finkelstein and Haleblian, 2002).
Thus, this article assumes that the relationship between the price-to-book ratio and post-merger performance will be negative. However, some researchers argue that the relationship between M&A experience and M&A performance is U-shaped (Haleblian and Finkelstein, 1999). Kumar and Panneerselvam (2009) examined the relationship between M&A performance and acquirer liquidity and concluded that this relationship was negative.
36 Including this variable in the model allows evaluating the relationship between economic conditions in Russia and M&A performance. Thus, there may be a negative relationship between market conditions and post-merger performance (Jing et al., 2013).
Hypothesis formulation
Thus, the rise and fall of the economy is closely linked to the operation of the oil and gas sector. According to Miller and Shamsie (1996), property-based M&A is when a firm has an asset whose ownership rights are defensible by law. Property-based resources are associated with tangible assets that enable access to new markets, facilitate competitive deterrence, or increase the firm's size or scale.
Efficiency acquisition motives are also classified as knowledge-based resources because they are more process than asset related. Some M&A involve the acquisition of both property and knowledge resources, acquisitions will be classified as knowledge-based if at least 50% of the motives identified in the press releases can be considered knowledge-driven (York & McDaniel, 2003). The bullish market is identified by positive cumulative return over the last 14 days prior to the announcement, the bearish market shows negative cumulative return.
Relative deal size: The ratio of the deal value to the acquirer's market capitalization on the day before the announcement. Acquirer experience: a dummy variable where 1 – the firm had M&A experience in the last 3 years prior to the deal, 0 – if not.

EMPIRICAL STUDY ON FACTORS OF M&A PERFORMANCE ON THE
Methodology
To determine the impact of the event on the company's value, the return on the stock of the analyzed company is compared with the return on some benchmarks. Since the inaccuracy of the normal return in a period given by a benchmark is multiplied and affects the final result due to the use of compound interest much more strongly than in the CAR method [Fama, 1998]. The null hypothesis is that the means of CAR and BHAR are equal to zero, that is, the event does not affect the value of the firm.
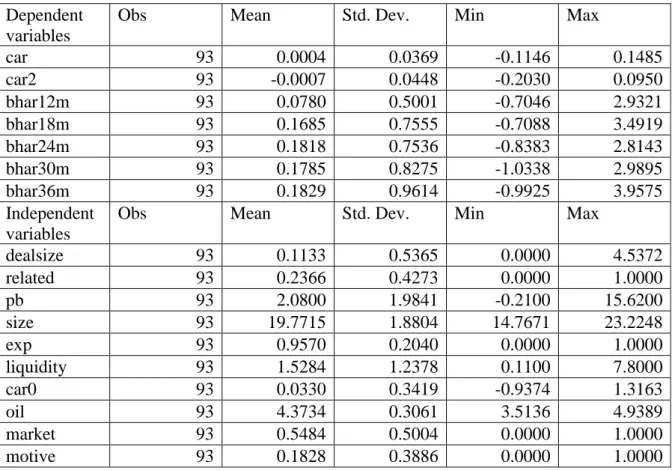
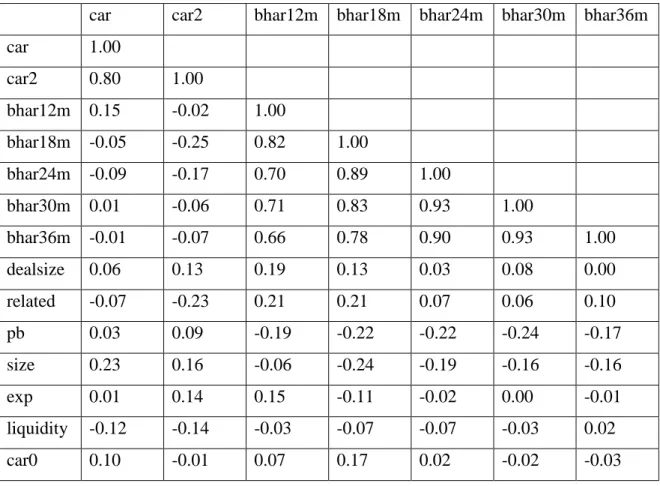
After calculating abnormal returns, multifactor regressions are constructed, where abnormal returns will be the dependent variable, and the studied M&A performance factors will be the independent variables. 𝑃𝐵𝑡 is the average ratio between the price and book value of the acquirer before the announcement of deal t, 𝑆𝐼𝑍𝐸𝑡 is the size of the acquirer's deal t,. 𝐿𝐼𝑄𝑈𝐼𝐷𝐼𝑇𝑌𝑡 is the acquirer's current deal liquidity t, 𝐶𝐴𝑅0𝑡 is the acquirer's deal t performance before M&A.
𝑂𝐼𝐿𝑡 is the logarithm of the current oil prices before the announcement of the agreement t, 𝑀𝐴𝑅𝐾𝐸𝑇𝑡 is the market conditions before the announcement of the agreement t, 𝑀𝑐𝐡t .
Period of analysis
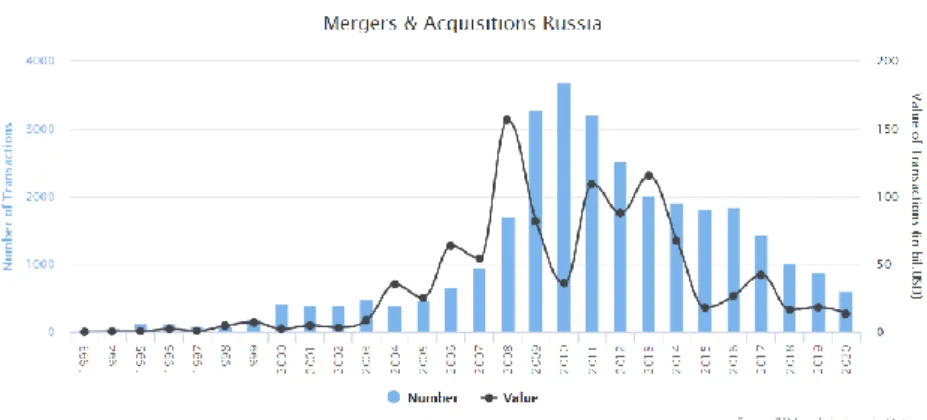
34 The first phase (post-privatization) lasted from the mid-1990s until the 1998 crisis, and this period was characterized by only a few attempts at classic mergers and acquisitions. This method was important as an independent mechanism and as part of the expansion of the first financial and industrial groups. Due to the specificity of the methods used at this stage, some analysts prefer to use the term "property redistribution".
A distinctive feature of this phase is the slowing down of the expansion of already established groups, as well as the completion of consolidation processes. The company showed that the methodology for developing a strategic approach to mergers and acquisitions in the early stages was almost not used by Russian companies. Most of the agreements were notable for the lack of a strict need to form a conscious strategic approach to the selection of an acquisition target, as well as its integration.
Therefore, the acquirers have not assumed significant risks that would correspond to the actual value of the assets; Forecasts that the global crisis will not affect the Russian economy and, accordingly, the Russian market of mergers and acquisitions have not come true.
Sample description
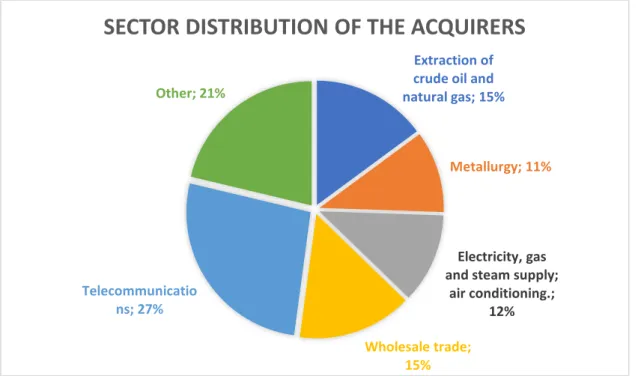
Thus, an analysis of M&A performance is planned after 2005, when transactions on the capital markets became more civilized. The dominant industries are financial services, telecommunications, electricity, gas and steam supply, and air and space transport activities.
Event study results
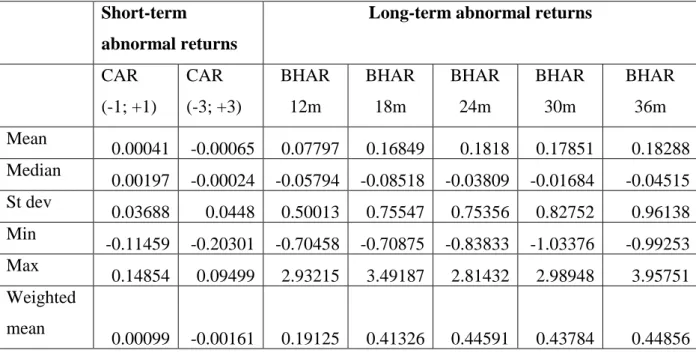
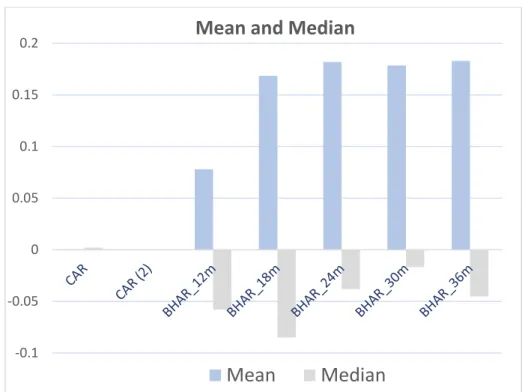
Then, the hypotheses about the equality of the mathematical expectations of abnormal returns to zero were tested. According to the results obtained (see Table 4), at a significance level of 10%, the main hypothesis is rejected for BHAR 18m, BHAR 24m, BHAR 30m, BHAR 36m, therefore the mathematical expectations for these BHARs are not zero.
Descriptive statistics of the variables
For the analysis of M&A performance with different motives, the sample is divided into two subsamples based on two main motives: knowledge-based and real estate-based. On average, CAR is negative for knowledge-based M&A and positive for real estate-based M&A. So the market punishes companies that conduct knowledge-based M&A transactions in the short term, but in the long term, companies that conduct knowledge-based M&A transactions perform better.
In the sample, knowledge-based M&As are conducted by companies that already had an M&A experience during the last 3 years prior to the deal. Pre-M&A performance for knowledge-based M&As is moderately negative, while for property-based ones it is positive. The chart below shows the difference in knowledge-based and property-based M&A tools.
Furthermore, the percentage of knowledge-based M&As is the highest in the recent period. Thus, industries with a higher percentage of knowledge-based M&A perform worse in the short term, which is in line with the previous results.
Regression analysis
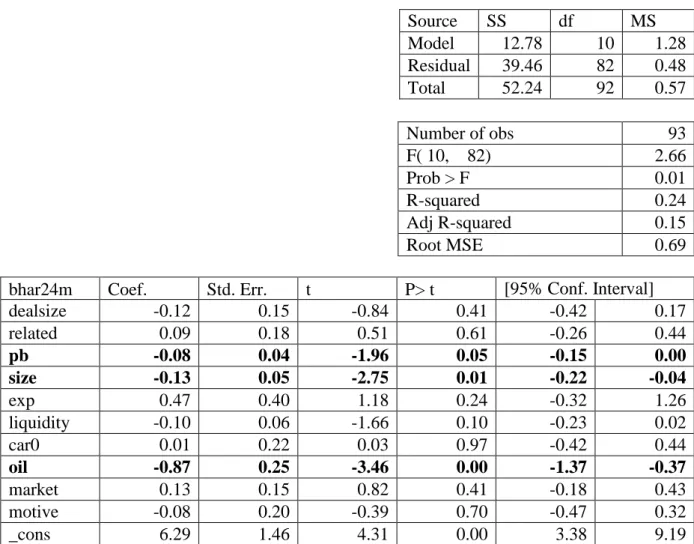
The results are robust across models, as the signs of significant variables remain unchanged. RELATED: Mergers and acquisitions of firms operating in related industries have higher abnormal returns by 0.33 p.p. PB: On average, ceteris paribus, when the price-to-book ratio rises by 1, abnormal returns fall by 0.08 p.p.
This result is consistent with some previous studies, moreover, the expected relationship was proven. The first hypothesis is accepted: according to regression analysis, M&A performance is higher for the companies from related industries. The second hypothesis is rejected, as the variable motive is insignificant, so in the long run there is no difference whether the firm had property-based or knowledge-based motives.
The third hypothesis is accepted: the price-to-book ratio is negatively related to M&A performance. The last hypothesis is rejected, as the variable market is insignificant, so there is no difference in the long run under which market sentiment the M&A was carried out.
Discussion
The inverse relationship may mean that the impact of mergers and acquisitions on a large company may not be as pronounced compared to smaller companies. Furthermore, it may mean that a large company can have excessive amounts of cash and invest in mergers and acquisitions with zero and negative NPV, as according to the Free Cash Flow theory, management is very reluctant to distribute cash among the shareholders. There is still a possibility to measure the relationship using some other criteria (for example the four-digit OKVED code).
Furthermore, the insignificance of variable motifs may lead to a different approach to motif classification.
Managerial implications
There are different classifications of mergers and acquisitions based on different criteria: the nature of the integration, the country of origin of the participants, the method of pooling resources, the attitude of the management personnel, etc. The event study was conducted on the sample of the Russian companies over the period 2005-2017. The results of the event study are as follows: the long-term abnormal returns for 18 months, 24 months and 24 months are significant at the 5% level.
After a careful analysis of existing literature, the following M&A outcome factors have been selected for research: acquirer-to-target relationship, M&A motives, price-to-book ratio of the acquirer, oil prices, and market conditions. The research results show that companies that do mergers and acquisitions in related industries perform better on average and therefore, depending on the context, such deals are preferable. Finally, a negative relationship between firm size and M&A performance may mean that larger firms are more careless about M&A and therefore need a more thorough analysis of motives and reasons for this type of deals.
The specificity of the Russian market is that there is no difference in the performance of knowledge and property M&A, while in developed markets knowledge M&A is weak. Deals: Their relevance to the stock market and the theory of the firm (Vol. 19).