Intellectual property rights are a dimension of the competitive economy, the objective of which is the benefit of the consumer. This Index was developed to serve as a barometer of the state of property rights in all countries of the world. The other two components of the index: physical and intellectual property rights (PPR and IPR), reflect two crucial forms of property rights for countries.
In addition, it contains expert opinions on the accuracy of the legal definition of property rights. The data source chosen for this item was the World Economic Forum's Global Competitiveness Index (http://bit.ly/2lHs5Mn). The data chosen for this item was the World Economic Forum's Global Competitiveness Index (http://bit.ly/2lHs5Mn).
The selected data source was the Global Competitiveness Index of the World Economic Forum http://bit.ly/2lHs5Mn). The overall IPRI rating scale ranges from [0 to 10], where 10 is the highest and 0 the lowest (or most negative) for a country's property rights system.

INTERNATIONAL PROPERTY RIGHTS INDEX 2018
2018 IPRI. COUNTRY RESULTS
- IPRI 2018 GROUPS RESULTS
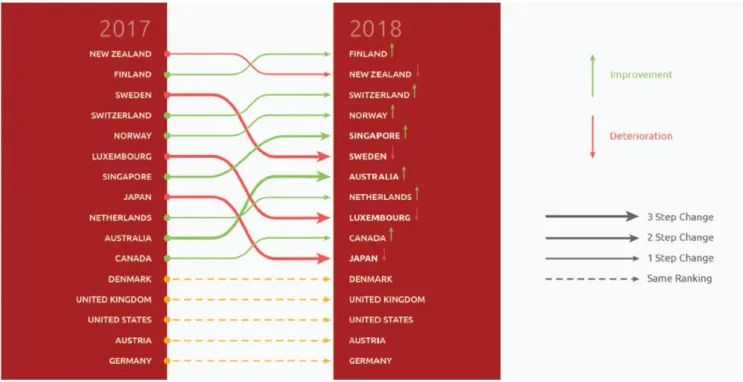
In general, the number of countries belonging to each quintile increases from the top 20% to the bottom 20% (1st quintile 17 countries, 2nd quintile 21 countries, 3rd quintile 24 countries, 4th quintile 28 countries and 5th quintile 35 countries). It is worth noting that the 2018 and 2017 IPRI top countries are the same with a different lineup (see Figure 5). Most of the top countries, except Singapore, show the LP or IPR component as the strongest for IPRI.
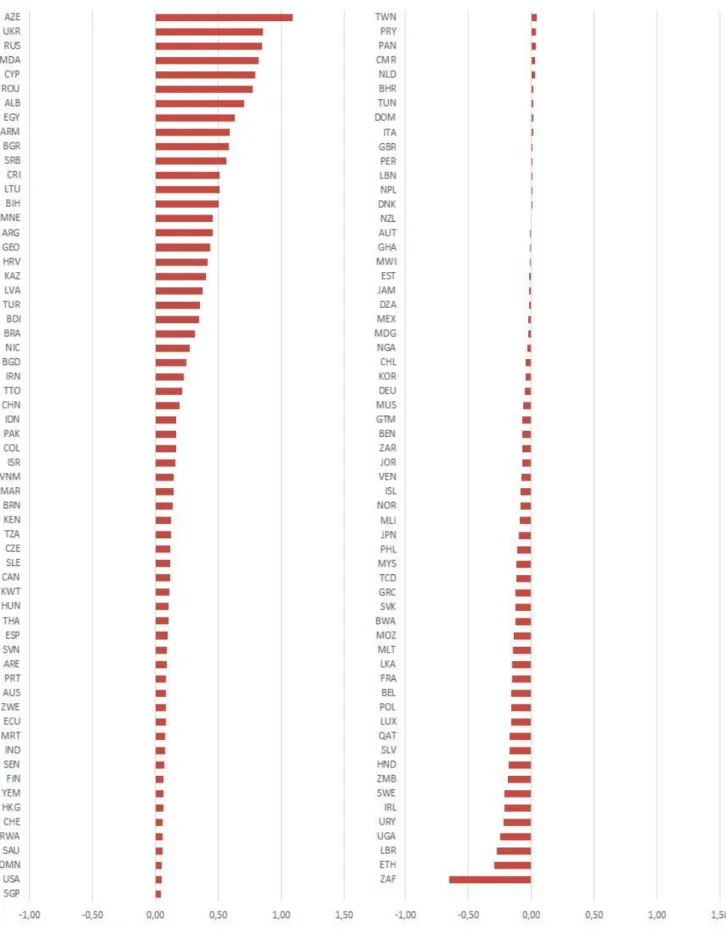
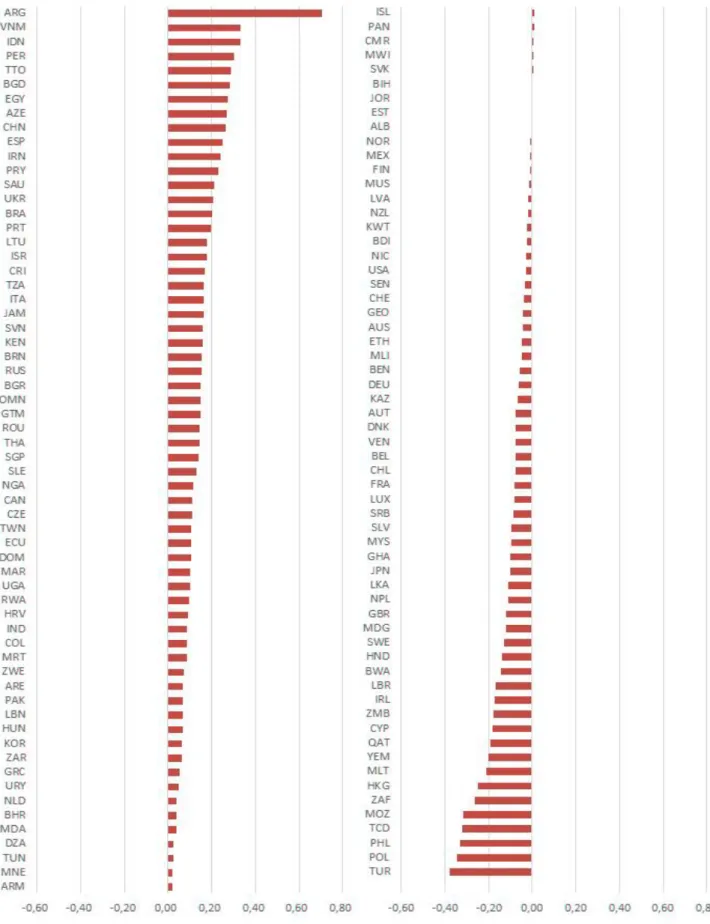
Most of the bottom countries show the PPR as the stronger IPRI component (not the case for Mauritania and Haiti), while the weakest is the LP (not the case for Haiti with PPR as its lowest component, and for Algeria, Moldova and Bangladesh with IPR as their lowest component). A comparison between the IPRI scores in 2017 and 2018 shows an important improvement, not only for the averages of the IPRI scores and of its components, but also in the maximum level shown by the sample of countries. Countries are grouped according to their geographic regions, income level, degree of development and participation in economic and regional integration agreements.
This year, Emerging & Developing Europe surpassed Latin America & the Caribbean and the countries south of the Sahara. Income group (WB classification): This year, income classification groups get the same display of IPRI scores: at the top, High Income, followed by Upper Middle, Lower Middle, and Low Income countries. The highest improvement is seen by the Upper Middle group and the most significant decrease by low-income countries (-0.1345).
It is worth noting that some groups are in different classifications and report different point values.
IPRI-POPULATION
IPRI AND GENDER
IPRI-GE = IPRI + 0.2*GE
DATA & METHODOLOGY
- Women’s Access to Land
- Women’s Access to Credit
- Women’s Access to Property Other than Land
- Inheritance Practices
- Women’s Social Rights
In marriage: determines whether women and men have the same right to be legal guardians of a child during marriage. Post-divorce: measures whether women and men have the same right to be legal guardians and have custody rights over a child after divorce. It assesses whether women face restrictions on their freedom of movement and access to public space.
The final GE score is an index based on the average of the five equally weighted variables. A minimum score (0) means complete discrimination against women, while the maximum score (10) is given to countries with gender equality. This is minimized in the IPRI-GE thanks to the variability of the IPRI scores.
IPRI-GE AND GE: COUNTRY RESULTS
Looking in detail at the GE components, we find that inheritance practices for widows (6.27) and daughters (6.17) and women's access to land (7.02) are the two items with lower scores (Figures 17a and 17b). Fourteen (14) countries have the highest GE=10 score: Austria, Belgium, Croatia, Czech Republic, Denmark, Dominican Republic, Iceland, Ireland, Latvia, Lithuania, Luxembourg, Panama, Portugal and Slovakia. In the range of results [10-9] we find Singapore, Germany, United Kingdom, Belgium, Ireland, Iceland, Hong Kong, France, Estonia and Israel.
At the other extreme of IPRI-GE, with scores below five (5), we find Rep. a GE of 7.83 and Venezuela with a GE of 9.93). A similar situation occurs with Latin America and the Caribbean and emerging and developing Europe; while the opposite happens with MENA & Pakistan (GE= 4.377) and Emerging & Developing Asia (GE= 5.952).
Income classification (World Bank): This year IPRI-GE and GE show the same model as IPRI, keeping the relationship between property and economic power. It should be noted that CIS, CAN, PARLACEN, MERCOSUR and CARICOM show high GE scores, but their IPRI scores lower their IPRI-GE values. As in the IPRI, the number of countries belonging to each quintile increases from the top 20% to the bottom 20% (first quintile 17 countries, second quintile 20 countries, third quintile 23 countries, fourth quintile 27 countries and 5th 34 places ).
Thus, the fourth and fifth quintiles include countries) of the countries included in the sample.

IPRI, DEVELOPMENT AND 21 ST CENTURY DISRUPTIONS
- SOCIO-ECONOMIC OUTCOMES
- FREEDOM
- SOCIAL CAPITAL
- E-SOCIETY
These questions led us to examine the relationship of some electronic society indicators with the IPRI and its components. The Gini coefficient is a statistical measure of the degree of variation represented in a set of values. Government Spending: This component – of the Heritage Foundation's Index of Economic Freedom – considers the level of government spending as a percentage of GDP.
Tax Freedom: This component—of the Heritage Foundation's Economic Freedom Index—is a measure of the tax burden imposed by the government. Entrepreneurship Ecosystem: Using GEDI's Global Entrepreneurship Index, which measures the health of entrepreneurial ecosystems in countries. Poverty and economic decline: strain the state's ability to provide for its citizens.
We then used the Pearson correlation coefficient, a measure of the linear dependence between two variables, to evaluate their correlations with the IPRI and its components. It allows the analysis of the type of association (direct or indirect) and the level or degree of intensity between them. It is also important to highlight the strong correlation of the IPRI with the FSI dimension.
It is interpreted as the proportion of the variance in the dependent variable that is predictable from the independent variable. Political Freedom: Using the Political Rights Dimension of the Freedom in the World Index (FW) by the US-based non-governmental organization Freedom House. Civil liberties: Using the civil liberties dimension of the freedom in the world index by the US-based non-governmental organization Freedom House.
The strongest Pearson coefficient was found between the Political Development Index component of the World Electoral Freedom Index (WEFI-PDI) and the LP (0.877), followed by those with IPRI (0.864). Another economic freedom index, this time the Economic Freedom of the World Index (EFW) had a good correlation with LP (0.728) and the IPRI (0.722). In a third group we find Freedom House's Civil Liberties and Political Rights of the Freedom World Index.
It should be noted that the Political Rights and Civil Liberties of the Freedom in the World Index by Freedom House is compiled from numerical ratings, ranging from 1-77. The Global Open Data Index (Open Knowledge International) provides a comprehensive snapshot available of the state of public data publication of public data.

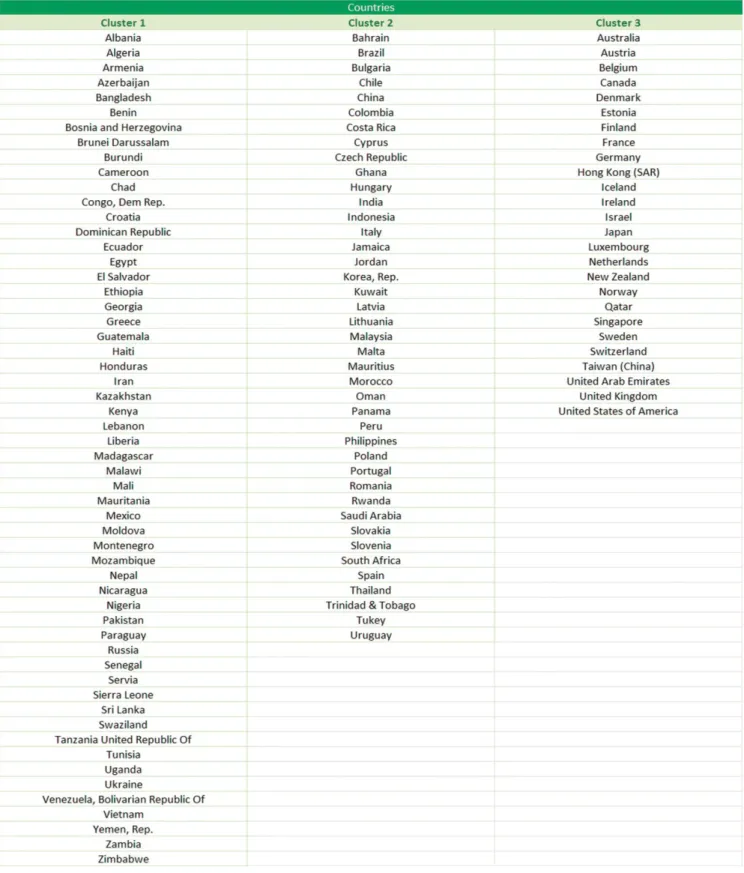
IPRI CLUSTER ANALYSIS
- CLUSTER DESCRIPTION
Their definite direction indicates the direct relationship with the individuals, i.e. because countries are in the same direction of the vector, countries tend to have a higher relationship with this dimension. It has the opposite direction as vector PPR, which coincides with the low score in this sub-index: Haiti is the bottom country in the sample. The analysis of each cluster can describe the internal characteristics of the countries within it.
Using the IMF's regional and development criteria and the World Bank's income criteria, sub-Saharan Africa and lower-middle-income, upper-middle-income and low-income groups are highly represented in this cluster. Because cluster 2 is very close to the origin of the factor axes, this gives results that are not significant for most variables. Using the IMF's regional and development criteria, developed economies and Latin America and the Caribbean are highly represented in this cluster; while according to World Bank income measures, high-income and upper-middle-income countries are the most common in the cluster.
The farthest country in the group is France, followed by Israel, Qatar, Estonia and New Zealand. Using the IMF's regional and development criteria, advanced economies are heavily represented in this group. According to the World Bank's income criteria, the high-income group is the only one represented in this group.
There is also a large difference in the number of countries that are part of the agreements, some with many members (OECD has 35 members and the EU has 28 members) and others only a few. The Organization for Economic Co-operation and Development, European Union, Association of Southeast Asian Nations, Organization of the Petroleum Exporting Countries and the Trans-Pacific Partnership have members in all three groups. The members of the Central African Economic and Monetary Community, Pacific Alliance, Commonwealth of Independent States, Caribbean Community and European Free Trade Association belong to only one grouping.
The data suggest that most of the selected integration agreements show some degree of heterogeneity in terms of the strength of property law systems among their members. At the same time, heterogeneity could also be seen as an opportunity, as policies could be targeted at specific members of the agreement. This confirms the coherence of IPRI and the relevance of property law systems affecting societies.
FINAL REMARKS
APPENDICES