Worked examples of the scheme for 30 lakes are presented and the approach to develop a fully tripartite, risk-based prioritization system for lakes with respect to acidification and eutrophication is outlined. The anthropogenic phosphorus (P) load (human sewage, land runoff and livestock waste – the latter data were not available for Scotland) was used as a measure of eutrophication risk.
RISK BASED PRIORITISATION PROTOCOL
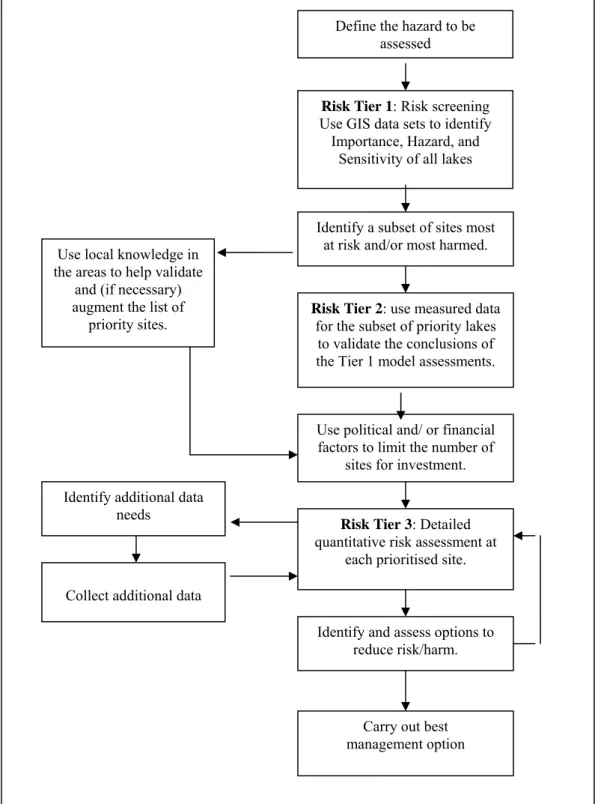
The three tier approach
The number of lakes that pass to level 3 of danger cannot be determined on purely objective, ecological criteria. No further development of the significance assessment is required at Risk Level 3 beyond that done at Risk Level 2.
Results of the Risk Tier 1 assessment
Although, in the absence of other criteria, the total number of importance criteria into which each site falls can be summed to identify those of highest importance. Carry out best management option Use political and/or financial factors to limit the number.
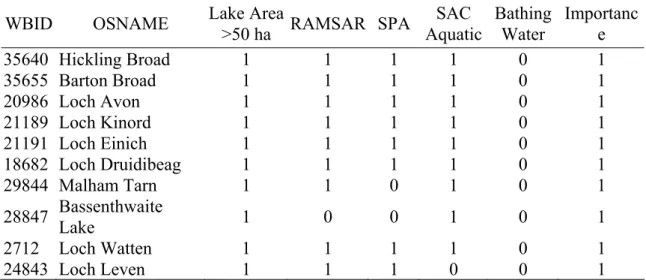
IMPORTANCE
However, this information is available in the Inventory for Sites in Great Britain (TBL_SSSI) and is included as an additional importance rating criterion in the query 'QRY_importance criteria'. An additional column in the query 'QRY_importance-criteria' identifies those lakes that contain a BAP species, in addition to all previous criteria.
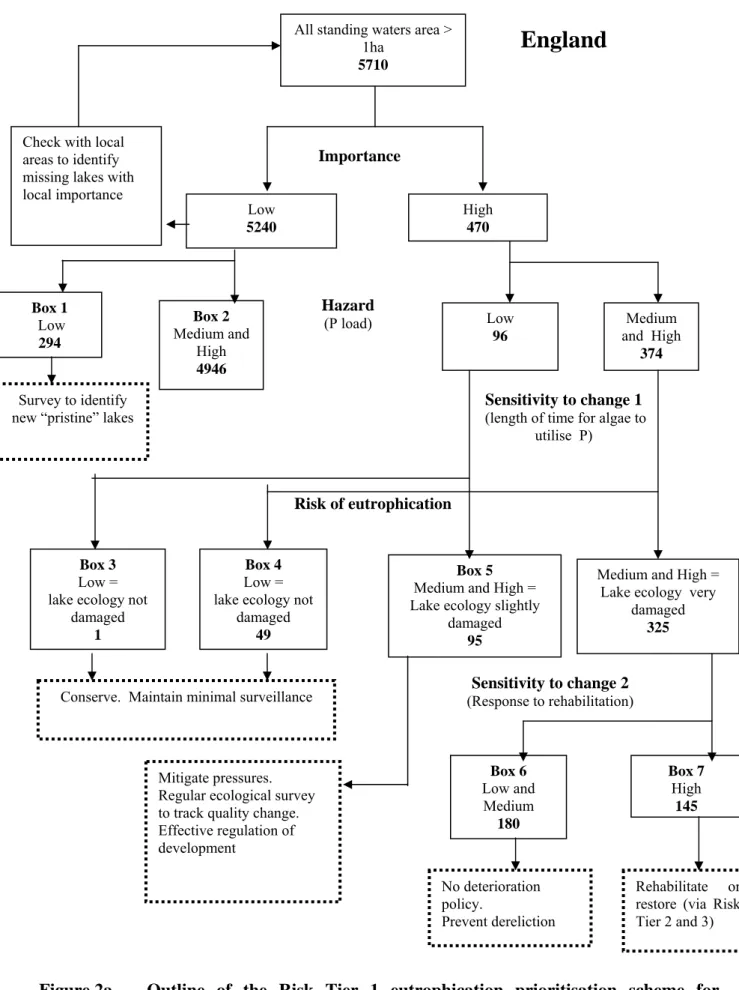
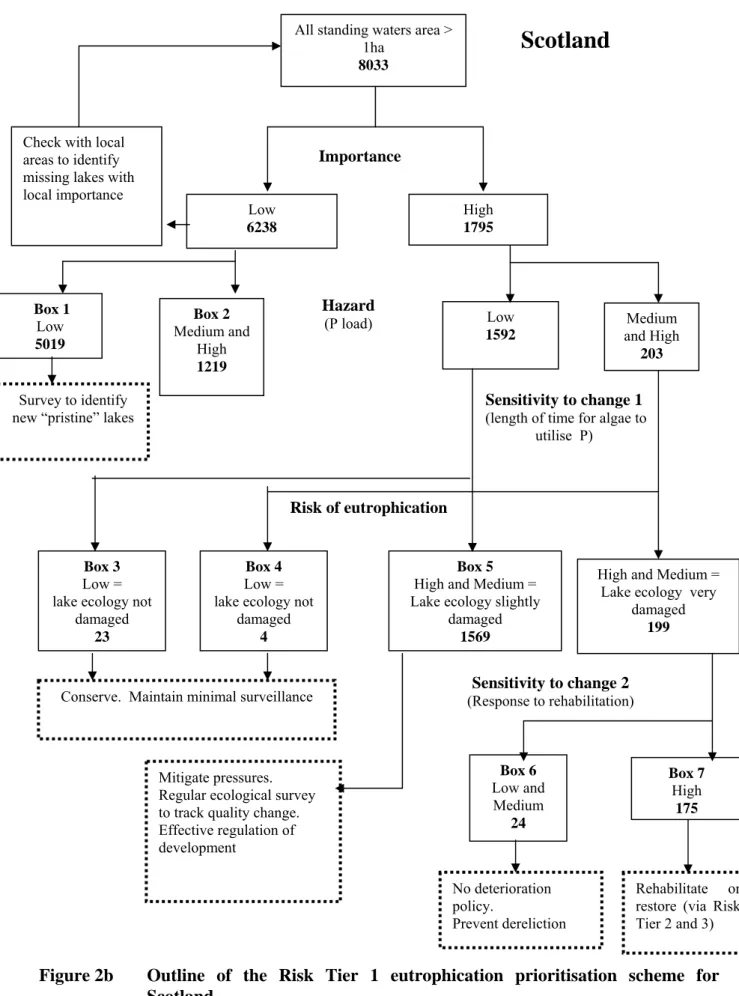
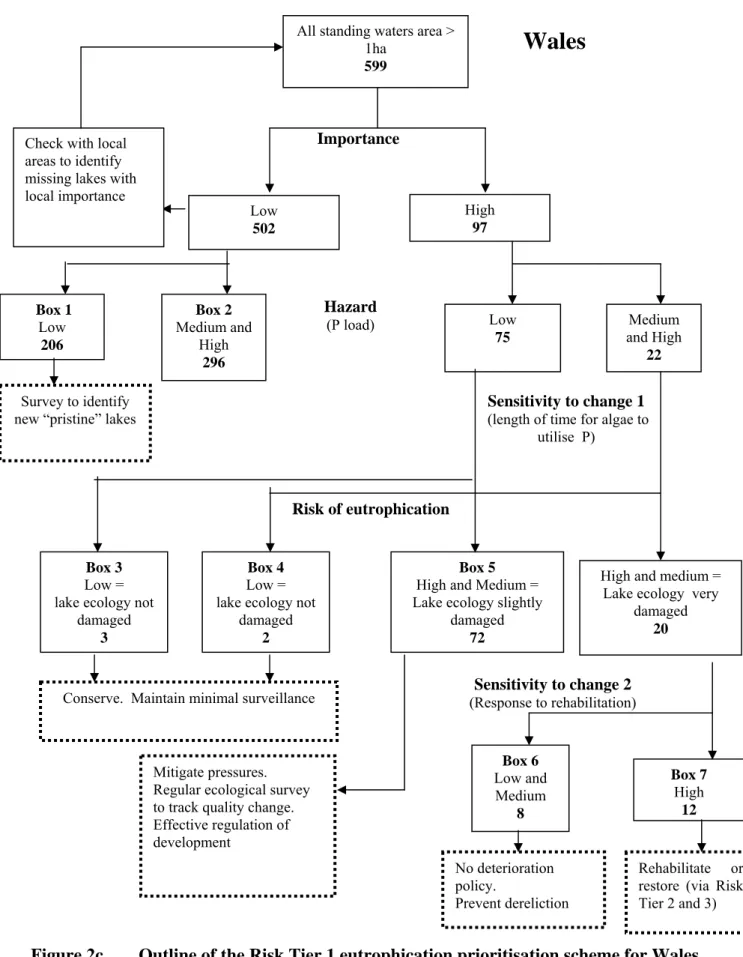
THE EUTROPHICATION PRIORITISATION SCHEME
Risk Tier 1: Risk screening
- Hazard
England
Scotland
Wales
Sensitivity
First, the lake retention time was used to give an indication of the ability of algae to utilize the nutrients. Reynolds (1992) showed that the stability of the water column can be predicted with reasonable reliability using the relationship between the Wederburn depth at an 8 m/s wind speed and the maximum depth.
Risk assessment
If the ratio derived from the Wederburn depth (QRY_Wederburn depth) divided by the maximum depth is less than or equal to 1, then the lake is unlikely to stratify for significant periods of the summer. Lakes with values of the ratio significantly greater than 1 are likely to stratify throughout the summer.
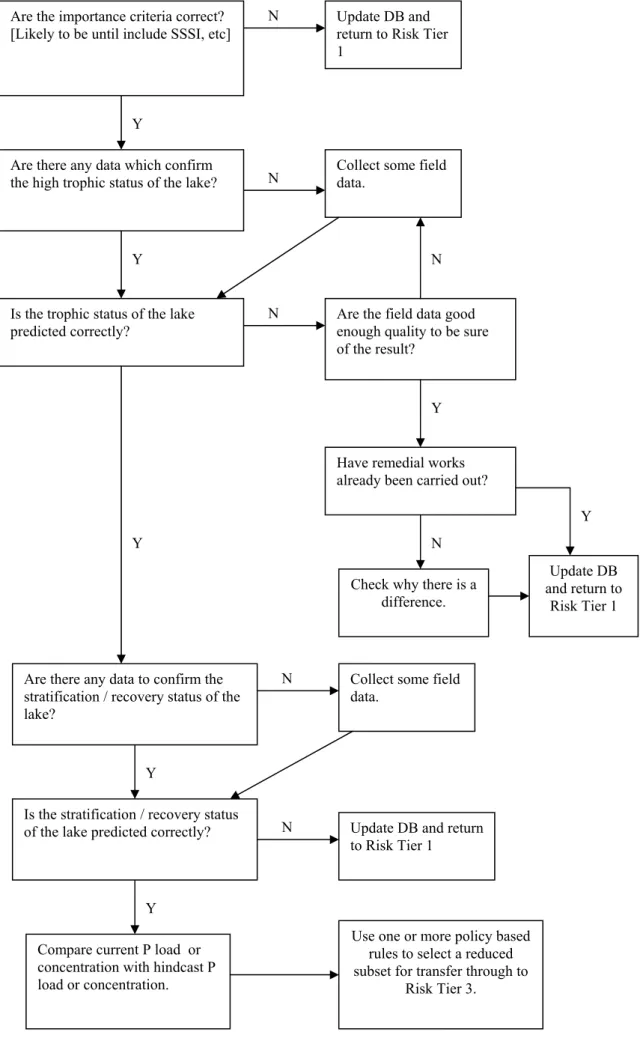
Risk Tier 2: Generic quantitative risk assessment on sub-set of lakes
- Current status
- Damage or temporal change
Consequently, diatoms have been successfully used to develop models (transfer functions) to quantitatively infer past lake TP (eg Bennion, 1994; Bennion et al, 1996a). At Risk Tier 2, a low-resolution analysis of diatoms preserved in a lake sediment core could be carried out to assess the degree of eutrophication.
Risk Tier 3: Detailed quantitative risk assessment at site specific level
- Current status
- Extent of damage and targets for recovery
A comparison of the discarded P load or concentration with the current P load or concentration allows an assessment of the extent of eutrophication at a given site. The approach is capable of providing estimates of baseline (reference) TP concentrations in lakes, and when coupled with dating of sediment cores, can determine the timing, rate and possible causes of eutrophication at a specific site (e.g. Bennion et al, 1996b; Bennion et al, 2000).
THE ACIDIFICATION PRIORITISATION SCHEME
- Risk Tier 1: Risk screening
- Hazard
- Sensitivity
- Risk assessment
- Risk Tier 2: Generic quantitative risk assessment on sub-set of lakes
- Current status
- Damage or temporal change
- Risk Tier 3: Detailed quantitative risk assessment at site specific level
- Current status
- Extent of damage and targets for recovery
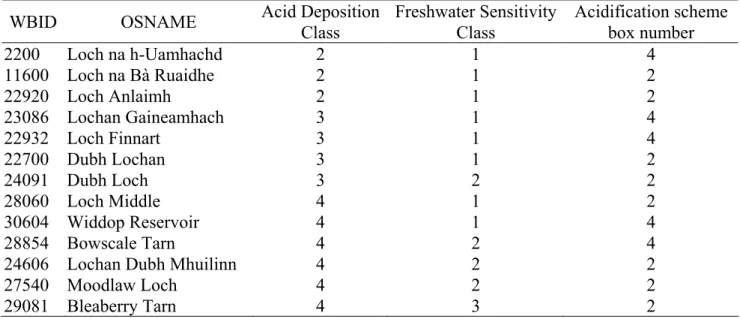
All lakes in freshwater sensitivity classes 3, 4 or 5 are considered not to be at risk due to their insensitivity to acidification and therefore do not move to risk level 2. In the risk level 1 analysis, the different criteria (importance, hazard, sensitivity) were applied sequentially, with the number of lakes going to the next filter decreasing with each step (Figure 4). Lakes in the combined acid deposit-freshwater susceptibility classes given above that were at risk were passed to the Risk Tier 2 assessment.
Critical loads and exceedances are then calculated for each lake to assess the accuracy of the Tier 1 risk estimates based on the acid deposition load and dominant freshwater sensitivity classes. At risk level 2, critical loads may be used instead of risk level 1 freshwater sensitivity classes to improve the sensitivity assessment. Is the acidification risk correctly predicted by sediment and sensitivity data at risk level 1.
The model is data-intensive and unsuitable for use at the national level, but could nevertheless be used at risk level 3.
APPLICATION OF THE PRIORITISATION PROTOCOL TO 30 TEST LAKES
- The testing procedure
- Application of the protocol to 30 test lakes
Information on management measures and remediation schemes to confirm whether any restoration has been carried out to date. iv) Measured mean and maximum lake depth, residence time and stratification data to confirm stratification and recovery status for the eutrophication scheme. v) Critical load and exceedance data to improve risk assessments made using acid deposition loads and dominant freshwater sensitivity classes at risk level 1 in the acidification scheme. Since the diatom community is considered the most sensitive aspect of the biota, it can be argued that the critical load of the diatom model can be used to identify the point of first change in a lake ecosystem. Negative critical load exceedance values indicate that the load is not exceeded, while positive values indicate that the load is exceeded. you).
For the eutrophication scheme, the final P concentration from the Reading model for England and Wales (Johnes et al, 1996) and the PLUS model for Scotland (Ferrier et al, 1997) and/or the P concentration from diatom P transfer functions (e.g. Bennion et al. al, 1996a). The final TP concentrations generated by the export coefficient models were compared with those derived from the diatom models. For an acidification scheme, the last reading of ANC and/or the last reading of pH from diatom transfer functions (eg Stevenson et al, 1991).
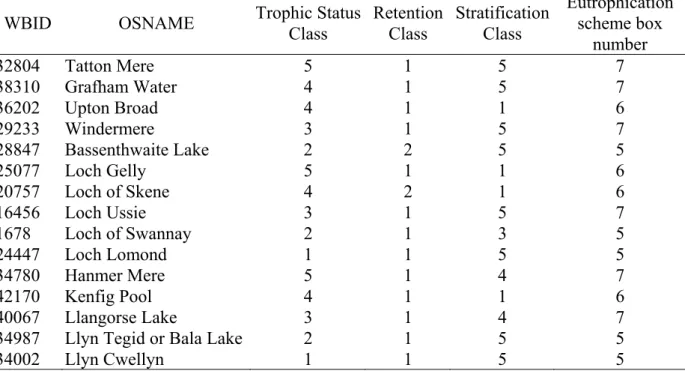
The results for each of the test lakes are presented in Tables 4 and 5 and are summarized below.
Llyn Tegid (Bala) / 34987
In each case, the number of the field in which the lake is placed in the eutrophication (Figure 2) or acidification (Figure 4) priority scheme is given, as appropriate.
Llangorse Lake / 40067
Butterstone Loch / 23531
Loch Davan / 21123
Loch Eck / 24996
Loch of Harray / 1753
Kilbirnie Loch / 26566
Loch Leven / 24843
Loch Lomond / 24447
The lake contains a number of protected species such as Pilularia globulifera, Elatine hydropiper, Rumex aquaticus and Coregonus lavaretus. The modeled trophic status class of 1 slightly underestimates the actual measured TP values, but the lake is nevertheless correctly modeled as nutrient poor. While the PLUS model and monitoring data indicate stable conditions, paleolimnological data provide an indication of slight enrichment, e.g.
Loch of the Lowes / 23559
Loch Lubnaig / 24459
Lake of Menteith / 24919
However, this is based on a maximum water depth of 23.5 m and in fact most of the lake is shallow and well mixed (average water depth 6 m) and so the measured stratification class is likely to be closer to 3.
Grasmere / 29184
Windermere / 29233
Esthwaite Water / 29328
Bassenthwaite Lake / 28847
Chew Valley Lake / 43096
Rutland Water / 36479
Darwell Reservoir / 44955
Slapton Ley / 46472
Crose Mere / 35211
Barton Broad / 35655
The retention class is modeled correctly, but the stratification class is modeled as 4, while the measured data gives a class of 1. A lake restoration program has been running since the late 1970s, with the P load of STWs being reduced and sediment removed in the 1990s. The lake has a moderate sensitivity to enrichment (retention class 2) and available data indicate enrichment, e.g.
The measured stratification class of 1 indicates that the lake would have limited response to recovery.
Rollesby Broad / 35981
Malham Tarn / 29844
Coniston Water / 29321
The modeled trophic status class of 2 corresponds to the current measured trophic status and the macrophyte community is also classified as oligotrophic. The high retention time (class 1) indicates that the lake is sensitive to enrichment, but due to the relatively low hazard, the lake has a reasonably low risk of enrichment. Paleolimnological diatom data provide evidence of minor nutrient enrichment, but there is still minimal oxygen reduction in the hypolimnion.
Priest Pot / 29323
Llyn Idwal / 33836
Llyn Cwellyn / 34002
Loch Chon / 24754
Loch Dee / 27948
- Conclusions based on the test exercise
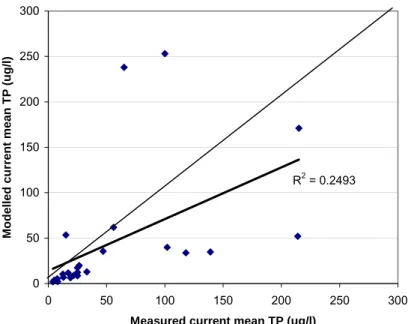
A comparison was also made between the hindcast TP concentrations produced by the export coefficient approach and those derived from the diatom models to evaluate the reliability of using these techniques to assess changes in nutrient levels (Figure 7). However, in a few cases the stratification class is overestimated by the model because the model is based on maximum rather than average water depth. There is a poor match between modeled and measured actual P concentrations for a small number of the test lakes, which cannot be explained simply by the absence of animal data.
In the eutrophication scheme, retention times and stratification classes are modeled incorrectly for a small number of lakes due to errors in the lake depth model used to estimate lake mean and maximum depth. There was good agreement between the modeled backcast TP concentrations produced by the export coefficient approach and the diatom transfer function approach. Since the former is based on nutrient export from catchment sources and the latter is based on the relationship between algal taxa and TP concentrations in the actual water column, the agreement between the two datasets was encouraging.
However, in the case of Llyn Idwal, the land cover data is incorrect as there is no improved grassland in the catchment.
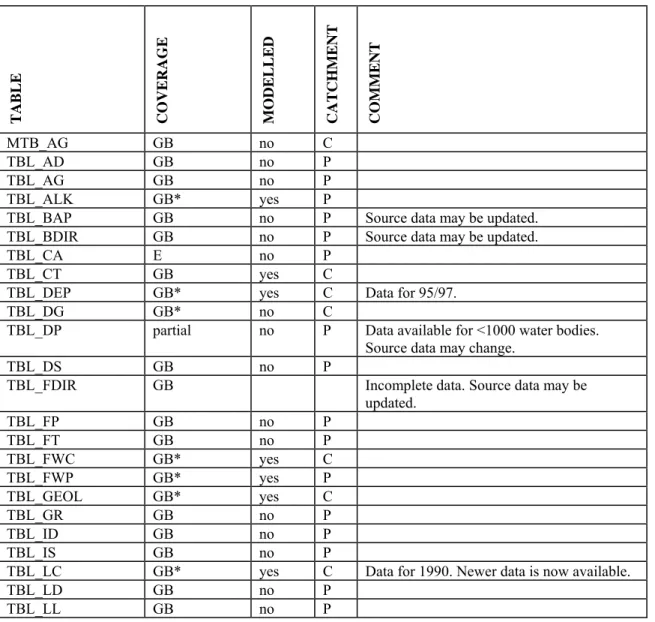
GEOREFERENCED INVENTORY
- Introduction
- Data Source
- Data Processing
- Catchment Delineation
- Data Types
- Lake Typology
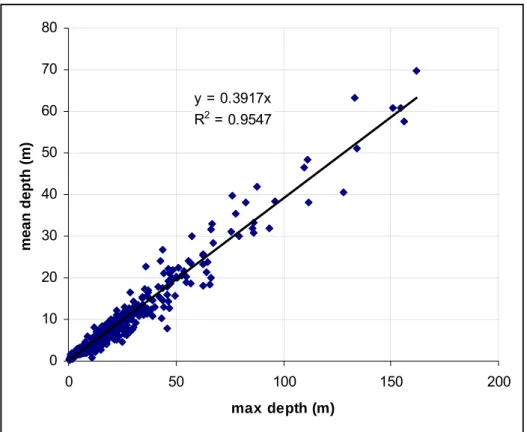
Measured depth data for approx. 5% of bodies of water >1 ha were collected from a wide variety of sources (including Murray and Pullar, 1910) and used in a simple multiple regression model to predict mean and maximum sea depths for volume and retention time calculations. England, Scotland and Wales were treated separately due to the different physical nature of water bodies in each country. The relationships were used to predict maximum depth for the remaining water bodies > 1ha in England, Scotland and Wales (TBL_MDP).
Most water bodies in any country are less than 1 hectare in area with less than 10%. In their survey of Scottish lakes, Smith and Lyle (1979) grouped water bodies larger than 25 hectares into logarithmic classes to investigate the relationships between the number of lakes, accumulated surface area and volume. Here there are two different distributions influenced by topography: England with most of its water bodies at lower elevations and Scotland and Wales with most at slightly higher elevations.
There are currently 470 records for 399 water bodies, including pH, conductivity, total phosphorus (TP), and alkalinity data, many of which are annual averages.
SUMMARY AND RECOMMENDATIONS
Description: Agency (Environment Agency, Scottish Environment Protection Agency or Isle of Man) management area in which water body centroid occurs. CAID LONG INT Character Area ID in which water body's centroid occurs - related to KEY_CA. NNRID LONG INT National Nature Reserve ID in which water body's centroid falls - related to KEY_NNR.