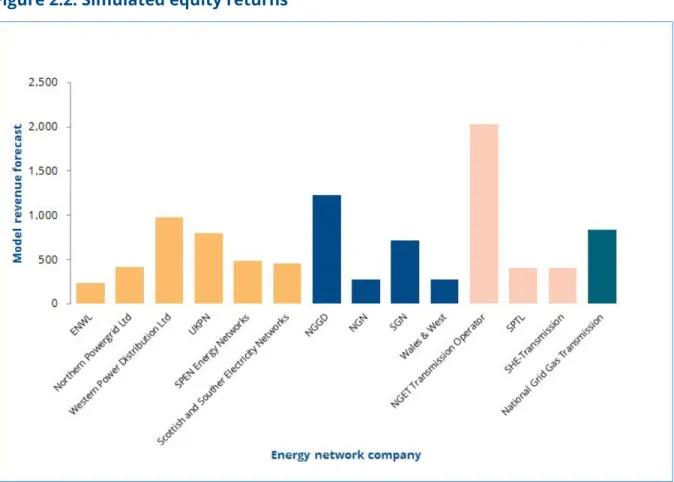
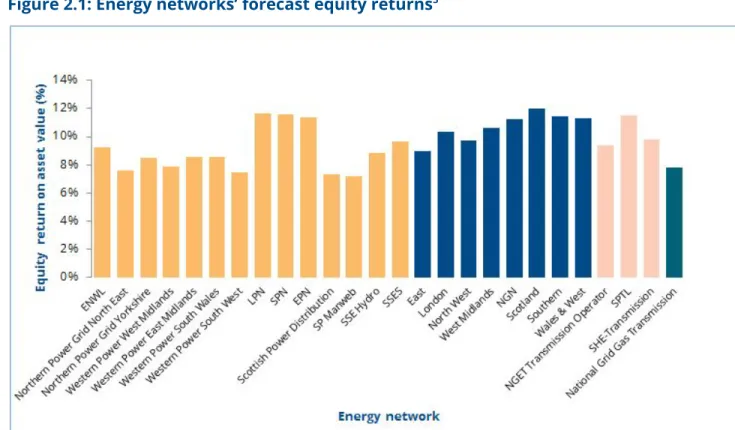
Consumer organizations should be given more powers to request a review of a price control when the financial returns are excessive. 3 These figures are calculated by adding the actual and expected costs of debt and returns on equity from the Price Control Financial Models (for basic financial returns) and RIIO Annual Reports (for estimates of additional premium payments). Their stock returns are expected to average 10% over the course of the price scrutiny.
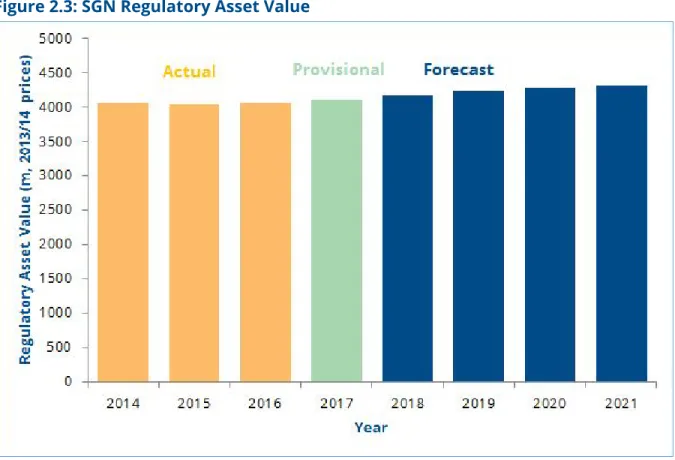
A well-calibrated price control package [is] one in which the reward available to the best performing companies provides the potential. But even under the conditions of the stated goal, the price control fails. For example, here is the expected RAV of SGN, a gas distribution company, in the course of the price check:.
The Cost of Capital
- The Weighted Average Cost of Capital
- Cost of equity
- Risk-free rate
- Equity beta
- Cost of debt
As mentioned above, because energy grids are monopolies it can't work like this - Ofgem has to make a decision on what a company's cost of capital should be. For example, Ofgem decided that National Grid's cost of debt is about 2.3%, its cost of equity is 7%, and the share of capital it would finance through debt is 60%. As we'll look at below, the main variables to decide on in order to establish WACC are the cost of debt and the cost of equity.
Although only a minority of network capital is financed by equity, it constitutes the majority of the cost of capital because it requires a higher return than debt. The cost of equity capital is determined by evaluating three values: the risk-free interest rate, equity premium and equity beta. Finally, Ofgem cannot simply derive the cost of equity from the risk-free interest rate and average equity returns.
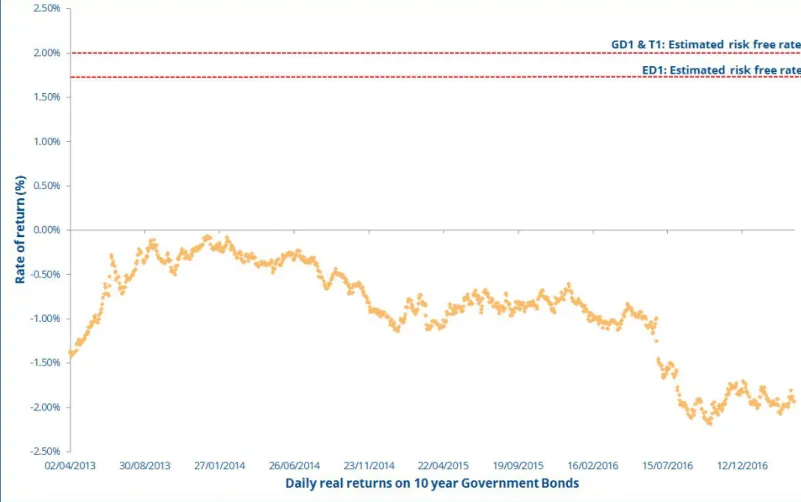
There is no ambiguity about the actual performance of the proxy for the risk-free rate - it is clear and observable data. 8 Ofgem's weighted average cost of capital for forward price control, Final Stage I Report, Europe Economics, 2010. The final element of the weighted average cost of capital that Ofgem needs to determine is the cost of debt.
In this round of price controls, Ofgem decided to index the cost of debt to the inflation-adjusted average of AAA and BBB-rated debt bonds. And since debt was much more expensive ten years ago than it is today, including this data in attempts to estimate prices today artificially drags the cost of debt upward.
Incentives for exceptional performance
Total expenditure incentive
In principle, these incentives also penalize energy networks if they deliver inefficient output or fail to provide good customer service. However, as Figure 2.7 shows, Ofgem expects incentive performance to be generally positive for all energy grid companies. Our analysis primarily considers the totex incentive and how other incentives are inappropriately calibrated, rewarding network companies for ordinary performance and rarely punishing them for poor performance.
Total expenditure (sometimes abbreviated to 'totex') is the revenue that Ofgem allows networks to spend on their activities, some of which can be controlled. So Ofgem allows them to keep a proportion of the total amount that energy networks spend on this allowance as profit and return the rest to consumers. While this system encourages some real efficiency, it also creates incentives for energy networks to inflate their initial cost estimates to Ofgem so that they can capture more of the difference between that estimate and actual costs as profit.
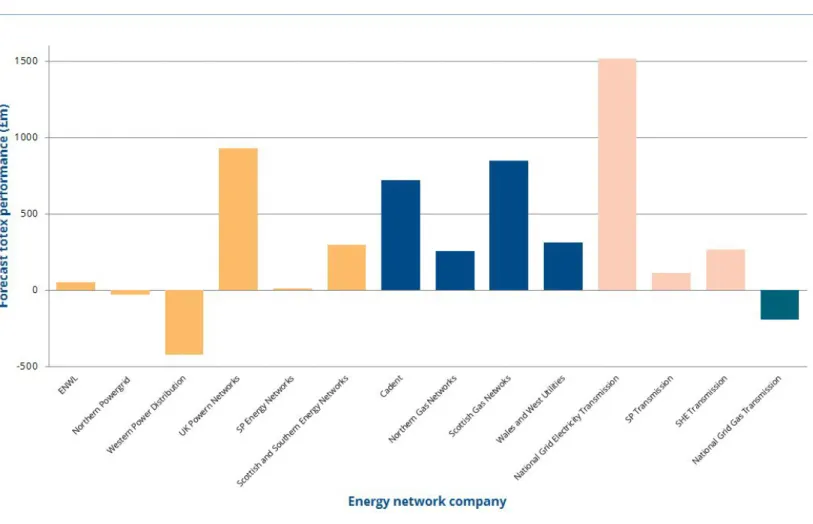
For the latest electricity distribution control, Ofgem sought to drive the right business plan by fast-tracking high-quality applications. As Figure 2.8 shows, a small number of network companies are overspending against their total spending allowance and experiencing a financial penalty as a. However, the overall picture is still a considerable success by the networks: our model estimates that they will earn over £2.5 billion in profit from their totex incentive over the course of the price control.
11 Because of the way the price control is structured, most of this gain is realized through additions to the regulatory value of assets, which gives investors returns over the longer term. In setting the compensation, Ofgem predicted how industry-specific costs for things like material and labor would change over the course of the price control and factored that prediction into the allowable costs - what they call Real Price Effects.
Other incentive performance
Inflation measure
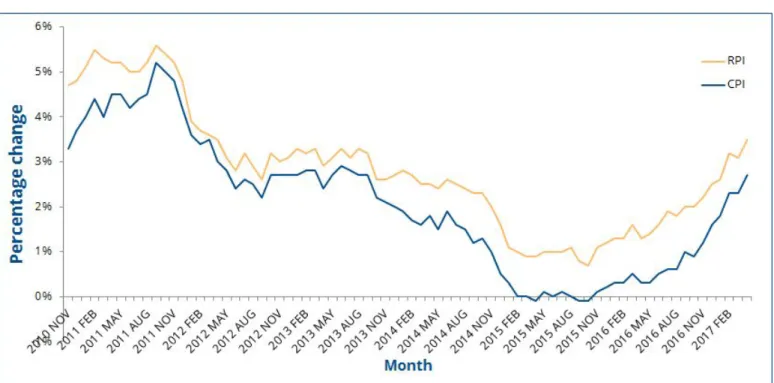
The effects of a change from the RPI to the CPI are complex and it is uncertain what the short-term effect would be on consumer bills. In the long term, consumers will benefit from using a credible measure of inflation, which has historically been lower than RPI. However, we do not include the effect of the change from the RPI to the CPI in the model we present in Chapter 3, and we intend to explore the implications of this shift in the future.
Our model’s results
- Overview of our model
- Headline results
- Low savings model
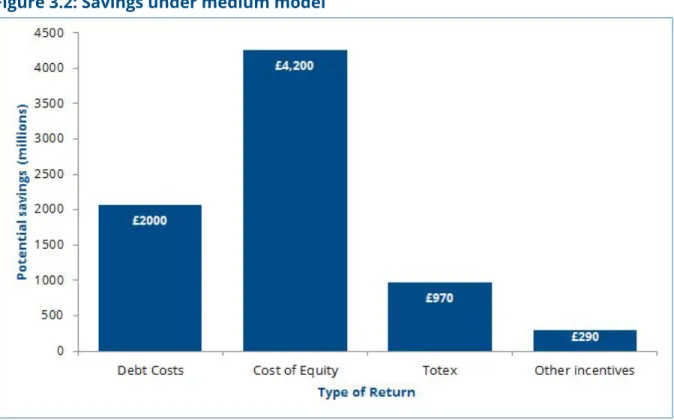
- Medium savings model
- Cost of debt
- Incentive recalibration
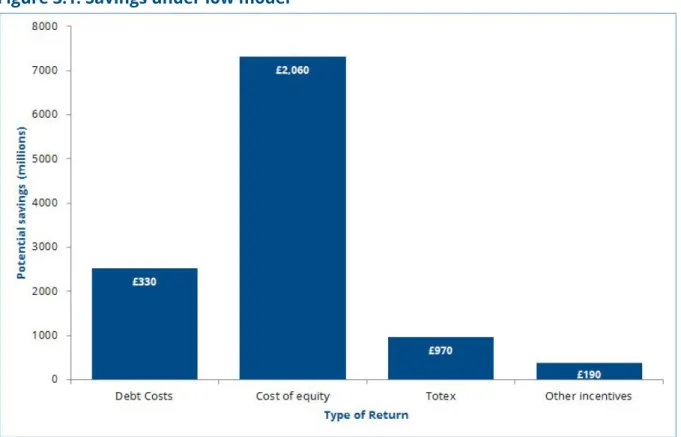
The results of the low savings model are summarized in Figure 3.1 and total £3.5 billion over the course of the price control. It lowers the cost of the debt index to 5 years rather than 10 years, but maintains the existing trombone;. The results of the average savings model are summarized in Figure 3.2 and total £7.5 billion over the course of the price control.
The results of the high savings model are summarized in Figure 3.3 and total £11.1 billion over the course of the price control. However, even a more modest implementation, as in the medium savings model (our central estimate), reduces consumer bills by £7.5 billion over the course of the price control. And even with relatively small changes, Ofgem could save consumers £3.5bn over the course of price controls.
Ofgem currently indexes the cost of debt on a ten-year basis, using an average of real debt costs of 10-year A-rated and BBB-rated bonds. For this example, we use March 31, 2016 as the end of the debt index and show how the cost of debt is affected by reducing the index from 120 months to 12 months. As it shows, due to the historically low current cost of debt, the more closely the index matches current market prices, the lower consumers' bills are predicted to be over the course of this price control.
Our indexation of the risk-free rate then forms part of our calculation of the counterfactual cost of equity. For this example, we use March 31, 2016 as the end of the risk-free rate index and show how the risk-free rate average decreases as we decrease the index from 240 months to 120 months. We estimate the 20-year index will reduce consumer bills by £1.1 billion over the course of the price controls and the 10-year risk-free rate index by £2.1 billion.
For each price check, Figure 3.7 shows how adjusting the equity beta from 0.8 down to 0.5 (where Ofgem's advisors recommend lowering) affects consumer bills.
Our recommendations
- What should be done now: give consumers their money back
- Rely on indexes, not forecasts
- Chosen measure of inflation
- Incentive calibration
- New powers for consumer bodies
This year, Ofgem will start making its early strategic decisions on the design of the next price control. A recurring theme in our analysis has been the limitations of the regulator's ability to predict accurately. The only way to avoid the pressure above is for the regulator to take their judgment out of the game.
However, the long-standing practice of assuming that the risks faced by network companies are close to or equal to the average company is not justifiable for low-risk natural monopolies that are too important to the nation to fail. Ofwat, the 18 water regulator, has its transition to the preferred inflation measure from the start. This will lead to sharper incentives to excel, as it increases the likelihood of financial penalties that have been relatively rare in the price controls so far.
Second, incentives should be bankable - once network companies are incentivized to achieve a standard, it should be treated as "business as usual" and companies should face penalties if they fail to achieve it. In such cases, we will consider requests from the company concerned for changes to its price controls.” 19. It protects network companies but provides no comparable option for price controls to be reopened during economic surpluses.
There is a 28-day period for appeals - but many of the problems we identify here could not have been recognized within that window. We therefore recommend that consumer bodies be given a similar power to request the variation of a price control in cases where the financial returns are excessive, with Ofgem required to give due and reasonable consideration to non-concerning requests.
Technical Appendix: methodological note on our model
Primary data sources
Model variables
Our model allows manipulation of the length of both the ten-year average and the trombone. The trombone must always be longer than or equal to the average and only applies to the ED1 part of the model (equal means the trombone has no effect). Our risk-free rate index covers the daily return on 10-year UK government securities since 1985.
It then constructs a rolling average, depending on the user specified input for number of years to construct the average in, for each year of the price control, similar to the cost of debt index. If the risk-free rate and equity premium were inversely related, this would reduce the savings we identify in this report (although the effect would be muted by our model's reduced equity betas). Our model allows the removal of real price effects by inserting the total real price effects into the model for each price control.
Where the sharing mechanism is a decimal value representing the efficiency savings returned to the consumer in each case. Our model allows adjustment of the measure of inflation from the Retail Price Index to the Consumer Price Index. It does this by deflating the regulatory asset values of all network companies from 2016-17 prices to the first year of price control (either 2009-10 or 2012/13) and then inflates the value using the CPI.
Where inflation forecasts are not available, we use the last year's value for which the OBR has presented forecasts. For non-totex incentives, our model allows adjustment of the cost of equity to reflect tougher or weaker assessments by Ofgem on incentive benefits.
We help people