Needless to say, changes in the water regime in these aquifers will affect the wetland. As described above (Section 3.2), the main concern here is the average head in the aquifer in the vicinity of the wetland.
Leakage Factor (C)
Monitoring requirements and use of additional data
A refined estimate of C can be obtained by measuring water levels in the aquifer near the edge of the wetland wetland area and in the wetland substrate near the center of the wetland area. Regardless of the conceptual model used to describe wetland behavior, the relationship between wetland discharge and the elevation difference between the wetland and a specific point in the aquifer may be related to wetland geometry, aquifer parameters, and C.
Conclusions and Recommendations
- The way forward
The problem of determining an acceptable withdrawal from any new or increased withdrawal is one of relating the withdrawal into the aquifer to changes in the water regime of the wetland. The Sum Exceedance Value (SEV) is a promising indicator of the water regime in wetlands, the value of which has been demonstrated in the Netherlands and Great Britain. C is also implicit in the spring flow model used in evaluating the maximum acceptable drawdown.
Exploration of variation in the wetland runoff factor and a more complete interpretation of fluctuations in wetland water levels in response to climatic and hydrogeological factors will increase the confidence with which these simple methods can be applied.
APPENDIX A
- APPENDIX 2: A NEW WELL FUNCTION FOR ESTIMATING DRAWDOWN AT A WETLAND AND INDUCED LEAKAGE
- CASE 1: Given a set o f real parameter values and the pumping period o f a single w ell, this case gives both Theis and ‘wetland* drawdowns, both at the end o f
- CASE 2: This is essentially the same as CASE 1, except the results are given for a range o f pumping periods in a large table that facilitates graph production
- CASE 3: This is a multiple well case. Total drawdown is computed for a number (up to 100 in the current version) o f wells each with a single period o f pumping
- CASE 0 DATA:-
- The number o f p values in record 3 (*10)
- Up to 10 values
- The number o f a values (*10)
- Up to 10 a values
- The start time, end time and time interval, all as log base 10 of time
- CASE 1 DATA:-
- See the Notation
- CASE 2 DATA:-
- See the Notation for an explanation, tpi tp2 and Atp are the start time, end time and time interval
- CASE 3 DATA:-
- Up to 100 wells (NWELLS *100). See Notation
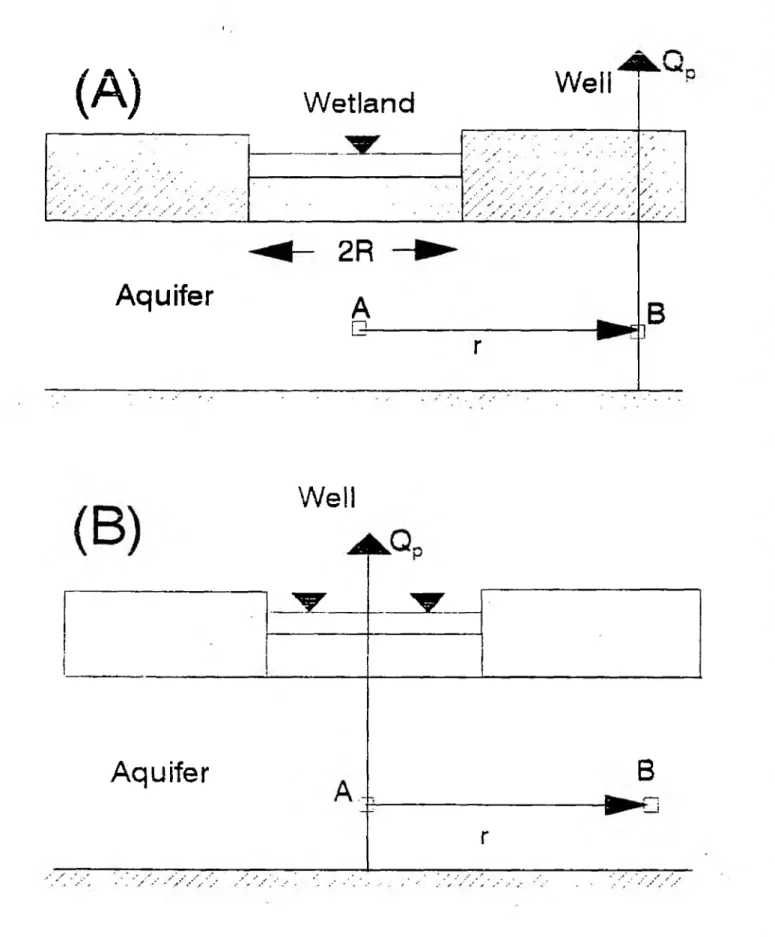
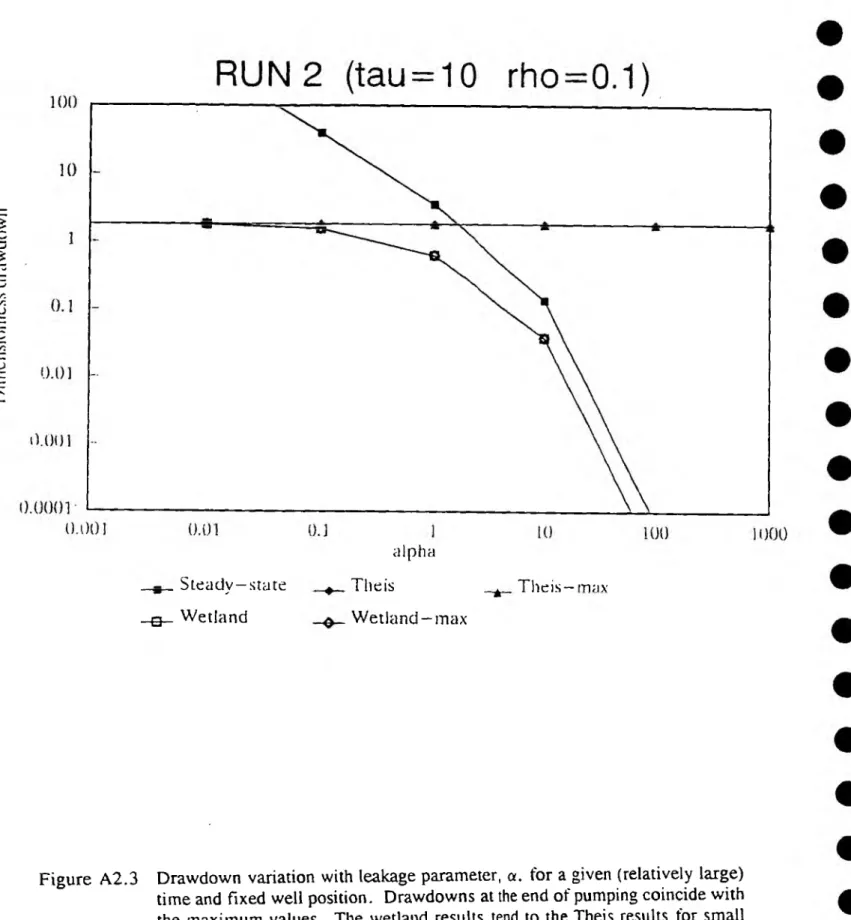
Applied to Figures A 2.1(A) and A 2.1(B), the principle of reciprocity states that the subsidence at point A due to pumping at point B is the same as the subsidence at point B due to pumping at point A. The main constraint when applied to the current problem is that by solving the problem depicted in Figure A 2.1(A), the resulting drawdown applies only to the point in the aquifer below the center of the wetland. No attempt has been made to 'invert' the Laplace transform solution given by equation (14) to obtain s(r,t), since very efficient and accurate software is available to evaluate the drawdown s(r,t) from The Laplace transform.
This model has only two parameters related to the wetland.) (ii) The need to adopt a model for which the wetland parameter values. iii).
A) Wetland Well
Aquifer
Well
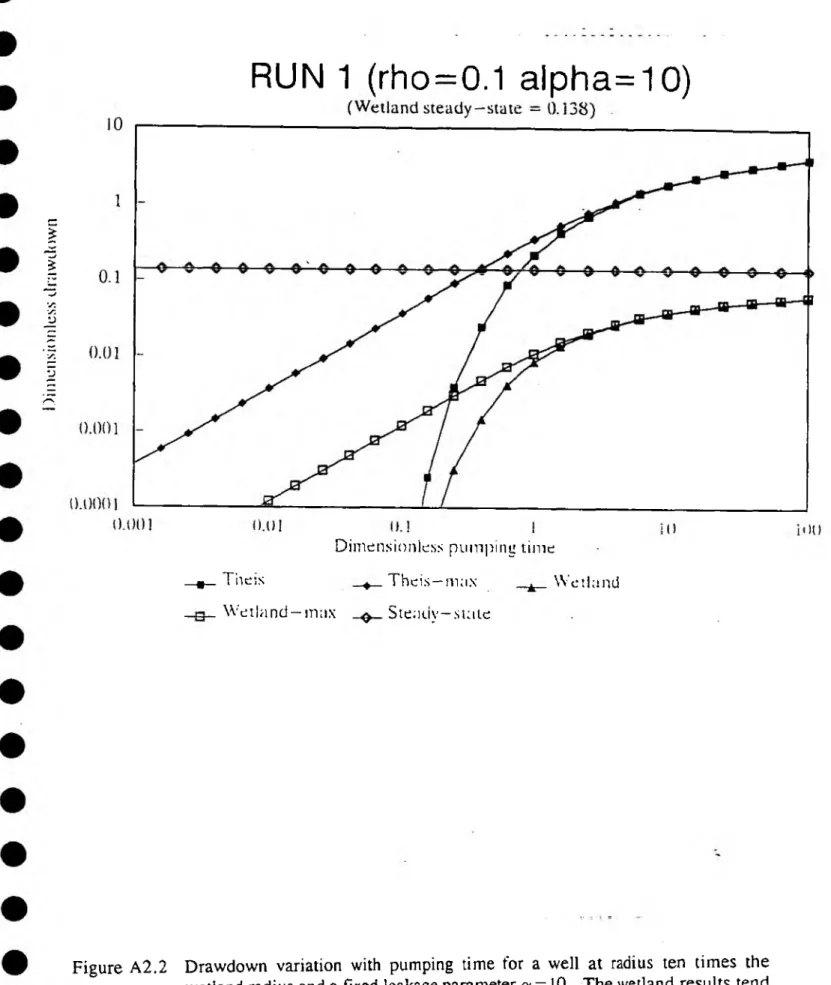
RUN 1 (rho=0.1 alpha=10)
This concerned the importance of the wetland's groundwater catchment to protect the wetland from the adverse effects of groundwater extraction. Water abstraction is equivalent to water use by plants, evaporation, and runoff from the wetland through surface drains. To determine if this is the case, we added more of an "aquifer" to the model between the wetland and the constant-elevation boundary.
Thus, wetland watershed delineation does not appear to be necessary for predicting wetland change.
Well pumping at 500m3/d
Wetland runoff is considered to be in the form implicit in the drainage function available in the MODFLOW model. The well is taken as a point source at an arbitrary position relative to the wetland. At large distances from the wetland and the well the flow will be in the x direction, that is.
Also, the position of the well relative to the wetland can be rewritten in terms of dimensionless radius and angle (both o f can be written in terms of dimensionless x and y values).

APPENDIX B
Two pairs of dip wells have been installed by English Nature and a deep/shallow p iezo meter pair was installed by the NRA in 1993. The variation of water levels in 1993 and 1994 is greater than that predicted by the M IROS model: this may indicate recent dehydration effects or an o v e r-e s time of the specific yield for the precise location of the piezometers. Blo'Norton & Thelnetham Fens - observed water levels (piezometer TM07/167) and water levels predicted by.
MIROS model with wetland groundwater extraction areas of 1.05 km2 (min.) and 2.1 km2 (max.).
Blo'Norton & Thelnetham Fens - contours of change in
Catfield Fen - contours of change in SEV>20 for areas of submergence and wetland catchments. Calculations of expected raw water in the wetland area using the Theis equation and withdrawal rates from the NRA license data archive have been performed. The transm isivity and storage coefficient values used in these calculations were derived from a pump test on a borehole at TG km from the wetland).
A detailed analysis of the water budget by Mason (1990) was carried out to determine the need for water supply to the dykes to counteract the effect of withdrawal from the Cretaceous.
Chippenham Fen
Chippenham Fen
The transmissivity and storage coefficient values used were taken from a pumping test at C hippenham pumping station (TL 673 667). D e e p /sh ll w piezometer p air was installed in 1993: records to date indicate that there is little difference between the p iezo m etric heads in the surface soil and the underlying Upper Cretaceous. The range of observed water level variations is much larger than that predicted by the MIROS model, and it is possible that the specific yield should be much smaller.
The spatial structure of the site can be important in maintaining fen conditions in the depressions and around open water.
East Harling Common
East Harling Common - observed water levels (piezometer TL98/178) and water levels predicted by the MIROS model with groundwater extraction areas of 0.34 km² (min.) and 0.71 km² (max.).
Drawdowndue to abstraction, m
East Harling Common
The water level monitoring point at Overy Cottages, Q uidenham (TL km of wetland area was used to calculate the parameters for implementing the 10% rule. extraction rates from the NRA Licensing Data Archive were carried out The transmissivity and storage coefficient values used in these calculations were derived from a pumping test in a well at TM km from the wetland.
The annual range of observed water levels is greater than that predicted by the MIROS model: this is thought to indicate that the piezometers are representative of the drier grassland rather than the ant communities.
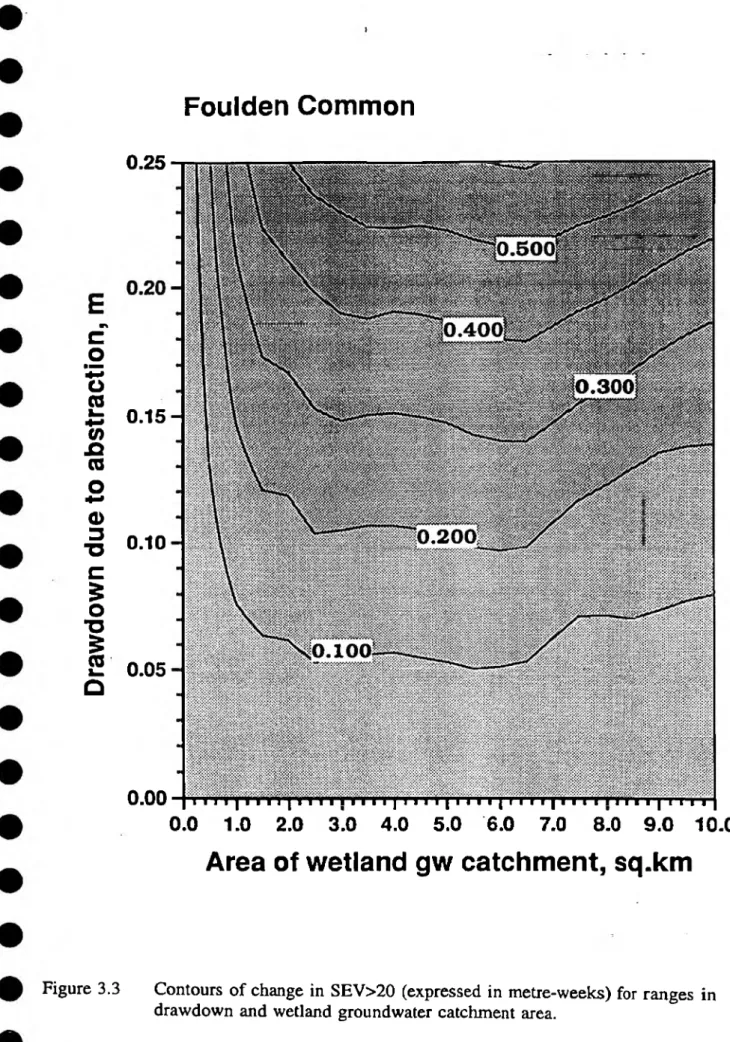
Foulden Common
Foulden Common 10.0 i-
Drawdowndue to abstraction,
Foulden Common
Using returns, as shown in the table b e lo w , for this red page is its obvious effect. It appears that this license was only used in 1993 and thus could not have caused the effect seen in the p iezom ether readings - also its effects would not have been seen by Wh ee ler and Shaw. Since other abstractions appear to have little effect on the site, the results from Th e equation are considered sufficient for this evaluation.
This small valley floor site is dominated by reeds and saw-sedges with scrub at the edges.
Hopton Fen
The water level monitoring point at Cinque Farm, Market Weston (TL km from the wetland area was used to calculate the parameters for the application of the 10% rule. Calculations of expected drawdown at the wetland site using T h Eq u ation and abstraction rates have been carried out from The N R A license data archive The transm isivity and storage coefficient values used in these calculations are derived from a pump in g test on a borehole at T L km from the wetland).
Its location for this site is uncertain in terms of its classification, as the connection with the u n d e r ly in g C h a lk aq u ifer is uncertain.
Kenninghall & Banham Fens & Quidenham Mere
Kenninghall & Banham Fens & Quidenham Mere
Kenninghall & Banham Fens & Quidenham Mere
The water level monitoring point at Gipsieslaan, Banham (TM08/I04), 0.8 km from the wetland site was used to calculate the parameters for the application of the 10% rule. Calculations of expected withdrawal at the wetland site, using the Theis equation and withdrawal rates from the NRA Licensing Data Archive were performed. The permeability and storage coefficient values used in these calculations were derived from a pump test on a borehole at TM km from the wetland).
It is possible that the value of S derived from the pump test is a kilometer from the site for a limited part of the aquifer - the hygrogeological map of the a r e a is not sufficiently detailed to distinguish the boundary of the aquifer . b oulder clay in this a r e a.
Redgrave & Lopham Fens
Redgrave & Lopham Fens
It was thought that this small range could be due to the influence of the water in the fen, as this monitoring point is very close to the border of the fen. T h e d a t a from the water level monitoring point at Church Way, Redgrave (TM 07/003) was e x a m in e d to see if it gave significantly different values. Calculations of expected abstractions at the wetland site, using the Theis equation and abstraction rates from the NRA Licensing Data Archive were performed.
In 1989, three piezometers were installed: a deep/shallow pair in the fen and a single piezometer in the forest.
Smallburgh Fen
The water level measuring point at Hillfield Estate (TG m from the wetland site) was used to calculate the parameters for the application of the 10% rule. 10% of this is 0.04 m. Calculations of the expected groundwater subsidence at the wetland site, using the Theis equation and withdrawal rates from the NRA permit data archive have been performed. The permeability and storage coefficient values used in these calculations were derived from a borehole pumping test located TG km from the wetland).
The University of Birmingham's water budget placed much greater importance on groundwater discharge throughout the year, but this is inconsistent with the observed annual range of water levels.
Weston Fen
Weston Fen
A water level monitoring point at Cinque Farm, Market Weston (TL97/00I), 1.8 km from the wetland site, was used to calculate the parameters for applying the 10% rule. The transmissivity and storage coefficient values used in these calculations were obtained from a well pumping test at TL km from the wetland). Permitted annual quantity spread over 200 days. Actual return value (average) spread over 200 days. Actual return value (average) spread over 365 days.
As with Hopton Fen, the link between this wetland and the Chalk aquifer is uncertain. The importance of the abstraction rate calculated above for the health of the wetland cannot therefore be determined.
APPENDIX C
Terms of Reference
Anglian Regional Operational Investigation: 558
Project Leader
Dr G Mason
Hydrogeologist, Water Resources, Peterborough Introduction
In order to protect wetland sites and to assist in water resource planning the National Rivers Authority wants to be able to
Define groundwater catchment areas to these wetlands,
Estimate the effects of groundwater abstraction on these catchment areas, 3. Estimate the total groundwater resource required by the wetland
34;user friendly" and readily available for application both inside and outside the NRA (ie
Public Domain software)
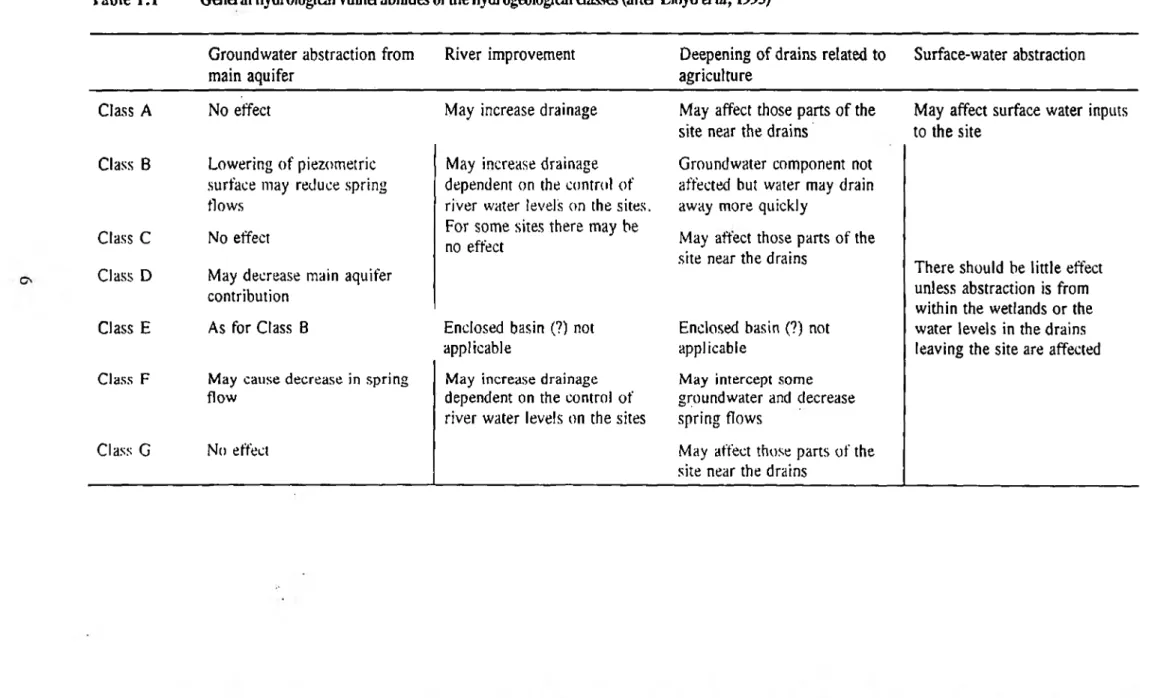
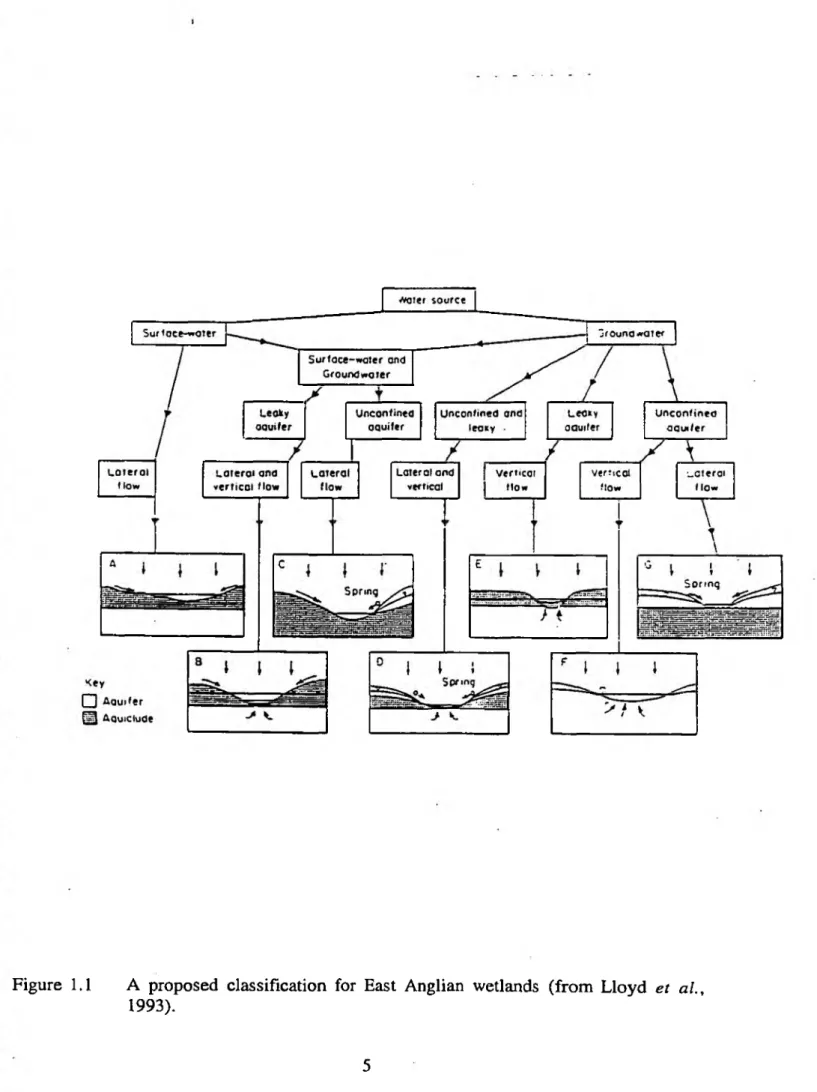
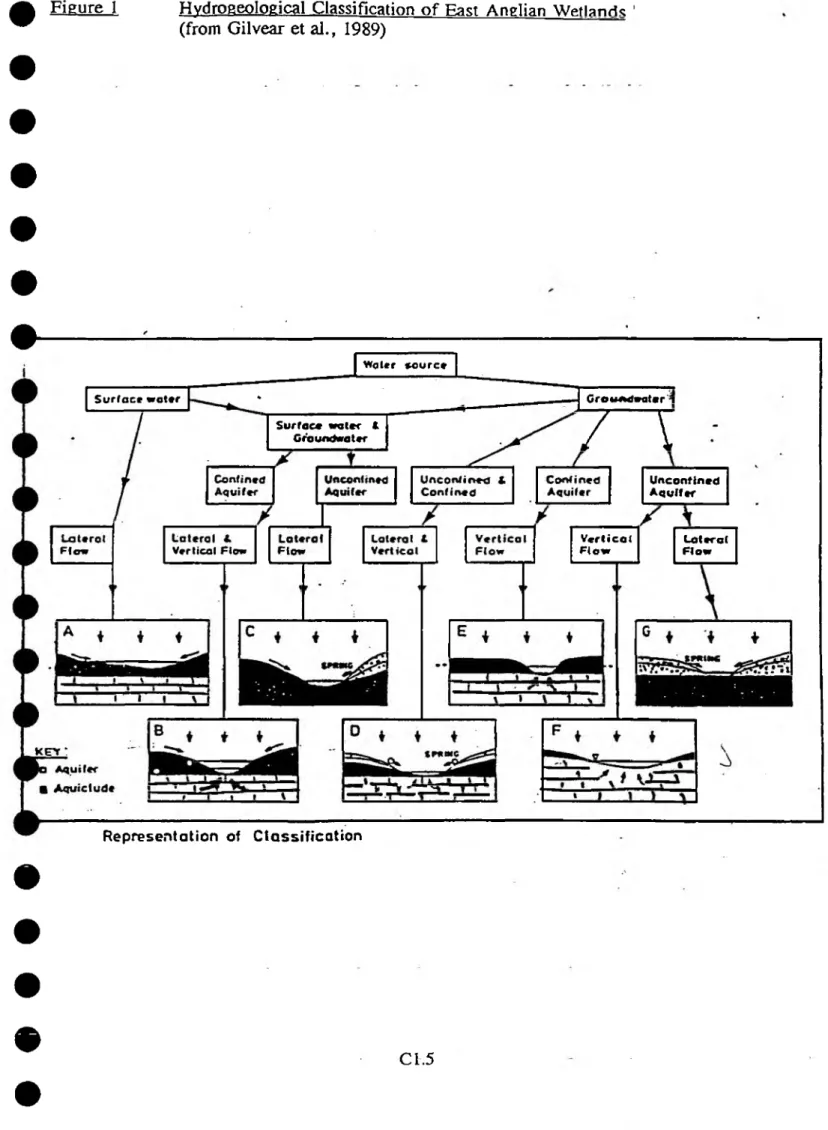
In considering various methodologies, some may be appropriate to particular hydrogeological regimes and not to others. The Wetland Class designations given in the
The Project Objectives are detailed as follows
This wprk will include identification of surface water catchments and the production of water balances to allow a check on the groundwater
Changes in shape, if any, of groundwater catchment areas between years of mean rainfall conditions and those of extreme drought conditions must
Consideration must be given to those methodologies which can be used with the basic data commonly available, and those which would represent
These will include types, frequencies and general locations for such monitoring. Consideration must be given to minimise the costs both to the
Where groundwater abstraction is outside the catchment area there may be direct drawdown effects upon the wetland, or indirect effects where the
A means of assessing minimum wetland requirements in terms of groundwater and surface water inputs, and whatnot, should be considered.
A means of estimating the minimum requirements of the wetlands in terms of groundwater and surface water inputs must be considered, and at what
Water resource planning currently uses assessments which are generally made on a lumped catchment basis using annual average figures. A policy
A review of the work programme to this item will be undertaken at this stage, progression to further work items will be dependent upon satisfactory progress
This work will include the identification of surface water catchments and the production of water balances to provide a check on the groundwater
Water level, well log, hydrological and pump test data for sites in the Central Area will be available to the contractor from the NRA Brampton Office, and in the Eastern Area
Ecological data on the sites and, possibly further reports, can be obtained from English Nature’s Norwich Office
A listing of some available reports is given in Table 3
Outputs Required
Quarterly Progress Reports
The Tenderer is requested to present financial information as specified in Schedule 5 of the Tender Document The Tenderer is requested to specify a suitable timescale for the
UEA = study by University of East Anglia BU = study by University of Birmingham MSc = subject of M.Sc.
Univ. Birmingham;
Birmingham. October 1989
NRA R&D Note 114
University of Birmingham (1987). Hydrodynamics of East Anglian Fen Systems
Final report of Phase I, October 1987
University of Birmingham (1988a). Hydrodynamics of East Anglian Fen Systems
Interim 6 Month Report, Phase II, April 1988
University of Birmingham (1988b). Hydrodynamics of East Anglian Fen Systems
Interim 12 Month Report, Phase II, October 1988
University of Birmingham (1989). Hydrodynamics of East Anglian Fen Systems
Interim 18 Month Report, Phase II, May 1989
Report, March 1991
The primary objective of the simulation studies will be to evaluate and, if necessary, develop the proposed methodology or methodologies for evaluating the effects of groundwater extraction on wetland hydrology. This set should provide adequate coverage of the range of situations likely to be encountered and will be agreed between the NRA and BGS/IH. The aim of this part of the work is to refine the assumptions and estimates made in the Phase 1 methodologies, using data from further wetlands: 9 to 15 wetland areas will be investigated.
In addition, the NRA will be provided with guidance on the implementation of the results of that work and on the wider issues.