North Bristol NHS Trust Operational Plan 2018/19
Final version
(Version 3.2)
Contents
1 Executive Summary ... 4
1.1 Introduction... 4
1.2 Summary of progress against 2017/18 objectives ... 5
1.3 Objectives and priorities for 2018/19 ... 8
1.4 Key planning assumptions ... 10
1.5 Contractual position ... 11
2 Activity Plan ... 13
2.1 Planning assumptions ... 13
2.2 Summary activity plans ... 15
2.3 Capacity plans ... 16
2.4 Risks to delivery ... 18
3 Quality Plan ... 19
3.1 Approach to Quality Improvement ... 19
3.2 Monitoring quality standards ... 19
3.3 Summary of the Quality Improvement Plan ... 22
3.4 Summary of Quality Impact Assessment process ... 25
4 Workforce Plan ... 27
4.1 Workforce planning methodology ... 27
4.2 Workforce efficiency ... 28
4.3 Maintaining a safe and sustainable workforce ... 30
4.4 Workforce transformation ... 31
5 Financial Plan ... 35
5.1 Background & context ... 35
5.2 Financial forecasts and modelling ... 35
5.3 Efficiency savings for 2018/19... 39
5.4 Capital Planning ... 44
6 Link to Sustainability & Transformation Plan (STP) ... 46
Appendix 1 Corporate objectives by strategic theme ... 49
Figure 1 : Inputs to this plan 4
Figure 2 : Model used to determine objectives and priorities 8
Figure 3 : 2018/19 Corporate Objectives 9
Figure 4 : 2018/19 Priorities 9
Figure 5 : 2018/19 activity plan 15
Figure 6 : Quality improvement governance structure 19 Figure 7 : Safety and Patient Experience Improvement Programme structure 22
Figure 8 : Trust QIA process 25
Figure 9 : Financial improvement governance structure (to be agreed) 44
Table 1 : Progress against 2017/18 objectives 5
Table 2 : Progress and achievements in 2017 /18 6
Table 3 : Key risks to the delivery of the operational plan 12
Table 4 : CQC domain improvement 2014 to 2017 21
Table 5 : Safety and Patient Experience priority workstreams 23
Table 6 : 2018/19 bridge analysis 36
Table 7 : Summary of 2018/19 financial plan 38
Table 8 : 2018/19 cash flow plan 39
Table 9 : 2018/19 Capital plan 45
Table 10 : Alignment of STP principles and NBT Strategy 46
Executive Summary
1 Executive Summary 1.1 Introduction
We have a 2-year Operational Plan for the period 2017-19, agreed in February 2017 that builds on our five-year Strategic Plan published in 2016 and is a key output of our annual business planning process. We are now refreshing that plan for the second year of delivery in 2018-19.
The plan sets out how we are going to respond to local and national challenges and continue our improvement journey.
We recognise the size of the challenge we face, but take confidence from the progress made over the last 3 years on our Financial Recovery Plan (FRP), Care Quality Commission (CQC) domain ratings, operational performance improvement and the strategic intent of the Sustainability and Transformation Plan (STP) for Bristol, North Somerset and South Gloucestershire (BNSSG).
We have identified a number of risks that could impact the deliverability of this plan, and have defined actions to mitigate these. The key risks are shown in Section 1.6.
This plan is based on clear and pragmatic assumptions that are summarised in Section 1.4, and defined in more detail in the activity, workforce, quality and finance sections of this plan.
The plan and priorities have been informed by a range of national guidance and best practice, as shown in the figure below.
Figure 1 : Inputs to this plan
NBT 2-year Operational
Plan NBT Financial
Recovery Plan
NBT Directorate
Plans
BNSSG STP NBT Quality
Improvement Programme
NHSI Agency Ceiling Limits
Lord Carter Review NHSE Five Year Forward
View NBT Trust
Strategy 2016 to 2021
NHSI Single Oversight Framework NHSE Nine
Must Do’s
CQC Quality Standards
NHS Constitution
NBT Capital Plan
NHSI Technical Guidance NHS Operational
Planning &
Contracting Guidance
NBT Risk Register
BNSSG CCG Operational
Plan
Control Total
& STF Offer NBT
Workforce Plan
IMAS Capacity and Demand
Model
NBT Integrated Performance
Report
CQC Inspection (Dec 2015)
Contract Negotiation
Process
North Bristol NHS Trust
North Bristol NHS Trust (NBT) is a centre of excellence for health care in the South West, we employ over 8,000 staff and have an annual turnover of £580 million.
67% of our income for patient care comes from the three Clinical Commissioning Groups (CCGS) of Bristol, North Somerset and South Gloucestershire. Most of the remaining 33% comes from NHS England (NHSE) as income received for the specialist services we provide.
Our vision is: “We will realise the great potential of our organisation by empowering our skilled and caring staff to deliver high-quality, financially sustainable services in state-of-the-art facilities. Clinical outcomes will be excellent and with a spirit of openness and candour we will ensure an outstanding experience for our patients.”
Our strapline is: Exceptional healthcare personally delivered Our values are:
1.2 Summary of progress against 2017/18 objectives
The Trust’s operating plan for 2017-19 is designed to deliver on the Trust’s five-year strategy and trust objectives are aligned to the eight themes of the strategy.
Progress made in 2017/18 reflects 2 years in to the 5 year strategy.
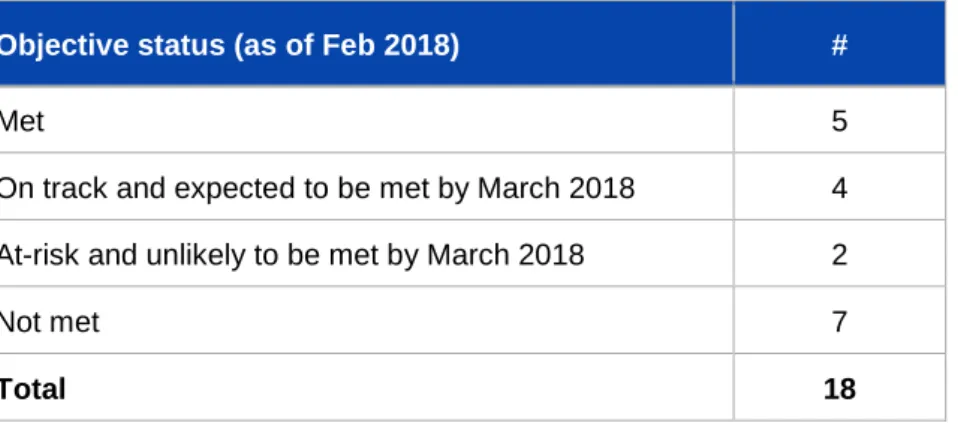
There are 18 objectives for 2017/18
Table 1 : Progress against 2017/18 objectives
Objective status (as of Feb 2018) #
Met 5
On track and expected to be met by March 2018 4 At-risk and unlikely to be met by March 2018 2
Not met 7
Total 18
Executive Summary
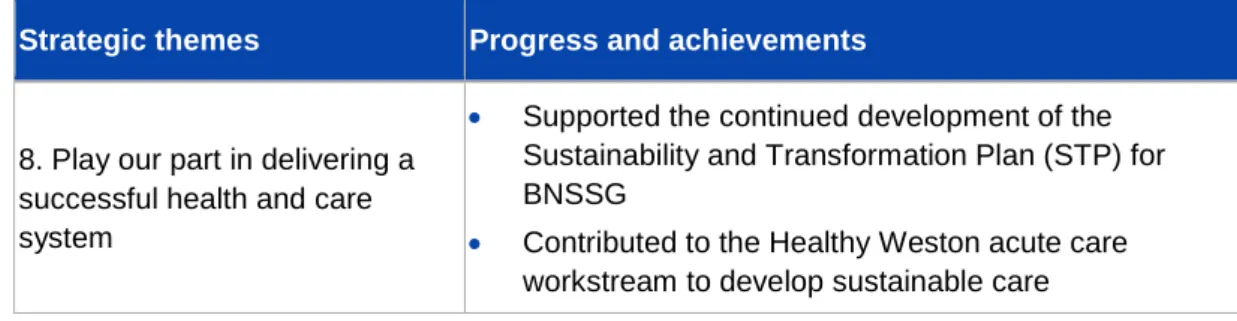
Progress and achievements against each of the eight strategic themes are shown in the table below.
Table 2 : Progress and achievements in 2017 /18
Strategic themes Progress and achievements
1. Change how we deliver services to generate affordable capacity to meet the demands of the future
Financial Recovery Plan continues to be delivered against with - the Trust delivered the Control Total with cost improvement savings of £35.5m delivered.
Increased capacity through working with partners – securing additional community rehabilitation beds in Yate, and additional packages care.
Implemented the Exemplar ward programme and the Red2Green approach- a visual management system to assist in the identification of wasted time in a patient’s journey,
Introduction of two new Local Anaesthetic theatres – creating sufficient capacity to repatriate significant volumes of activity from the independent sector
Secured a reduced elective burden on the inpatient ward beds through implementing a model of care for surgical short stay patients that uses available capacity in our Medirooms
Supporting more patients to return home sooner and receive the care and support they need through the introduction of a hospital at home service which is supporting up to 15 patients in the community at any time
2. Be one of the safest trusts in the UK
100% screening for Sepsis in patients attending ED who needed screening with antibiotics delivered within 1 hour in >90% of cases where Sepsis was diagnosed.
Swarm reviews put in place for all serious incidents ensuring early learning, early implementation of actions and support for patients/families and ward staff.
Over 3000 staff have received Quality Improvement awareness sessions, there are over 150 Improvement projects registered and 150 staff have received detailed QI training sessions.
3. Treat patients as partners in their care
Increased patient involvement in the process of appointment of staff at all levels
Strategic themes Progress and achievements
Established and embedded the work of Patients Complaints Review panel who are influencing change in the quality of complaint investigation and responses
Engaging with people from the Deaf community in order to help improve access our services
Commenced work on Ask 4 Questions to help and support staff, patients and carers in the conversations and the activity of getting ready to leave hospital.
4. Create an exceptional workforce for the future
We are proud to have been the highest ranked trust in Severn Deanery in junior doctor’s survey.
Implemented initiatives to support recruitment including implementing the Trac recruitment system, running joint bank and substantive recruitment campaigns and putting in place an HCA sourcing strategy in preparation for winter.
The Trust has put a number of actions into place to support staff health and wellbeing, including an extended psychological and physiotherapy support for staff.
We are a registered apprenticeship provider with an OFSTED rating of GOOD and we are leading plans across BNSSG to harmonise the approach to apprenticeships.
5. Devolve decision making and empower clinical staff to lead
A leadership coaching programme has been delivered to support the implementation of Service Line
Management (SLM)
6. Maximise the use of technology so that the right information is available for the key decisions
Electronic Document Management Service went live on 1st October and has been rolling out across service areas.
Business Intelligence (BI) has developed a new Outpatient Clinic Efficiency Report to help consultants and managers to review the way their clinics have been set up and to challenge how efficiently they are being used.
Works to enable Free Wi-Fi for new and expecting mums at Southmead Hospital were completed in December 2017
7. Enhance patient care through research
The Research and Innovation Strategy was approved at Trust Board on 27 July 2017.
Executive Summary
Strategic themes Progress and achievements
8. Play our part in delivering a successful health and care system
Supported the continued development of the Sustainability and Transformation Plan (STP) for BNSSG
Contributed to the Healthy Weston acute care workstream to develop sustainable care
1.3 Objectives and priorities for 2018/19
2018/19 will be the third year of the Trust’s five-year strategy and the eight themes of the strategy have continued to inform corporate objectives, divisional plans and our shared priorities, as shown below.
Figure 2 : Model used to determine objectives and priorities
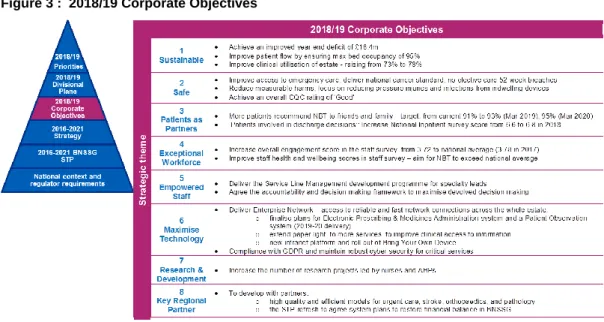
As part of our annual planning process the 2018/19 corporate objectives shown below (further detail in Appendix 1) have been developed with our divisional teams and agreed by the Trust Board. The actions required to deliver these objectives were then defined and used to inform directorate plans.
Figure 3 : 2018/19 Corporate Objectives
For the year ahead, particular emphasis is placed on the 3 priority objectives identified below. These are both crucial for the overall performance as well as being the most challenging to deliver on. The NBT Board’s main focus will be on delivering these 3 priorities in 2018/19.
Figure 4 : 2018/19 Priorities
Critical to success is the continued pace and scale of change to be delivered by the Sustainability and Transformation Partnership and we will continue to work with our system partners to design and implement a sustainable model of health and social care across BNSSG - examples of where we are already leading this work are included in section 6.
Executive Summary
1.4 Key planning assumptions
Below are the key planning assumptions used to develop this plan. Further detail on the assumptions used can be found in the relevant section.
Activity assumptions
We have applied an overall 2.7% non-elective growth assumption with 4.4%
non-elective inpatient growth (8.2% in medicine specialties) and 0.6% non- elective short stay growth from 2017/18 to 2018/19.
A&E attendances growth assumption is 1.8%
We have applied 6.4% elective growth assumption to inpatient activity and 4.8%
to day case activity from 2017/18 to 2018/19.
The activity plans submitted are based on the full list of assumptions listed in section 2 and will deliver the recovery trajectories against the key national standards for A&E, Incomplete RTT, Cancer and Diagnostics.
Quality assumptions
We will use our established quality governance structure and Quality Impact Assessment (QIA) process to support the implementation of our FRP and track the impact of our Safety and Patient Experience programme
The objective to be one of the safest trusts in the UK and treat patients as partners in their care will be driven by our quality improvement programme
We will use our Quality & Safety Improvement Team and Quality Improvement Faculty to continue to develop our internal quality improvement capacity and capability and through the STP we will continue to work with the AHSN to design and adopt a system-wide methodology for quality improvement.
Workforce assumptions
Financial Recovery Plan (FRP) workforce efficiency programme is targeting a 3% (£9.5m) reduction in pay costs from April 2018
The Whole Time Equivalent (WTE) reduction that constitutes part of the 3% will be reflected in both a reduction in current staff in post (through turnover) and a reduction in temporary staffing (current vacancy posts backfill)
We have assumed no redundancies – reductions in funded posts will be achieved through turnover and existing vacancies
We have plans to improve retention of staff and reduce annual turnover from 16.6% to 13.1%for 2018/19, and to reduce sickness rates from 4.4% to 4% in 2018/19.
We will continue our STP leadership role for the development of new roles and support the move towards a shared recruitment strategy and collaborative working on apprenticeships
We will continue to work with our commissioners to find a sustainable funding model that will enable us to deliver on the four priority standards for seven-day hospital services
Finance assumptions
The Trust accepted the 2017/18 control total of £18.751m (£32.4m excl Sustainability and Transformation Funding (STF)) and has delivered in line with plan although by non-recurrent means.
In 2018/19 the plan assumes that the Trust accepts the control total of
£18.383m.
Pay inflation assumes 1% pay award and increment for all eligible staff which for NBT is £0.8m higher than national assumptions funded in tariff;
Clinical Negligence Scheme for Trusts (CNST) premium as notified by the NHS Litigation Authority which represents a 40% increase over 2017/18 and a £2m pressure above that allowed in the tariff.
£16.176m of STF will be received by the Trust in 2018/19, an increase of
£2.539m above 2017/18.
Delivery of 80% of CQUIN schemes in 2018/19 as well as receipt of the 1%
related to STP engagement.
1.5 Contractual position
In 2017/18 The Trust agreed 2-year contracts with commissioners, in accordance with national guidance. For 2018/19, we are refreshing the key assumptions and schedules that form the core of our contract with commissioners. These include the actual contract value, indicative activity plans, information requirements including data quality improvement, the service development improvement plan and relevant CQUINs.
The Trust’s activity plan is based on M9 2017/18 activity forecast to year end, with adjustment made for expected demand led growth. The growth assumptions build on the capacity and demand modelling undertaken by the operational directorates with, for example elective growth based on IMAS modelling and non-elective growth based on historical trends. The Trust and Commissioners have reconciled their indicative activity and finance assumptions, including adjustments for service changes, seasonality and tariff impact. The Trust’s contracts are fully PbR (Payment by Results) compliant and therefore the Trust will be reimbursed for all activity undertaken in line with national rules and guidance. The impact of the activity plan supports the delivery of the constitutional performance standards and national planning assumptions. Key risks to the delivery of this plan
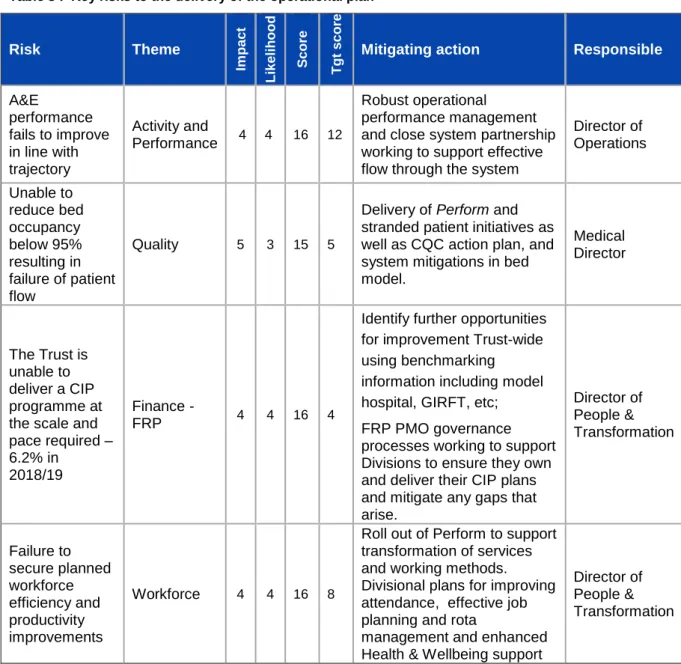
The table below shows the key risks to the delivery of this plan. The complete risk log is appended to the Operating Plan.
Executive Summary
Table 3 : Key risks to the delivery of the operational plan
Risk Theme
Impact Likelihood Score Tgt score
Mitigating action Responsible
A&E
performance fails to improve in line with trajectory
Activity and
Performance 4 4 16 12
Robust operational performance management and close system partnership working to support effective flow through the system
Director of Operations
Unable to reduce bed occupancy below 95%
resulting in failure of patient flow
Quality 5 3 15 5
Delivery of Perform and stranded patient initiatives as well as CQC action plan, and system mitigations in bed model.
Medical Director
The Trust is unable to deliver a CIP programme at the scale and pace required – 6.2% in
2018/19
Finance -
FRP 4 4 16 4
Identify further opportunities for improvement Trust-wide using benchmarking information including model hospital, GIRFT, etc;
FRP PMO governance processes working to support Divisions to ensure they own and deliver their CIP plans and mitigate any gaps that arise.
Director of People &
Transformation
Failure to secure planned workforce efficiency and productivity improvements
Workforce 4 4 16 8
Roll out of Perform to support transformation of services and working methods.
Divisional plans for improving attendance, effective job planning and rota
management and enhanced Health & Wellbeing support
Director of People &
Transformation
2 Activity Plan
2.1 Planning assumptions
We have applied a robust capacity and demand planning process, based on:
12-months of demand data (3 October 2016 to 1 October 2017).
Outputs of the NHS Improvement’s Demand and Capacity modelling tools for Outpatient, Inpatient and Diagnostic activity, as required in the planning guidance.
Our activity plans are based on the following assumptions:
Non-elective planning assumptions
2.7% non-elective growth assumption for the Trust overall, which consists of:
o 4.4% growth in non-elective inpatients with a length of stay (LoS) greater than 48 hours.
o 0.6% growth in short stay (less than 48hrs) non-elective inpatients.
Within the Trust, the most significant non-elective inpatient growth is within medicine where 8.2% growth across the year has been forecast based on the past 2 years’ experience. An additional 50 stroke thrombectomy cases as agreed with commissioners.
The planning guidance requires zero LoS activity to be split out from non- elective short-stay activity. Non-elective short-stay activity, which is >1 day will now be combined with the non-elective inpatient activity. Business Intelligence reporting is being developed to meet this new requirement.
1.9% growth overall in ED attendances – increase in majors (+4.7%) and reduction in minors (-2.0%).
NBT’s 2018/19 A&E improvement trajectory has been set with percentage improvements allocated against the key drivers of underperformance in 2017/18 based on internal and system recovery plans. As such, the Trust will not be compliant with the national ED standard for the year instead averaging performance of 85.18%.
For non-elective maternity there is no assumed growth above forecasted activity in 2017/18. In partnership with South Gloucestershire public health team we are developing modelling capacity for maternity activity which will inform 2019/20 planning and will improve how we take into account demographics, market share and seasonality factors in forecasting demand.
The impact of STP plans for the transformation of stroke, spines and fractured neck of femur (NOF) across BNSSG continue to be developed and will be accounted for in line with implementation plans.
Activity Plan
Patients, who no longer require acute care, should be managed in the community for rehabilitation. In 2018/19 onwards we will work with commissioners to secure the additional community capacity required to achieve this.
Elective planning assumptions
In line with planning guidance, our elective plans are to maintain the RTT waiting list at March 2018 levels (both non-recurrent backlog and under 18 week waiting list) and address >52 week waiters to ensure there are zero breaches in 2018/19.
Elective inpatient growth at Trust level is planned at 6.4% and elective day case growth is planned at 4.8%. In total, Elective admissions are planned to grow by 5.1% in comparison to the national planning guidance of 3.6%.
Our plans for elective care have taken into account the impact of winter where there is scope for adjusting the profile of work (the balance between inpatient and day-case work) without impacting on the quality of care for patients, and as such we are able to release some elective bed-capacity in our plans to meet the additional winter non-elective demand.
Outpatient activity has been planned to ensure elective waiting times are maintained and improved, such that the overall waiting list does not increase in the year to March 2019. As such, new outpatient appointments are planned to grow by 1.9% and outpatient follow-ups are planned to grow by 3.5%.
Outpatient procedures are planned to grow by 2.1%. In total, Outpatient attendances are planned to grow by 2.9% in comparison to the national planning guidance of 4.9%.
Opportunities to address clinical variation and improve the value of outpatient follow up activity are being considered across the BNSSG system and are expected to reduce the volume of outpatient appointments, particularly follow- ups. As this work has not concluded, no activity assumptions have yet been made to reflect changes to new and follow-up outpatient models.
The impact of Quality, Innovation, Productivity and Prevention (QIPP) is not yet understood and is under discussion with Commissioners, and has therefore been excluded from our plans.
NBT is contributing to system-wide working via STP working groups and CCG Control Centres. Specifically, NBT is contributing to system workstreams on urgent care, LoS, outpatients and mental health investment, as part of the planning process.
Commissioning for Quality and Innovation (CQUIN) priorities will be incorporated in activity plans, should there be any impact, once these have been agreed with our commissioners.
Critical Care
Plans assume that there will continue to be 46 core ICU beds in 2018/19.
Neurosurgery High Dependency Unit has allowed for growth of 2 additional High Dependency patients / 4 more High Observation beds, which equates to 26%
growth.
Respiratory High Dependency Unit assumed 0% growth above forecast outturn.
The use of flexible capacity (such as waiting list initiatives that may include additional clinics or surgical lists) to both sustain and deliver improvements across all specialties are included in the capacity assumptions.
The activity plans submitted based on the above assumptions, will deliver the recovery trajectories against the key national standards for A&E, Incomplete RTT, Cancer and Diagnostics.
Cancer care
The Trust is fully engaged with the Somerset, Wiltshire, Avon and Gloucestershire Cancer Alliance Cancer Transformation and 62 day improvement initiatives for 2018-2020. These include;
Implementation of straight to CT following suspicious chest X-Ray for patients suspected of Lung Cancer.
Implementation of the FIT test in the no risk, not no risk category of patients with bowel cancer - a go live date of June has been set for the implementation of the FIT test
Expansion of the Living With and Beyond Cancer Project- required staff will have been recruited by June 2018
Implementation of the best practice Prostate Pathway - the additional capacity required will be available from early June
The Trust is forecasting a challenging first quarter for performance against the 62 day standard for 2018/2019. This is mainly due to ongoing issues in Urology and the Prostate pathway. The delivery of the Urology Sustainability Plan alongside the full implementation of the new best practice prostate pathway will increase performance through Q2 and provide sustainability for the rest of the year.
2.2 Summary activity plans
The table below shows a summary of our 2018/19 activity plan
Figure 5 : 2018/19 activity plan
Activity lines FOT1 17/18 18/19 plan % change
1 The forecast activity has been adjusted for service changes to reflect the underlying activity for 2017/18.
Activity Plan
Activity lines FOT1 17/18 18/19 plan % change
First Outpatient attendances 132,068 134,612 1.9%
Follow up outpatient attendances 253,934 262,760 3.5%
Total elective admissions (ordinary admissions and day cases) (Specific Acute)
60,224 63,311 5.1%
Total non-elective admissions (Specific Acute)
57,994 59,580 2.7%
Total A&E attendances 86,372 87,971 1.9%
2.3 Capacity plans
Theatre, outpatient and bed capacity plans have been developed alongside the activity plans to model the profile of activity against available capacity throughout the year, taking into account known seasonal pressures.
Theatre capacity
We are confident that there is sufficient capacity in theatres to meet the requirements of planned activity, reflecting work commenced in 2017/18 to improve theatre utilisation and increase capacity within the Brunel facility, for example, investment in additional local anaesthetic procedure rooms. The Theatre Programme in 2018/19 will support the delivery of 131 cases per day through improvements in list uptake (2018/19 target 98%), list efficiencies (2018/19 target 80%) and 5% efficiency improvement on day case activity.
Outpatient capacity
Divisions are confident that there is sufficient capacity in outpatients to meet the requirements of planned activity, reflecting work that commenced in 2017/18 to improve outpatient utilisation and increase efficiency. In 2018/19 there are further opportunities relating to the delivery of outpatient activity and improving overall efficiency including:
Session uptake and in-session utilisation.
DNA rates.
Implementation of partial booking.
BNSSG task and finish group.
New to follow-up ratios.
Advice and guidance.
Patient Initiated Follow-up (PIFU)
Non-face-to-face.
Clinical review of overdue follow-ups.
Reduction in non-GP referrals.
e-Referral service.
The outpatient programme in 2018/19 will support the delivery of 2,040 new outpatient attendances and 5,056 follow-up outpatient attendances per week.
Bed capacity
Our assessment of bed capacity demonstrates that without changes there will be ongoing excess bed requirements above sustainable levels throughout the year.
In 2017/18, the Trust has at times been operating for sustained periods at above 100% occupancy through the utilisation of escalation capacity. This situation has put immense strain on staff and has resulted in additional costs being incurred, which is not sustainable. The Trust is therefore planning to deliver maximum bed occupancy of 95% in 2018/19, with an ambition to deliver 92% bed occupancy in 2019/20. In order to develop a capacity plan that secures 95% bed occupancy a number of assumptions have been made:
Assumptions:
Based on final elective and non-elective activity and profiling from the 2018/19 Divisional Activity Plans.
Non-elective activity has been split between inpatient and short stay to more accurately reflect activity through the bed base. LoS and variation at specialty level have been reflected where applicable.
Average LoS is as per 2017/18 actual at Dec 17 year to date.
That zero LoS activity can continue to be managed within current capacity (i.e.
Acute Medical Unit (AMU) Ambulatory Care, Respiratory Hot Clinics, AMU zero LoS and Surgical Assessment Unit (SAU)).
The core bed base capacity includes the use of Medirooms (18) and Procedure Rooms in relevant wards (26 including the 4 extra beds in each of the Elgar Wards).
Through benchmarking against other similar organisations and reviewing patient pathways in our hospital, mitigation schemes have been developed to reduce bed capacity requirements, whilst continuing to provide excellent and safe care for patients.
The Trust bed model forecasts bed deficits of across quarter 3 and 4 of between 38 beds and 167 beds at 95% occupancy (peak deficit in January 2019). Mitigations to address the bed gap are being developed internally and as part of system wide plans to meet the BNSSG system goals of containing non-elective growth to half the rate expected for 2018-19 and to embed a “no-delays” culture throughout patient
Activity Plan
pathways. The mitigation plans encompass themes identified from Multi Agency Discharge Events (MADE) and learning from other systems with a proven record of delivery that can be implemented by October 2018.
The system has allocated funds to invest in new schemes through both the STP and the Bristol Better Care Fund. Decisions will be made mid-May on funding in order to have sufficient time to implement changes ahead of winter. The BNSSG urgent care recovery plan will be shared with regulators in May. A quarter one review of the bed model and winter plan will be shared with the Board to provide assurance on the bed-capacity plans.
A winter review from 2017/18 has been undertaken, engaging with both staff and external partners. The learning from these exercises are being incorporated into the Trust’s final winter plan. The Trust’s activity is profile reflects seasonal non-elective pressures and plans to reduce in-patient elective work in quarter four.
2.4 Risks to delivery
The following is a list of risks to delivery:
Growth estimates are either too high, which will impact on income or too low, which will impact on capacity.
Deliverability of elective activity plans through the winter due to impact of seasonal pressures resulting in beds being utilised for non-elective activity. This risk will be further mitigated as the capacity plans are further developed and implemented.
Productivity gains and changes to the workforce assumed in the planning are not achieved.
3 Quality Plan
3.1 Approach to Quality Improvement
Governance structure
The named executive leads accountable for quality improvement at NBT are the Medical Director (safety and clinical effectiveness) and Director of Nursing (patient experience).
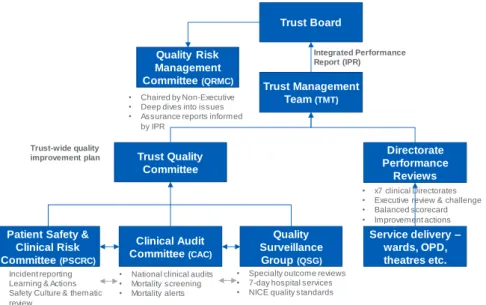
Figure 6 : Quality improvement governance structure
The Deputy Medical Director, Associate Medical Director for Safe Care, Quality and Safety and the Head of Patient Experience are responsible for leading the quality improvement programme. The governance structure to support delivery of the quality improvement plan is shown in the figure above.
3.2 Monitoring quality standards
Trust Board assurance is through the quality section of the Integrated Performance Report (IPR) which reflects the quality priorities described in this business plan and the Trust’s Quality Account. The IPR is published monthly and includes the following quality data:
Patient Safety Dashboard: Incident reporting including Never Events, Safety Thermometer, Nutrition screening, falls, pressure ulcers, WHO checklist, infection control, VTE risk assessments and medication errors.
Safe Staffing: QUESTT Early Warning Trigger Tool, Acuity/dependency, staffing ratios, bank/agency fill rates & recruitment profile.
Clinical Effectiveness: Mortality & Learning From Deaths & national audit.
Patient Experience: Friends & Family Test, specific comments, complaints, concerns & compliments.
Trust Board
Trust Management Team (TMT)
Trust Quality Committee
Quality Risk Management Committee (QRMC)
Quality Surveillance
Group (QSG) Clinical Audit
Committee (CAC)
Directorate Performance
Reviews
• National clinical audits
• Mortality screening
• Mortality alerts
• x7 clinical Directorates
• Executive review & challenge
• Balanced scorecard
• Improvement actions
• Specialty outcome reviews
• 7-day hospital services
• NICE quality standards
• Chaired by Non-Executive
• Deep dives into issues
• Assurance reports informed by IPR
Trust-wide quality improvement plan
Integrated Performance Report (IPR)
Service delivery – wards, OPD, theatres etc.
Patient Safety &
Clinical Risk Committee (PSCRC)
• Incident reporting
• Learning & Actions
• Safety Culture & thematic review
Quality Plan
Well Led: Staffing turnover, temporary staffing requests and fill rate, safe staffing compliance, recruitment activity, rostering effectiveness, sickness absence (short & long term), mandatory training & appraisal compliance.
CQC Inspection – outcomes & action delivery.
CQUIN Delivery – overall progress & forecast outcomes for the year.
Narrative within the IPR itself provides an overview of specific improvement actions and the Trust Board minutes demonstrate the debate this generates and follow through of key actions.
The Board undertakes detailed scrutiny of the quality of service delivery through the Quality and Risk Management sub-committee. We will be publishing a Quality Account by 30 June 2018 which will provide the detail regarding the quality of clinical services during 17/18.
The Trust Management Team (TMT) drives improvements in the quality of service provision through its Quality sub-committee, chaired by the Medical Director.
Individual clinical divisions have their own clinical oversight and improvement process in place.
Addressing Care Quality Commission (CQC) actions
Progress against actions resulting from Care Quality Committee (CQC) inspections are included in the Integrated Performance Report (IPR) and reported to Trust Board, Quality Committee and Quality Risk Management Committee.
The Trust was inspected by the CQC in November 2017, the first inspection under the new CQC approach comprising an unannounced review of clinical service lines and a subsequent planned review of the corporate aspects of the ‘Well Led’ domain.
To support the journey towards an overall CQC rating of good, the Trust also uses its internal auditors (KPMG) to provide independent assurance that all actions relating to the CQC domains have been fully implemented. The Trust will compile a comprehensive Action Plan to address the issues identified and report to the CQC by the submission deadline of 19th April 2018.
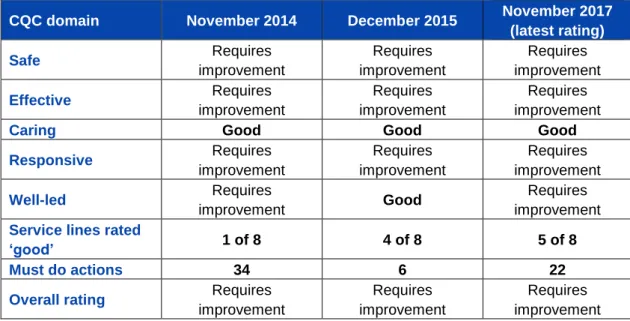
Table 4 : CQC domain improvement 2014 to 2017
CQC domain November 2014 December 2015 November 2017 (latest rating)
Safe Requires
improvement
Requires improvement
Requires improvement
Effective Requires
improvement
Requires improvement
Requires improvement
Caring Good Good Good
Responsive Requires
improvement
Requires improvement
Requires improvement
Well-led Requires
improvement Good Requires
improvement Service lines rated
‘good’ 1 of 8 4 of 8 5 of 8
Must do actions 34 6 22
Overall rating Requires improvement
Requires improvement
Requires improvement
Improvement methodology
Quality improvement projects are implemented using established methodologies, including, but not limited to, stakeholder engagement, process mapping, driver diagrams, experienced based co-design, Appreciative Inquiry and rapid improvement events. However, the primary methodology used for the majority of improvement workstreams is the Model for Improvement with Plan Do Study Act (PDSA).
As defined in the STP we are continuing to work successfully with the Academic Health Science Network (AHSN), and our provider partners to support a BNSSG system-wide methodology for quality improvement.
The Trust has two approaches to build in-house improvement capacity and capability:
1. The Quality & Safety Improvement Team (QSIT) – that provides educational session in improvement science and human factors as well as coaching support to front line individuals and teams. This team work in the system as well as on the system and increase the number of staff able to lead on and be involved in quality improvement work.
2. The Quality Improvement Network (QIN) formed of staff skilled in patient safety, quality improvement, human factors, organisational development and innovation to drive the quality agenda and strategy.
The QSIT and QIF are supported within the clinical governance directorate to define appropriate measures for improvement and provide analytical expertise to demonstrate where changes have led to improvement. Examples of this work include the ED checklist (NBT were part of the team who won the 2017 HSJ Patient Safety Award 'Best Patient Safety Initiative in A&E), NBT achieving Exemplar VTE centre, Positive Incident Management in ICU, the Emergency Laparotomy
Quality Plan
collaborative and Cholecystectomy Quality Improvement Collaborative of which NBT is has been commended.
3.3 Summary of the Quality Improvement Plan
The Trust sets Quality Priorities each year within the context of the overarching Trust strategy and as part of the Quality Account consultation with stakeholders.
STP alignment is achieved through executive level engagement with the detailed plans and the contribution NBT plays in their delivery. The draft Quality Priorities for 2018-19, subject to Quality Committee and then Trust Board approval are;
1. Eliminate delays in hospital to improve patient safety and reduce bed occupancy (‘home is best’).
2. Enhance the way patient involvement and feedback is used to influence care and service development.
3. Continue improving the quality of end of life care across all specialities.
4. Strengthen learning & action by embedding quality governance at specialty, cluster and divisional level.
5. Demonstrate a stronger clinical understanding and application of the Mental Capacity Act and Deprivation of Liberty Standards.
The figure below shows how our quality improvement programmes (safety and patient experience), supports these priorities and feeds into our quality improvement governance process. The programme’s priorities are further informed through local commissioning intentions, including CQUIN schemes, internal risk assessment (incident reporting, complaints and risk registers), regulatory actions and staff engagement.
Figure 7 : Safety and Patient Experience Improvement Programme structure
Our quality improvement plan aligns with the Trust Strategy, for example:
Trust Quality Committee
Safeguarding Committee Clinical Audit
Committee/ Quality Surveillance Group
Trust-wide quality improvement plan
Control of Infection Committee
Patient Experience Group
1. Enabling Improvement
Capability
2. Safe Wards 3. Safe Emergency Care
4. Safe Operating Theatres
5. Build the Safety Culture
1. Culture &
Operational Processes
2. Learning &
Improving
3. Patients as partners
4. Linking Staff &
Patient Experience
Safety programme Patient Experience Programme Governance route
Key:
Safety Programme Patient Experience Programme
Enablers: Engagement, training, governance, delivery resource, IT, volunteer
6. Safe Staffing
Trust Board
Patient Safety &
Clinical Risk Committee (PSCRC)
As part of theme 2, to be one of the safest trusts in the UK, we will maintain our HSMR rate below 100 and ensure the quality improvement governance process is developed to incorporate continuous learning into our safety programme, supported by robust measurement.
Theme 3, patients as partners in their care, forms part of our Patient Experience programme. We will continue to apply shared decision-making across the Trust, building on our Ask 3 Questions initiative, continue to support the Patients as Leaders programme, developing the pan-Bristol healthcare change-makers forum in partnership with UH Bristol Foundation Trust, Bristol Community Health, NHS England and the Kings Fund, will broaden the current complaints training programme and increase the pace of resolution within agreed timescales.
As part of theme 5, devolve decision making and empower front-line staff, we will enable and empower our clinical leadership teams so they are both supported and held to account for quality, safety and patient experience, which includes the embedding and benefits realisation of the Datix patient safety &
learning system implementation and also the new ward audit system, Synbiotics.
The table below shows the focus areas of the programme. These areas are informed by national, local and commissioner priorities, CQUIN schemes, risk registers, learning from incidents, complaints, risk assessments, CQC inspections and the National Patient Survey Programme.
Table 5 : Safety and Patient Experience priority workstreams
Programme Workstream Focus areas
Safety
1. Enabling Improvement Capability
The Quality Improvement Team that provides educational sessions in improvement science and human factors as well as coaching support to front line individuals and teams. This team work in the system as well as on the system and increase the number of staff able to lead on and be involved in quality improvement work. The Quality Improvement Network (QIN) formed of staff skilled in patient safety, quality improvement, human factors, organisational development and innovation to drive quality agenda and strategy.
2. Safe Wards
QI team supported workstreams in Falls, medicines, Pressure Ulcers, Deterioration (Sepsis, AKI, NEWS, Fluids), Safe Indwelling devices, Safe Handover &
Discharge, Care Bundles, Ward/Board rounds, Safety Thermometer & Back to the Floor, End of Life Care, Insulin Safety – with regular huddles and improvement plans.
3. Safe
Emergency Care
Emergency Checklist, ED Quality Standards, Care Bundles
4. Safe Operating Theatres
Peri-Operative Care, NatSSIPS, Emergency Laparotomy, Chole-QuIC, WHO Checklist 5. Build the
Safety Culture
Schwartz Rounds, spreading PIMS to other areas, learning from incidents/complaints, Culture survey,
Quality Plan
Programme Workstream Focus areas
Leadership walk rounds
6. Safe Staffing
Led by the Deputy Director of Nursing with direct Board reporting via the Integrated Performance Report and twice yearly safe staffing Board reports:
Acuity/dependency, staffing levels, bank/agency, enhanced care, care hours/patient day
Patient Experience
1. Culture &
Operating Processes
Training and supporting staff in the process of managing resolving and learning from concerns and complaints arising by our patients /carers
2. Learning &
Improving
FFT response rates improved & ‘ % Recommend as place to receive care ; National survey – improve thematic review & outcomes; support improvements in Maternity Survey outcomes, quality & timely complaint handling; Improve carer feedback & experience
3. Patients as Partners
Embed and spread the shared decision-making model of
‘Ask 3 Questions within the context of the safe discharge programme; Review & strengthen the Trust’s approach to patient consent for treatment; Review & improve patient experience; strengthen patient & volunteer partnerships, improving care and service development, including pan-Bristol Healthcare Change-Maker forum.
4. Linking staff and patient experience
Continue the embedding of Schwartz Rounds, Continue training for staff on management and resolution of concerns and complaints: Combine reporting – staff &
patient FFT; enhance iCARE training.
The Quality Strategy will be refreshed and approved by the Quality Committee in mid-2018/19 taking account of the final CQC report, received in early March 2018 and the GE Healthcare Clinical Governance review also finalised in early March 2018. The outcomes of both will be reviewed through the Trust’s Quality Committee and delivery priorities agreed through the Clinical Divisions and supported by the Clinical Governance team. This improvement programme will identify the Key Performance Indicators (KPIs) that will be used to track progress and ongoing assurance of delivery. This will include a cross-check of the objectives of the safety and patient experience workstreams listed above and current KPIs tracked via the Trusts Integrated Performance Report to identify any reporting gaps.
7-day hospital services
The trust recognises the importance of providing safe care 7 days per week. The audit data demonstrates that there is good access to diagnostics services 7 days per week. In recent years the Trust has increased the level of consultant presence onsite on weekends and this is demonstrated in the audit information. There remain some gaps for senior review at weekends. There is no evidence that this is
impacting safe care. However, the Trust recognises that by improving weekend staffing there will be benefits for patient flow.
We have engaged proactively with the NHS Improvement and NHS England regional leads for this workstream and participated in the national event held in September 2017. Divisional engagement in the audit and subsequent actions is now strong and will drive improvement.
Commissioners have been unable to fund beyond tariff for seven day working in 2017/18 or to approve Trust investment proposals which will constrain the rate of improvement.
3.4 Summary of Quality Impact Assessment process
The Trust applies the Quality Impact Assessment (QIA) process shown here to all Financial Recovery Programme (FRP) initiatives relating to pay, and all non-pay initiatives.
Figure 8 : Trust QIA process
The QIA is based on the National Quality Board guidance and covers the following areas:
1. Impact on safety.
2. Impact on patient experience.
3. Impact on clinical outcomes.
4. Impact on access to services and waiting times.
5. Impact on equality and diversity.
All QIA’s are created within the respective clinical divisions or corporate directorates and with effective clinical engagement to inform their development before sign off by the Directorate Management Team. The schemes are then reviewed and approved by the Medical Director and Director of Nursing. Non Pay schemes are managed
Quality Plan
through the Clinical Non Pay Group, which will report to the Trust’s Quality Committee on any changes that impact quality (e.g. changes of supplier or product).
QIAs include identification of key performance metrics to identify potential impact on patient care and these are monitored through the appropriate governance route. The overall Performance Assurance Framework identifies any impact of CIP schemes, including the cumulative impact of several schemes, at divisional level and Trust level via the Integrated Performance Report. This report includes run charts and trend analysis to ensure performance changes are identified and responded to appropriately
In addition, a risk assessment is completed for every FRP initiative and the Trust’s Risk Management Policy is applied. The risk profile of the FRP is reviewed by the Quality and Risk Management Committee (QRMC). A fortnightly report tracks the number of QIAs requested and signed off.
Commissioners have been unable to fund beyond tariff for seven day working in 2017/18 or to approve Trust investment proposals which will constrain the rate of improvement. Notwithstanding that overall position, the Trust has, where feasible, made adjustments in its service model to enhance seven day services, for example the substantive appointment to 2 WTE palliative care consultant vacancies to ensure a full 24/7 service (partly through on call telephone advice) and the creation of a dedicated middle grade on call rota for vascular services to ensure earlier specialist review and intervention every day of the week.
4 Workforce Plan
4.1 Workforce planning methodology
NBT has an established workforce planning cycle that is aligned to:
Our annual business planning process – that triangulates clinical divisional and corporate directorate workforce plans with financial plans, activity plans and quality standards to ensure workforce plans are affordable, safe and sustainable.
The Trust strategy – specifically theme 4: Creating an exceptional workforce for the future and theme 5: Devolve decision making and empower frontline staff to lead.
Cross BNSSG STP workstreams.
The outputs from these three elements have been used to develop an organisational development road-map that continues the progress of the key areas of focus identified for 2017/18 into 2018/19. This includes, but is not limited to:
Enabling and empowering our clinical leadership teams at all levels.
Continuing to support the implementation of SLM through development of our leadership across the Trust and the key foundations for effective devolved decision making.
Accelerate the progress Divisions have made to improve staff engagement, retention, well-being and responsiveness.
Improving the percentage of staff who receive a meaningful annual appraisal and development review - we are currently reviewing our appraisal process against the implementation of SLM.
Reviewing core training by role and requirement (statutory, mandatory and patient safety) to reduce unnecessary back-fill costs by:
o Promoting the use of training passports across BNSSG organisations.
o Removing duplication e.g. through the recruit to pay workstream.
o Continuing to build on our success with virtual learning where appropriate - 50% of update training is now delivered through e- Learning.
Underpinning our approach with a clear focus on the diversity of our workforce.
Workforce Plan
The Director of People & Transformation is accountable to the Board for delivery of the people plan and the reporting and performance of associated workforce key performance indicators (KPIs).
A Workforce Committee, chaired by a Non-Executive Director, provides strategic oversight of the people plan and monitors delivery against target.
4.2 Workforce efficiency
As part of our on-going transformation and cost improvement programmes we have reviewed the focus of the established Workforce Efficiency Programme against our approach to SLM, to have a specific focus on those organisational wide schemes that can increase productivity and efficiency for our clinical divisions. As a result, priority workstreams for 2018/19 will be:
Optimisation of the e-rostering system to improve performance of the e- roster system and user experience, expanding the new system to new users and staff groups and exploring the use of system analytics – for internal and external benchmarking and proactive rota management.
Electronic Staff Record (ESR), based on a review of current against potential functionality and the associated benefits available, with a focus on improved efficiency/productivity for line managers and staff e.g.
through self-service.
Continued reduction of the demand and cost of temporary staffing, underpinned by robust healthcare analytics, linked to effective workforce/resource planning. To include a review of junior doctors rotas to improve the staff experience and wellbeing of our doctors and ensure our rotas are filled by appropriately skilled staff.
These revised workstreams report to the refreshed Workforce Efficiency Programme Board chaired by the Deputy Director of People and supported by the Director of PMO and the Workforce Development Manager.
The efficiency workstreams are working alongside business as usual priorities for clinical divisions that will enable the Trust’s progress to financial stability by supporting the identification and implementation of cost improvement schemes. These are targeted to deliver a 3% reduction in workforce spend and budget reduction by year end, therefore delivering full year effect savings in 2018/19.
The 3% target was informed by large acute benchmarking (although limited opportunity was noted against the Model Hospital), Lord Carter review and STP plans around back office services and acute care collaboration.
These priorities include improving retention and increasing the wellbeing of our staff, which in turn will reduce sickness absence. The clinical divisions are
supported centrally in the delivery of these priorities through the wider People
& Transformation directorate and other corporate teams.
As at December 2017, the Trust had identified £4.8m against an indicative target of £9.5m of savings (3% target), to be implemented by 31st March 2018.
We acknowledge that delivering a recurrent 3% reduction in pay cost on top of recurrent savings made to date is a substantial challenge for the organisation, particularly given the significant achievements already delivered as part of the financial recovery programme. As a result the key principle of the Workforce Efficiency Programme will be on productivity and efficiency of the workforce.
Through this approach £2.3m of opportunities has been identified through improvements in sickness and turnover rates, thereby reducing need for temporary staff as backfill and improved efficiency. These opportunities are based on achieving the commitments identified in divisional business plans, bringing sickness and turnover in line with average levels of comparator large acute Trusts, and where divisions are already above average stretching to upper quartile performance.
To support the organisation in this approach, a detailed workforce information pack has been developed for each clinical division, containing data down to ward and department level, triangulated with heat maps, rostering data and building upon the learning from existing hot housing work.
Additional opportunities have also been identified in respect of Consultant job planning, junior doctor rotas, apprentices and alternative staffing models.
We take confidence from the progress we have already made with particular success in the following initiatives:
Hot housing initiatives in priority areas e.g. pop up recruitment shop, skills development programme for middle leaders
HCA sourcing strategy in the lead in to winter pressures
Introduction of Trac recruitment system, which supports an ongoing review and improvement recruitment processes which deliver a faster, leaner and more efficient time to hire
In order to provide continuity of care from our staff; sustained campaign to transfer agency staff to bank and substantive roles, including joint bank and substantive recruitment campaigns and a bank auto-enrol policy
A continued robust temporary staffing approval process
Continued work with our Bristol partners to achieve rate cap agency provision through the cross geography neutral vendor, implemented in November 2017
Workforce Plan
In 2017/18 agency spend was £6.260m against an agency ceiling of
£16.685m. We are confident that our plans will ensure our agency expenditure remains within the ceiling set by NHS Improvement for 2018/19 of
£14.480m.
Other initiatives we are applying to improve workforce efficiency include:
E-rostering: The Trust uses e-rostering across ward nursing, therapies and ancillary staff and will roll this out to other staff groups and work areas in 2018.
We will also continue the implementation of the Carter Good Rostering Practice Guide recommendations from January 2017, which will include review of the effective review of current practice/effectiveness in those clinical areas where e-rostering is already implemented. In addition, we will explore the full functionality of the E-Rostering system to increase productivity for managers and staff
Health & Wellbeing a number of actions are in place improve the wellbeing and retention of our staff, reducing turnover and sickness absence, including:
The establishment of a Retention Steering Group to oversee and support Trust wide initiatives on retention, ensuring consistency of approach
Extending the psychological and physiotherapy pilot to support staff employee well-being, with a particular focus on hard to reach groups of staff and the resilience of staff and managers
Restructure of the People & Transformation directorate to est