181 Figure 91 Cellular uptake fluorescent imaging performed on MCF-7 breast cancer cell lines, captured at specific time intervals and 24 hours) after treating the cells with one of the formulations (F1, F2) at two different concentrations each (100 µM and 40 µM) . 182 Figure 92 Cellular uptake fluorescent imaging performed on MDA MB 453 breast cancer cell lines, captured at specific time intervals and 24 hours) after treating the cells with one of the formulations (F1, F2) at two different concentrations each (100 µM and 40 µM) .
Cancer worldwide
Breast cancer
- History and statistics
- Types and pathology
- Etiology and risk factors
- Diagnosis
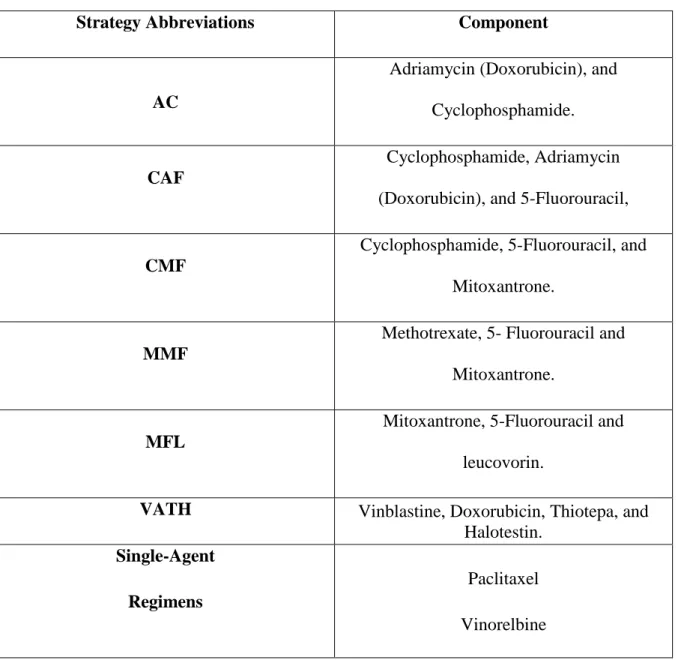
- Treatment strategies
Breast cancer can be simply defined as any anomalistic overgrowing cancerous tissue that affects one of the breast tissues. In the next section, we briefly discuss the most commonly used classifications for breast cancer.
Nanotechnology for cancer therapy
Targeting mechanisms
To take full advantage of the EPR effect, several approaches have been proposed to enhance the accumulation of nanoparticles in tumors. One of the most common ligands used in the literature and clinical trials is folic acid, which binds to folate receptors that are overexpressed in many tumor tissues, including breast cancer (65).
Nanoparticles delivery systems for breast cancer
Gold nanoparticles showed great sensitivity and specificity and can be used as a diagnostic marker for breast cancer(87). Among the specific formulations that have been studied for the treatment of breast cancer are hydrogels, nanofibers, and the use of intraductal catheters(91).
Nanoparticles preparation techniques
In addition to their use as a magnetic resonance contrast agent, they can be further used to target tumors using magnetic fields, including breast cancer(89,90). However, most bottom-up techniques are complex and difficult to scale up to industrial production.
Theory of Nanoparticle formation using Nanoprecipitation technique
Classical Nucleation Theory (CNT)
By considering the nature of the core as 'spherical', CNT assumes that the interior of the core is in the bulk of the new phase state and the interfacial tension (𝜸) is the same as that of a planar interface between the coexisting new and parent phases. 20 The free energy of the bulk nucleus is expressed as the difference between the free energy of the bulk particle and the solution as.
Ostwald ripening and particles condensation
The parameter A is a pre-exponential factor determined by the properties of the nucleating solute. The theoretical value of the pre-exponential factor is said to be ~1030 cm−3 s−1; in practice, however, it is very difficult to measure.
DLVO theory
23 On the other hand, another force is the Van der Waals attraction, which is a result of the forces between the mass of individual particles. In the equation, A is Hamaker's constant, which is defined as (𝐴=𝜋2𝐶𝜌1 𝜌2), where 𝜌1 and 𝜌2 are the number of atoms per unit volume in the two bodies, and C is the coefficient in the atom-atom pair potential.
Rapid solvent shift technique (flash nanoprecipitation)
- Drugs properties
- Solvent and anti-solvent nature
- Stabilizers
- Temperature
- Drug concentration
The affinity of the stabilizer to the drug surface will affect the particle size formed. Among the factors that affect the particle size of the nanoparticles formed by flash nanoprecipitation is the drug concentration used.
LDL-like nanoparticles
The effect of drug concentration is complex and depends on many factors, such as the hydrophobicity of the drug, the stabilizers used, and the solubility of the drug in the organic phase. Therefore, the synthetic preparation of LDL-like nanoparticles is highly recommended in order to combine the advantages of: LDL while avoiding the disadvantages by preparing reproducible, large quantities of targeted nanoparticles with homogeneous properties and in a facile manner (137).
Orlistat as promising anticancer
Fatty acid synthase enzyme (FASN) and breast cancer
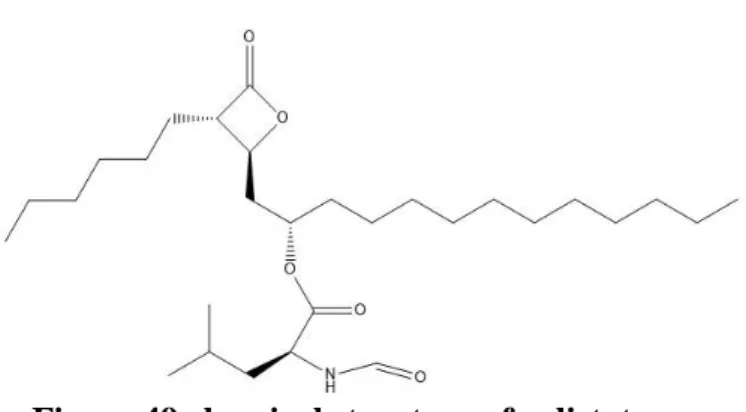
Orlistat as FASN inhibitor
Research Design
- Gap in Knowledge
- Overriding Questions
- Overriding hypothesis
- General Goals
Does coating these nanoparticles with a monolayer of phospholipids result in control of particle size growth. To determine the particle size distribution and zeta potential of a wide range of hydrophobic material nanoparticles prepared by rapid ethanol injection before and after deposition and in the presence of stabilizers such as surfactants.
EQUIPMENT AND TECHNIQUES
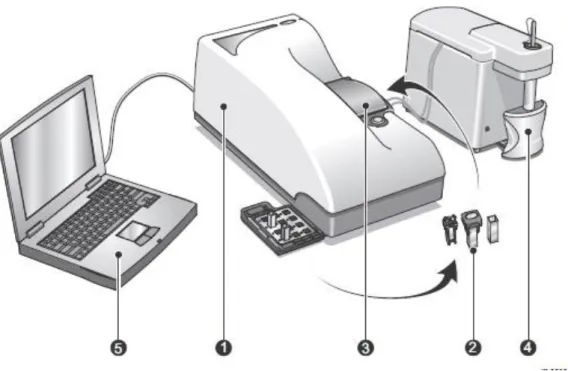
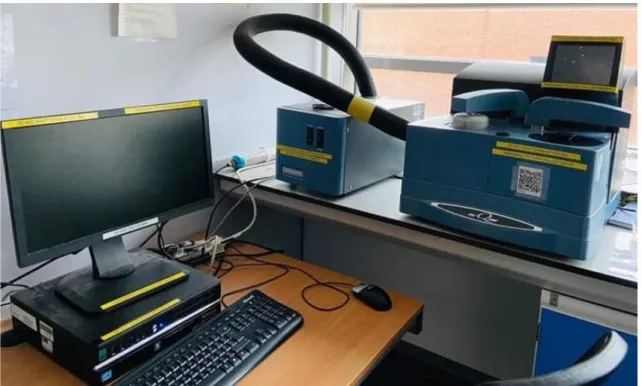
Dynamic light scattering (particle size)
The particles are exposed to a laser beam of a certain wavelength, then the intensity of the scattered light is measured. Simply, the smaller the particle size, the larger these fluctuations will be due to increased particle velocity.
Zeta potential
40 To better understand the differences between the intensity, volume and number distributions, consider a sample formed from 2 populations of particles that are equal in number, one with a size of 5 nm and the other 50 nm. As mentioned before, the Zeta potential is measured using the electrophoretic mobility of the particles, it can be estimated by Henry equation as follows.
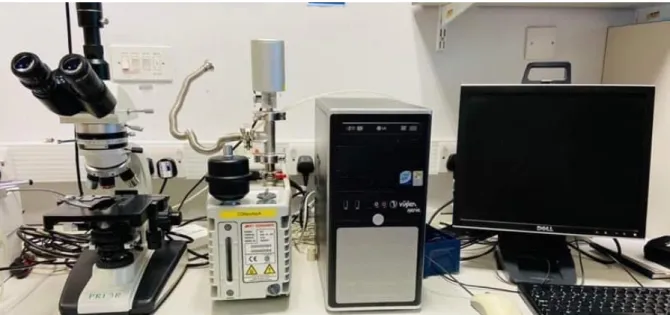
Transmission electron microscopy
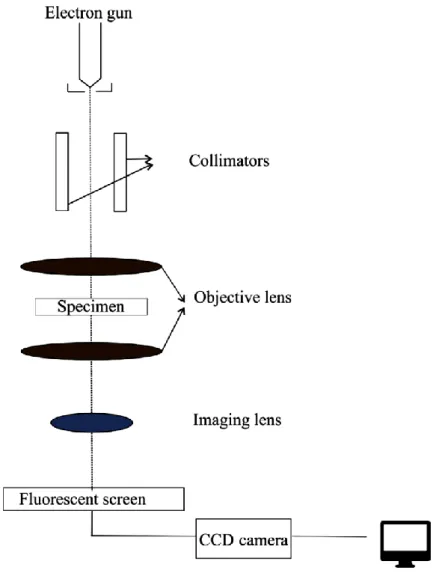
44 replaced by an electron beam in a TEM, the glass lens is replaced by an electromagnetic lens and images are viewed on a fluorescence plan instead of an eyepiece. Despite the various advantages of TEM, including high magnification and providing information on the structures of compounds and elements, TEM requires special maintenance, especially due to its ultrahigh vacuum system (164).
MATERIALS
METHODS
- Nanoparticles preparation
- Coating of the NPs
- Measuring the particle size and zeta potential
- TEM imaging of NPs
- Freeze drying of the NPs
- Drug incorporation assay
- UV assay of orlistat
- Encapsulation efficiency and drug loading
- Drug release assay
- Preparation of functionalised NPs
- Cell studies on the prepared formulations
- Statistical analysis
A 3 ml sample of the nanoparticle formulation was loaded into slide-A-lyzer dialysis cassettes (thermos Scientific™ mwco 3.5 Kd, UK). Simply an ethanolic solution of the drug along with a mixture of the phospholipids (POPC or DSPC), cholesterol and DSPE PEG 5000 maleimide peptide.
INTRODUCTION
NPs’ properties and its effect on efficacy of formulation
Compared to nanospheres, they found that nanoshots were transported through the vessel walls 4.1 times faster. Penetration within the tumor was also 1.7 times higher for the nanospheres compared to the volume in which the nanospheres were delivered.
Parameters that Govern Nanoparticle Size Prepared through Rapid Solvent Shifting
Meanwhile, the shape of the nanoparticle can have an influence on the behavior of the nanoformulation. Fluid Flow: Nature of fluid flow and dependence of turbulence on Reynaud number.
Effect of concentration on the size of nanoparticles
Last two parameters can help to control nanoparticle size and design the nanoparticle formulation.
AIMS AND OBJECTIVES
MATERIALS AND METHODS
Materials
Methods
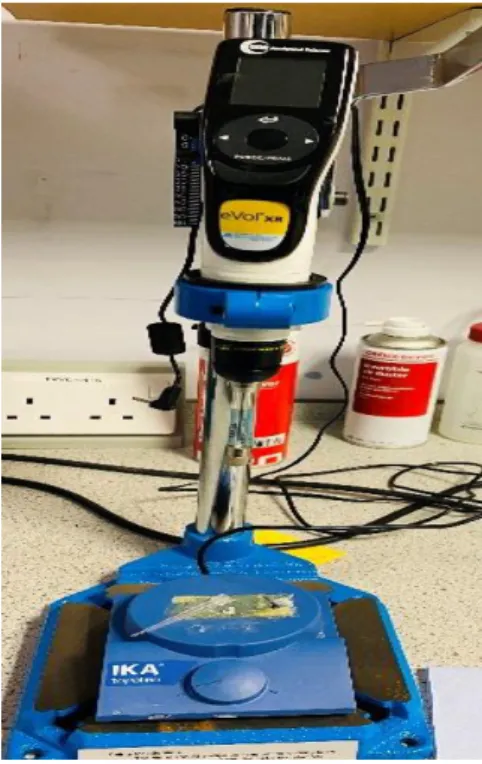
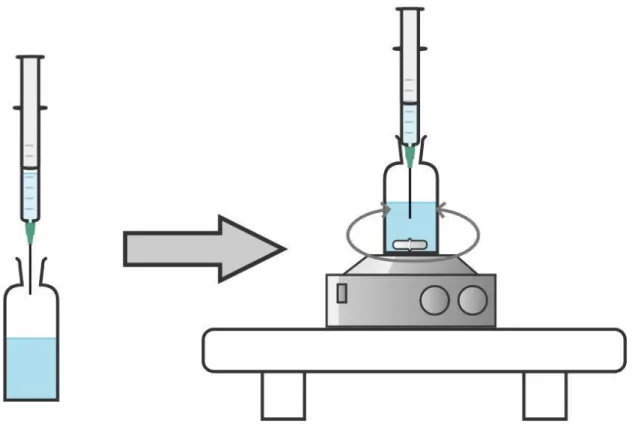
NPs were then prepared by injecting 0.5 ml of each ethanolic solution into 4.5 ml of water using the eVol™ Syringe Injector as previously mentioned. NPs were then prepared by injecting 0.5 ml of each ethanolic solution into 4.5 ml of water using an eVol™ syringe injector.
RESULTS AND DISCUSSION
Measuring the mean particle size using DLS
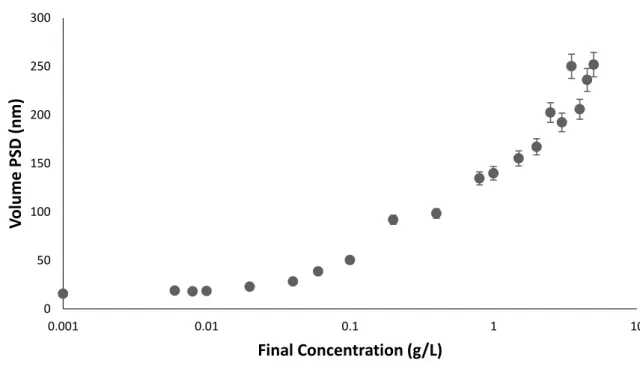
68 Figure 18 Particle size distribution by volume for olive oil NPs of 1 mM concentration, prepared by rapid solvent injection technique.
Olive oil NPs: the effect of concentration over particle size
However, it was found that at the higher olive oil concentrations there is an observed decrease in the number of particles. The zeta potential of the prepared olive oil nanoparticles showed an interestingly higher value compared to the triolein nanoparticles (Figure 24).
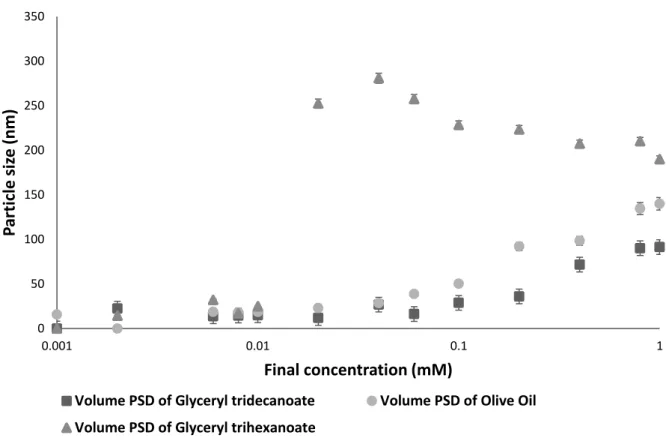
Effect of using different hydrophobic material on NPs properties
As shown in the figure, Ticaprin and Trihexanoin nanoparticles have a less negative average zeta potential (-30 mV and -39 mV respectively) compared to that of olive oil nanoparticles (-53 mV) due to the free fatty acid content of olive oil. This negative zeta potential increases the surface stability (electrostatic stability) of the formed nanoparticles against aggregation.
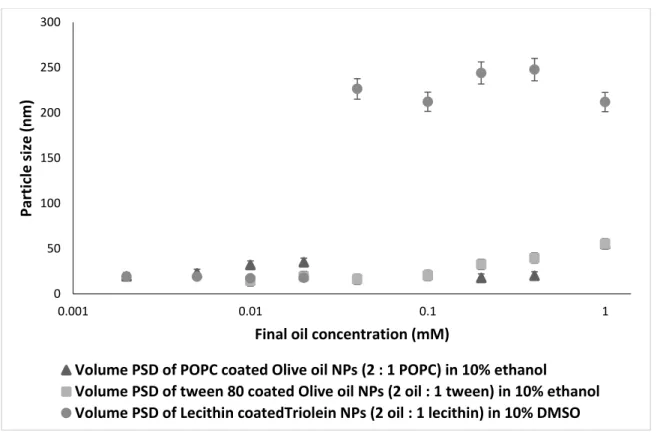
Effect of coating the NPs over the particle size growth
81 Figure 28 Comparison of volume average particle size of POPC-coated olive oil NPs between 80 in 10% ethanol and lecithin-coated NPs in 10% DMSO at a molar ratio (1 core:1 shell ), in different final olive oil. concentration (0.0025 to 1 mM), n=3. Final oil concentration (mM) Average Zeta potential of olive oil NPs coated with POPC (1:1) Average Zeta potential of uncoated olive oil NPs.
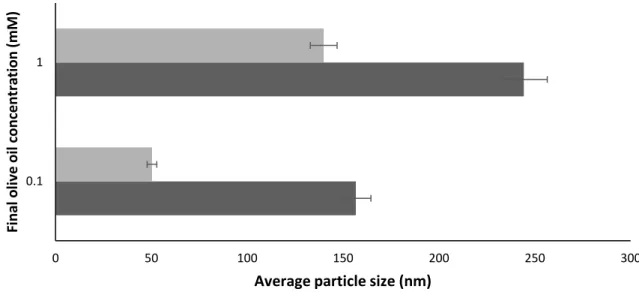
Effect of the rate of nanoprecipitation on particle size
However, the differences in final particle size resulting from the two different final concentrations of olive oil (higher concentration produces larger particles) contradicts a large body of relevant literature(190). With olive oil, however, the higher concentrations clearly lead to larger rather than smaller droplets.
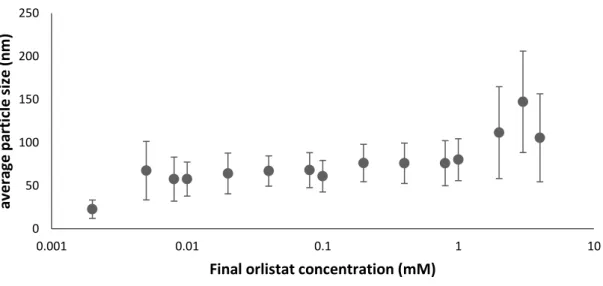
Orlistat nanoparticles
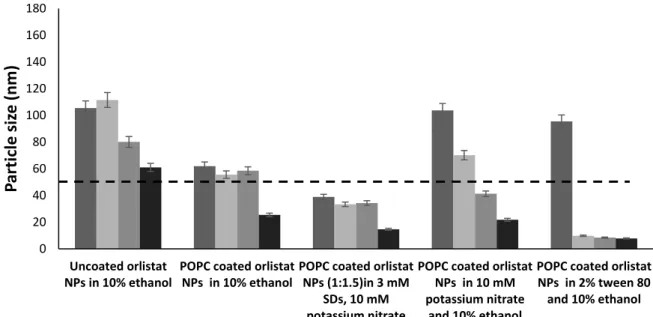
For POPC coated NPs with orlistat in a ratio of (2:1) (core:coating), the particle size was maintained in a controlled stable mean range (~30 nm) even at the highest concentration of orlistat used, unlike the larger particles of uncoated orlistat (~70 nm). Number of final orlistat concentration (mM) (particle/ml) for uncoated orlistat NPs (particle/ml) for POPC-coated orlistat NPs.
CONCLUSION
Comparison of orlistat with drugs such as niclosamide stearate showed similarity in behavior in terms of particle size and surface stability (SA2). Coating of orlistat with POPC at a molar ratio of 2:1 (core: coat) was effective in preventing particle size growth (SA4).
INTRODUCTION
- Fatty acid synthase enzyme (FASN) and breast cancer
- Orlistat as FASN inhibitors
- Orlistat as a promising anti-cancer
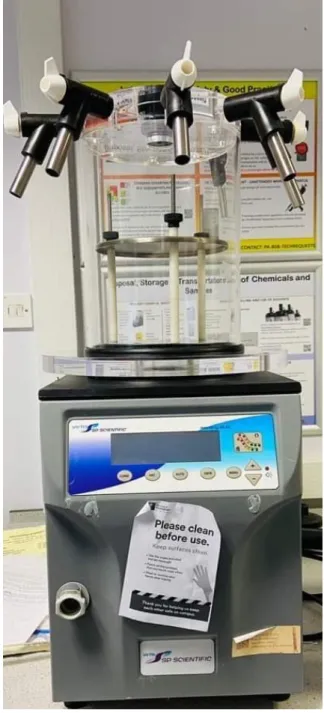
- Freeze-drying of nanoparticles
107 Dried nanocapsules of the volatile drug poly(ε-caprolactone) were stable after 6 months of storage under harsh temperature and humidity conditions (213). The type of cryoprotectant is critical to the overall properties of the freeze-dried formulation.
AIMS AND OBJECTIVES
109 Consequently, pilot studies should be performed to select the best cryoprotectant that can maintain the properties of the formulation of NPs used. 110 SA 4: Investigation of the structure and incorporation of orlistat into the coating material (POPC-lipid with other surfactants as stabilizers), and the overall physical properties of the prepared POPC-coated orlistat NPs.
MATERIALS AND METHODS
Materials
Methods
Incorporation of orlistat into the prepared NPs was tested to ensure complete coverage of the prepared NP formulations. The loading efficiency of the prepared NPs was estimated to be 60% of the total formulation mass.
RESULTS AND DISCUSSION
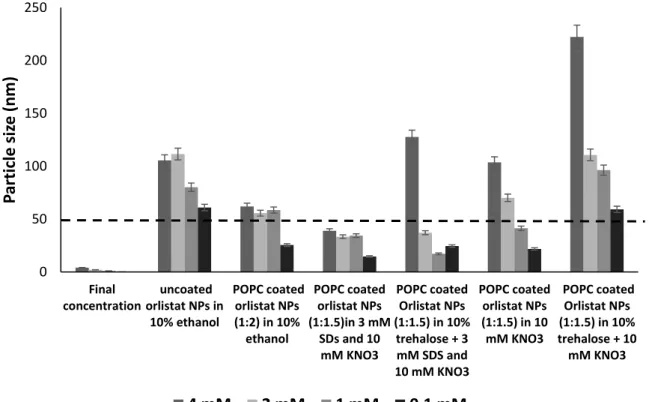
Evaluation of stabilisers’ effect on prepared NPs
In the presence of salts, we could see the current surface charge of orlistat NPs was around the average of – 15 mV. The stability of the prepared NPs was investigated after storage in a refrigerator (4ºC) for two weeks, in terms of particle size and surface charge.
Freeze drying and particles stability
126 (refrigerated for 6 months at 4 °C) and freshly prepared samples before freeze-drying. The images in Figure 60 show a clearly separated dispersion after reconstitution of the lyophilized formulation compared to the aggregated formulation stored without lyophilization.
Evaluation of drug incorporation
130 Figure 61 DSC thermograms of a heat-cooling cycle for A) pure orlistat, B) physical mixture of Orlistat and POPC, C) POPC-coated orlistat NPs. 131 Figure 62 PLM images to show birefringence for A) POPC lipid, B) Orlistat, C) POPC-coated orlistat NPs D) Uncoated orlistat NPs, 1) Dark field, 2) bright field.
UV assay of orlistat
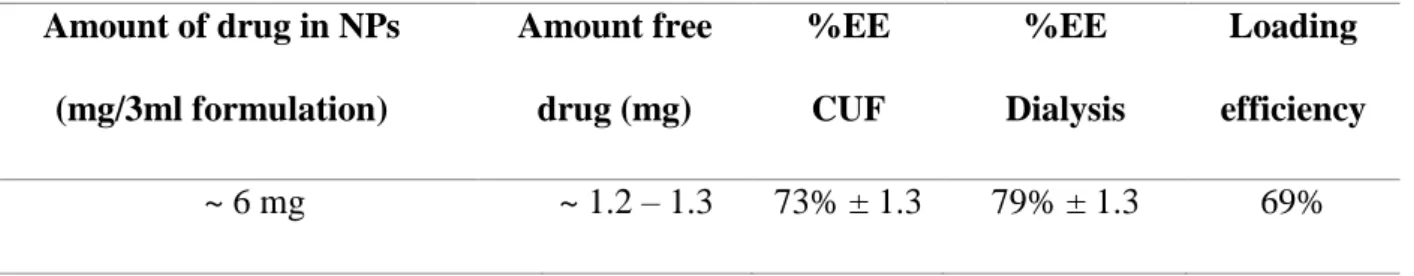
Drug loading and entrapment efficiency
The prepared POPC-coated NPs showed EE% of an average between 73 and 79% measured using 2 different methods measured on two different days for different samples, respectively, centrifugation ultrafiltration and dialysis, data were measured as an average of 3 samples ± SD, indicating the accuracy and reproducibility of the results. On the other hand, drug loading percentage known as loading efficiency (DL %) (Equation 20) is a ratio of the encapsulated drugs to the total weight of the NPs, and thus reflects the content of the drug in the total formulation, which is important for drug dose determination in the formulation.
Drug release assay
CONCLUSION
The drug release study showed that the orlistat NPs retained its structure for a long time under physiological conditions, with no more than 40% of the drug released from the NPs after 1 week. This is necessary to ensure the delivery of the intact NP's structure in the systemic circulation to the tumor cells, where it could release the drug (SA5).
INTRODUCTION
LDL-like nanoparticles
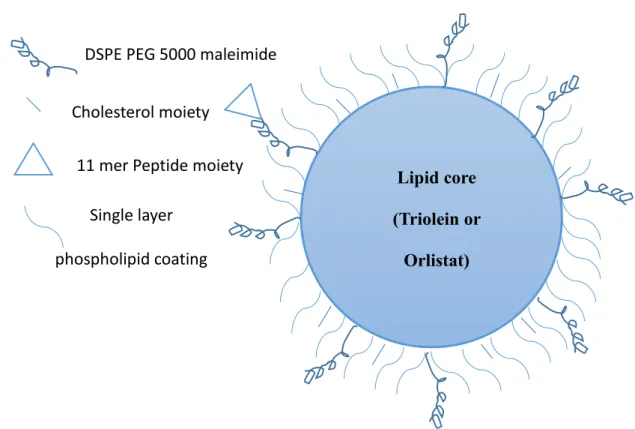
140 Figure 66 Schematic representation of the LDL-like nanoparticle compared to an exploded view of the LDL(232). In addition, the drugs used can escape the hydrolytic and enzymatic degradation in the plasma, since the LDL is a normal component of the blood.
AIMS AND OBJECTIVES
142 for hydrophobic agents, which can be loaded into the hydrophobic core or even make up the entire core. They can be easily targeted to tumor cells because the LDLR is highly expressed in most tumor cells (137).
MATERIALS AND METHODS
Materials
Methods
Preparation of the NPs was carried out by nanoprecipitation technique using the rapid solvent switching technique as mentioned before. The cellular uptake was evaluated as previously mentioned and the intensity of the fluorescence was evaluated using ImageJ®.
RESULTS AND DISCUSSION
- Functionalised LDL-like Orlistat NPs
- Effect of peptide coating on the NPs characteristics
- Investigation the effect culture medium on POPC coated orlistat NPs
- Investigation of orlistat binding to albumin
- Investigation of the cytotoxicity of orlistat formulations
- Investigation of cellular uptake
- Cellular uptake mechanism
157 Figure 72 shows the surface charge expressed as zeta potential (mV) of peptide-coated orlistat NPs prepared in 3 different media, either water, 2% tween 80, or 3 mM SDS, compared to the particle size distribution of uncoated orlistat NPs and POPC coated orlistat NPs. As shown in Figure 73 and Figure 74, preparation of orlistat NPs in DMEM resulted in an increase in the z-mean and volume distribution of particle sizes compared to the formulation prepared in 3 mM SDS.
CONCLUSIONS
CONCLUSIONS
FUTURE WORK
Calculations of number of particles, distance and amount of POPC for coating
Olive oil NPs
Uncoated orlistat NPs
Slow Vs Fast injection
POPC coated orlistat NPs
Size analysis of POPC coated orlistat NPs in different stabilisers
TEM Orlistat NPs (coated vs uncoated)
Orlistat in Dimethyl acetamide DMA
Peptide coated NPs DLS