University of Plymouth
PEARL https://pearl.plymouth.ac.uk
Faculty of Science and Engineering School of Biological and Marine Sciences
2021-03-05
Ocean acidification increases
phytobenthic carbon fixation and export in a warm-temperate system
Wada, S
http://hdl.handle.net/10026.1/16725
10.1016/j.ecss.2020.107113
Estuarine, Coastal and Shelf Science Elsevier BV
All content in PEARL is protected by copyright law. Author manuscripts are made available in accordance with publisher policies. Please cite only the published version using the details provided on the item record or
document. In the absence of an open licence (e.g. Creative Commons), permissions for further reuse of content should be sought from the publisher or author.
This is the author's accepted manuscript. A published version was made available online
1
on the 8 December 2020. The version of record will be published by Elsevier in Estuarine,
2
Coastal and Shelf Science online on 5 March 2021. This work is made available online
3
in accordance with the publisher's policies. Please refer to any applicable terms of use of
4
the publisher.
5 6
www.sciencedirect.com/science/article/pii/S0272771420308441
7 8
Ocean acidification increases phytobenthic
9
carbon fixation and export in a warm-temperate
10
system
11 12
Shigeki Wadaa*, Sylvain Agostinia, Ben P. Harveya, Yuko Omorib, Jason M. Hall-
13
Spencera,c
14
aShimoda Marine Research Center, University of Tsukuba, Shimoda, Japan
15
bLife and Environmental Sciences, University of Tsukuba, Tsukuba, Japan
16
cSchool of Biological and Marine Sciences, University of Plymouth, Plymouth, UK
17 18
*Corresponding author: Shimoda Marine Research Center, University of Tsukuba,
19
Shimoda, Shizuoka 415-0025, Japan
20
E-mail address: [email protected]
21
1. ABSTRACT
22
The response of photosynthetic organisms to rising CO2 levels is a key topic in ocean
23
acidification research. Most of the work in this field has focused on physiological
24
responses in laboratory conditions which lack ecological realism. Studies using seeps as
25
natural analogues for ocean acidification have demonstrated shifts in algal community
26
composition, but the effect of CO2 on carbon fixation and export remains unclear. Here,
27
we deployed artificial substrata in a warm-temperate region of Japan to collect algal
28
communities using a CO2 seep off Shikine Island. Diatoms became dominant on
29
settlement substrata in areas with elevated CO2 levels, whereas macroalgae dominated at
30
present-day levels of CO2 (reference site). This was supported by pigment composition;
31
fucoxanthin content, characteristic of diatoms, was higher at the high CO2 site, while
32
more Chlorophyll b, which is characteristic of Chlorophyta, was found in the reference
33
site. Algal communities that recruited in water with high levels of CO2 had elevated rates
34
of photosynthesis. Algal biomass was similar on all settlement panels, regardless of CO2
35
concentration. Much of the carbon that was fixed by algae in the high CO2 conditions was
36
exported, likely due to detachment from the substratum. Diatoms that dominated under
37
high CO2 conditions are more easily transported away as they have no holdfast, whereas
38
newly settled macroalgae became firmly attached at present-day levels of CO2. These
39
results show that ocean acidification may fundamentally alter coastal carbon cycling,
40
increasing photosynthesis and carbon export from coastal ecosystems in warm-temperate
41
biogeographic regions due to a shift in community composition from perennial to
42
ephemeral algae.
43 44
Keywords: Carbon cycle, CO2 seep, diatoms, macroalgae, marine productivity.
45
2. Introduction
46
Benthic algae are the major primary producers in shallow coastal regions (Charpy-
47
Roubaud and Sournia, 1990), and they have a number of other important ecological roles
48
such as a source of energy, carbon storage and habitat provisioning (Smale et al., 2013;
49
Costanza et al., 2014). Recent work has shown that rising carbon dioxide levels influence
50
these functions (Hall-Spencer and Harvey, 2019). Uptake of anthropogenic CO2 is causing
51
surface ocean seawater pH to fall by around 0.002 units per year with a 100% increase in
52
the concentration of H+ ions projected for the end of this century (IPCC, 2013). Ocean
53
acidification is a serious threat to coastal ecosystems because it reduces the saturation
54
state of carbonate which can make seawater corrosive to calcifying organisms such as
55
hard corals and shellfish (Doney et al., 2020).
56
As well as reducing the availability of calcium carbonate, ocean acidification
57
increases the amount of dissolved inorganic carbon (DIC) and this can stimulate the
58
growth of certain photosynthetic organisms (Hendriks et al., 2010; Olischläger and
59
Wiencke, 2013), if sufficient nutrients are available (Celis-Plá et al., 2015). Many algae
60
benefit from increased seawater CO2 concentrations in laboratory tests (Gao et al., 1991;
61
Kubler et al., 1999; Liu et al., 2018) although the response is species-specific because
62
some algae have carbon concentrating mechanisms (CCM) adapted to present day low
63
CO2 conditions (Badger et al., 1998; Cornwall et al., 2017).
64
To assess changes to coastal carbon cycling, we need to consider both the
65
physiological responses of algae to ocean acidification, and the changes in community
66
composition. In areas where CO2 is released from volcanic seeps the gas dissolves into
67
seawater providing a natural analogue for the effects of ocean acidification (Hall-Spencer
68
et al., 2008) which include profound changes to benthic microalgal (Johnson et al., 2013)
69
and macroalgal communities at both individual and population levels (Porzio et al., 2011,
70
2018, 2020). At a recently characterised natural analogue site in Japan, calcifying algae
71
and large habitat-forming macroalgae get replaced by turf algae at elevated CO2 levels
72
(Agostini et al., 2015, 2018; Harvey et al., 2019). This has been observed at many other
73
shallow-water CO2 seeps worldwide, although at some seeps seagrasses grow well (Hall-
74
Spencer et al., 2008; Connell et al., 2018). In the present study, we assess how a CO2
75
gradient at a Japanese seep affects algal community composition, photosynthesis and
76
biomass production.
77
Measurements of photosynthesis at CO2 seeps allow us to better constrain
78
projections of the response of primary producers to ocean acidification. In addition,
79
comparison of photosynthesis and biomass production furthers our understanding of
80
carbon storage by coastal ecosystems. Previous studies taking this approach have assessed
81
specific algal taxa (Hofmann et al., 2015; Vogel et al., 2015; Connell et al., 2018), but the
82
effects of ocean acidification on benthic algal community photosynthesis had not
83
previously been investigated. To tackle this, we used settlement panels which are widely
84
used to easily collect natural benthic communities (Perkol-Finkel et al., 2006; Sokołowski
85
et al., 2017). This technique has been used to assess shifts in benthic community
86
composition along CO2 gradients in the Mediterranean (Lidbury et al., 2012; Johnson et
87
al., 2013; Kroeker et al., 2013b). Moreover, settlement panels also allow the investigation
88
of the abundance, diversity and production of those communities of organisms that recruit
89
on to them.
90
In the present study, we investigated high CO2 and present-day conditions off
91
Shikine Island, Japan. After 44 and 72 days we collected algal communities that had
92
recruited in situ, recorded differences in community composition, incubated them in light
93
conditions to measure net photosynthesis, and then analysed the photosynthetic pigments
94
present. Our aim was to assess how high CO2 conditions affect coastal carbon fixation
95
and storage.
96
3. Materials and methods
97
3.1. Study sites
98
We deployed algal settlement panels in and away from a CO2 seep that is well
99
characterised as an analogue for ocean acidification (Agostini et al., 2015, 2018). It is
100
located off Mikawa Bay, Shikine Island (139.2°N, 34.3°E) in Japan (Fig. 1). Two sites
101
were used, an acidified area near to the CO2 seep (the ‘high CO2 site’) and a nearby area
102
(the ‘reference site’) in an adjacent bay of the island. The high CO2 site provided an end-
103
of-the-century projection for reductions in pH (IPCC, 2013), and was not confounded by
104
differences in temperature, salinity, dissolved oxygen, total alkalinity, nutrients or depth
105
relative to the reference site (Agostini et al., 2015, 2018; Harvey et al., 2019). Agostini et
106
al. (2018) and Harvey et al. (2018) present the environmental and carbonate chemistry
107
data collected during the present study. Briefly, seawater pH in total scale (pHT) and other
108
environmental parameters were monitored using a combination of sensors (interval of
109
measurement was 15 or 30 min, recorded from 25th May to July 5th 2016) and discrete
110
water sampling for total alkalinity. For reference and high CO2 sites, pHT was 8.137 ±
111
0.056 and 7.809 ± 0.093 respectively, the salinity was 34.5 ± 0.43 and 34.1 ± 0.69, the
112
temperature was 19.7 ± 0.71 and 19.5 ± 0.82 °C, the total alkalinity was 2270 ± 15.4 and
113
2270 ± 20.3 μmol kg-1 and the calculated pCO2 levels were 309 ± 46.4 and 769 ± 225
114
μatm (mean ± SD).
115
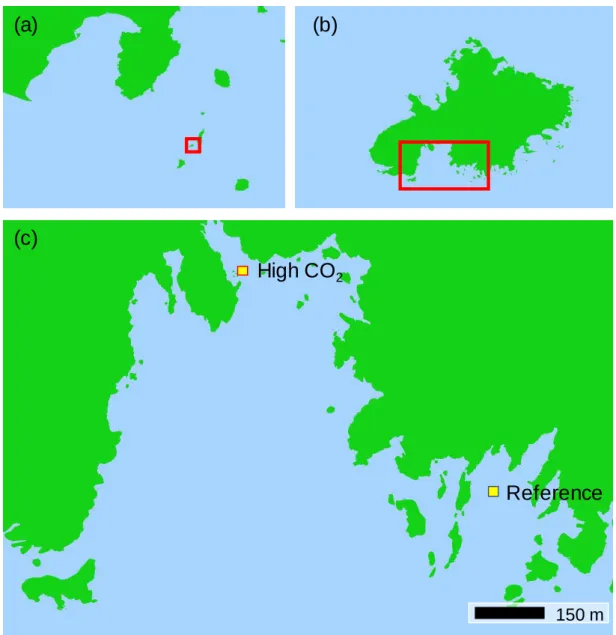
Figure 1. Study area off the Izu peninsula and archipelago off mainland Japan (a), Shikine Island (b) and the locations for the reference and high CO2 site used for the deployment of settlement panels (c), land shown in green.
116 117
3.2. Deployment of settlement panels
118
Settlement panels were held at -5 m depth Chart Datum within the high CO2 and
119
reference sites. The panels were made of transparent PVC measuring 5×2×0.2 cm. A total
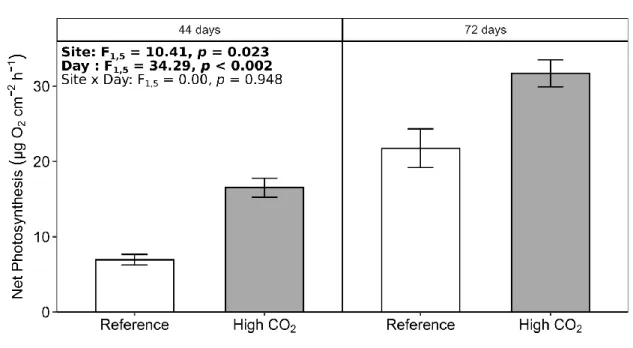
120
of 76 panels were attached to floats anchored 1 m above the seafloor and haphazardly
121
spread over a surface of ca. 400 m2 in each site. In April 2016, we put four and five floats
122
150 m
High CO2
Reference
(a) (b)
(c)
in the high CO2 and reference sites, respectively, corresponding to 34 panels in the high
123
CO2 and 42 panels in the reference sites. Subsets of the panels were retrieved in June after
124
44 days and July (after 72 days). The algae on the panels were examined using a light
125
microscope.
126 127
3.3. Pigment analysis
128
After 44 and 72 days of deployment, 19 and 5 panels from the high CO2, and 18 and
129
12 panels from the reference site were retrieved (at random) for pigment analysis. Each
130
settlement panel was photographed and analysed with imaging software (Adobe,
131
Photoshop) to measure the area size of the panels, and then stored at -80°C for pigment
132
analysis. The surface of each panel was scraped clean and the settled organisms were put
133
into 8 ml N’N-dimethylformamide to extract photosynthetic pigments. Canthaxanthin
134
was added to the extracts as an internal standard, and this was then filtered through a
135
polytetrafluorethylene (PTFE) filter with pore size of 0.45 μm (GE Healthcare Life
136
Science, WhatmanTM syringe filter, 13 mm diameter). Aliquot of extracts was injected
137
into an isocratic high-performance liquid chromatograph (Agilent, 1100 system
138
controlled by ChemStation) equipped with a C8 column (Agilent, Zorbax Eclipse XDB-
139
C8; 4.6 × 150 mm, 3.5 μm) and diode-array and fluorescent detectors. The peak of each
140
pigment was identified by comparison of their retention time relative to eight standards;
141
fucoxanthin, prasinoxanthin, 19’-hexanoloxyfucoxanthin, diadinoxanthin, alloxanthin,
142
zeaxanthin, Chlorophyll b and Chlorophyll a (Chl a), as described in more detail in Hama
143
et al. (2016).
144 145
3.4. Net photosynthesis
146
After 44 and 72 days of deployment, 6 and 4 panels from the high CO2, and 6 and 6
147
panels from the reference site were retrieved (at random) for the measurement of net
148
photosynthesis (NP). Incubation was carried out using a 250 ml acid-cleaned
149
polycarbonate bottle, with a subset of each panel (0.8 ×2.5 cm) being used. Each bottle
150
was filled with seawater collected from the site where the panels were retrieved, and
151
incubated under light (150 μmol photon s-1 cm-2) at 20°C for 1 hr to measure rates of NP.
152
Dissolved oxygen (DO) concentrations and pH in NBS scale (pHNBS) were measured at
153
the start and end of the incubation period with an optode DO meter (WTW, FD0925) and
154
a multi-sensor (ThermoFisher Scientific, Orion StarTM, equipped with a ROSS pH
155
electrode, 8156BNUWP). Based on the change in DO concentrations (ΔDO) values, we
156
calculated the NP rates (normalised by unit area) using the following equations:
157 158
NParea (NP per unit area: μg O2 cm-2 hour -1) = ΔDO × V / A / T × 1000
159
where V, A and T are volume of seawater for incubation (l), area of the plate (cm2),
160
and incubation time (hour), respectively (Roth et al., 2019).
161 162
Following the incubation, each settlement panel was photographed and analysed
163
with imaging software (Adobe, Photoshop) to measure the exact panel area size. All
164
incubations were completed within 6 hrs of collecting the panels.
165 166
3.5. Statistical analysis
167
The amount of Chl a and the rates of NParea were analysed using a two-way linear
168
mixed model (LMM) (R package: nlme, function: lme; v3.1-147: Pinheiro et al., 2020)
169
with ‘Site’ and ‘Days’ as fixed factors. Since several panels were attached to each float,
170
‘float’ was treated as a random factor. Homogeneity of variance (Levene Test) and
171
normality (QQ plot) were assessed for Chl a and NParea. Both Chl a (following log
172
transformation) and NParea conformed to these assumptions. Weighted principal
173
component analysis (R package: aroma light, functions: wpca: Bengtsson et al., 2010),
174
followed by PERMANOVA (R package: vegan, function: adonis; v2.5-6: Oksanen et al.,
175
2019), were used to assess for differences in the composition of accessory pigments
176
between ‘Site’ and ‘Days’. Weighting for the principal component analysis was used to
177
improve the robustness to uneven group sample sizes, with weighting applied to each
178
sample individually as 1 / n, where n is the sample size of the respective treatment groups
179
(combinations of ‘Site’ and ‘Days’). In the present study, all statistical analyses were
180
performed using the R statistical software, version 3.5.1 (R Core Team, 2018), and
181
visualisations were produced using ggplot 2 (Wickham, 2016) and ggpubr (Kassambara,
182
2020).
183
4. Results
184
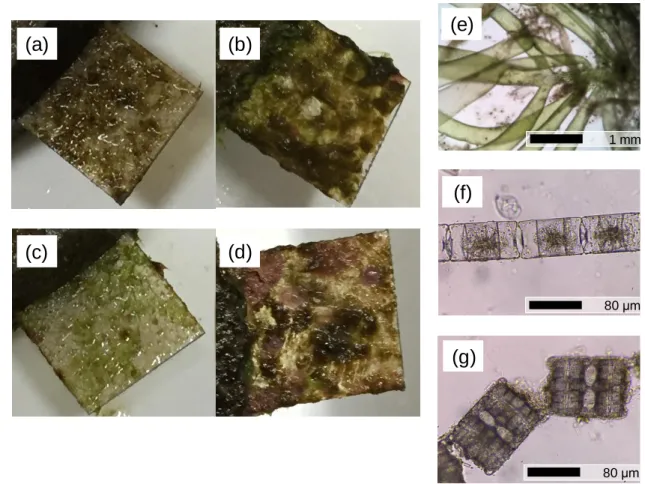
Visual inspection of the panels revealed biofilm formation and algal recruitment on
185
all panels across both sites and time points. At the high CO2 site, the panel were covered
186
with a homogenous brown biofilm at both time points (Fig. 2a,b). Panels at the reference
187
site were covered with a more diverse range of algal recruits (Fig. 2c,d). After 72 days,
188
the panels were more overgrown relative to 44 days, with juvenile macroalgal
189
Chlorophyta dominating panels at the reference site whereas the diatoms Triceratium sp.
190
and Biddulphia sp. were dominant on settlement panels at the high CO2 site (Fig. 2e-g).
191
Figure 2. Panels retrieved from high CO2 (a and b on day 44 and 72) and reference sites (c and d on day 44 and 72). Macroalgae dominated on settlement panels at the reference site (e), diatoms dominated at the acidified site; Triceratium sp. (f) and Biddulphia sp. (g).
Chl a was the main pigment and accounted for 31-68% of the total weight of
192
(a) (b)
(c) (d)
(e)
(f)
(g)
1 mm
80 μm
80 μm
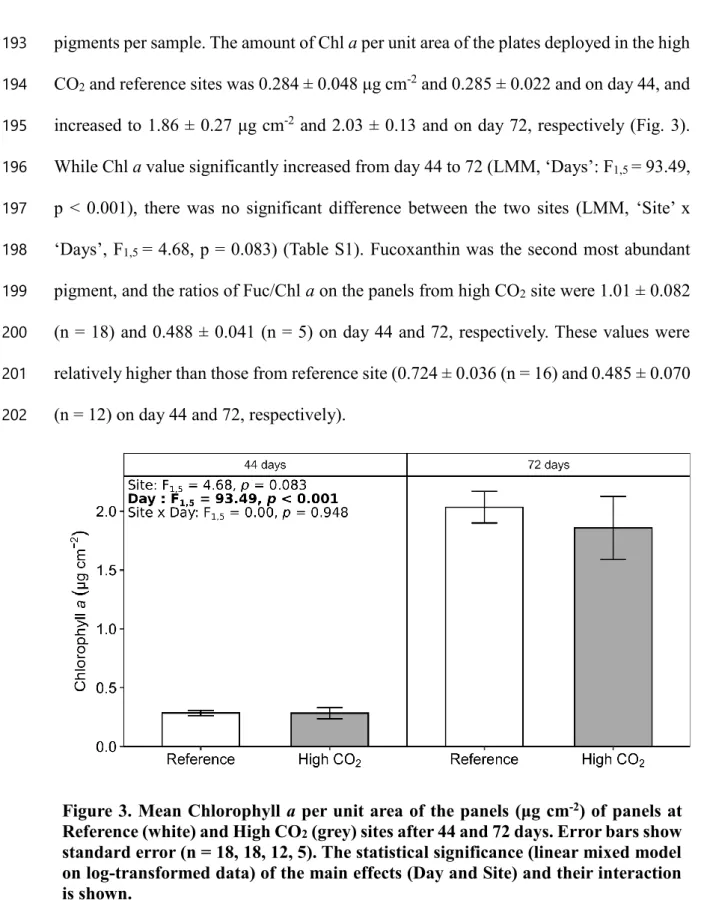
pigments per sample. The amount of Chl a per unit area of the plates deployed in the high
193
CO2 and reference sites was 0.284 ± 0.048 μg cm-2 and 0.285 ± 0.022 and on day 44, and
194
increased to 1.86 ± 0.27 μg cm-2 and 2.03 ± 0.13 and on day 72, respectively (Fig. 3).
195
While Chl a value significantly increased from day 44 to 72 (LMM, ‘Days’: F1,5 = 93.49,
196
p < 0.001), there was no significant difference between the two sites (LMM, ‘Site’ x
197
‘Days’, F1,5 = 4.68, p = 0.083) (Table S1). Fucoxanthin was the second most abundant
198
pigment, and the ratios of Fuc/Chl a on the panels from high CO2 site were 1.01 ± 0.082
199
(n = 18) and 0.488 ± 0.041 (n = 5) on day 44 and 72, respectively. These values were
200
relatively higher than those from reference site (0.724 ± 0.036 (n = 16) and 0.485 ± 0.070
201
(n = 12) on day 44 and 72, respectively).
202
Figure 3. Mean Chlorophyll a per unit area of the panels (μg cm-2) of panels at Reference (white) and High CO2 (grey) sites after 44 and 72 days. Error bars show standard error (n = 18, 18, 12, 5). The statistical significance (linear mixed model on log-transformed data) of the main effects (Day and Site) and their interaction is shown.
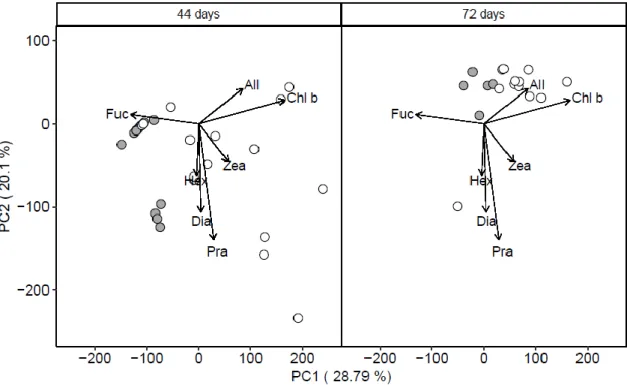
The overall composition of the pigments differed between both the ‘Site’
203
(PERMANOVA: F1, 47 = 27.44, p < 0.001) and ‘Days’ (PERMANOVA: F1, 47 = 13.22, p
204
< 0.001), but did not show a significant interaction (PERMANOVA: F1, 47 = 1.92, p =
205
0.16) (Table S2). Principal component analysis showed that the two sites (high CO2 and
206
reference) were mostly separated along PC1 (accounting for 28.8% of total variance; Fig.
207
S1) with values in a negative and positive direction distinguishing the high CO2 and
208
reference sites, respectively (Fig. 4). The pigment fucoxanthin showed a loading of -0.55
209
on the PC1 and therefore had a moderate contribution towards explaining the high CO2
210
site (Table 1). Chl b showed a positive loading of 0.70 and therefore had a moderate
211
contribution towards explaining the reference site (Table 1). The proportion of
212
fucoxanthin among accessory pigments were generally higher at the high CO2 site
213
compared to the reference site, whereas the proportion of chlorophyll b was higher in the
214
reference site, and below detection limit at day 44 in the High CO2 site (Table 1). The two
215
‘Days’ (44 and 72) were mostly separated along PC2 (accounting for 20.1% of total
216
variance; Fig. S1) with values in a negative and positive direction distinguishing the
217
earlier (day 44) and latter (day 72) sampling points, respectively (Fig. 4). Prasinoxanthin,
218
diadinoxanthin, and 19’-hexanoloxyfucoxanthin had a moderate contribution (-0.70, -
219
0.53 and -0.31, respectively) towards explaining the earlier and latter sampling points
220
(Table 1). Of these pigments, diadinoxanthin represented between 9-19% of the total
221
accessories pigments, although the other two pigments (Prasinoxanthin and 19’-
222
hexanoloxyfucoxanthin) represented less than 5% (Table 1). The two other pigments,
223
Alloxanthin and Zeaxanthin were minor components, contributing less than 4.2% each to
224
the total accessory pigments (Table 1).
225
Figure 4. Weighted principal component analysis biplot of accessory pigments across site (High CO2, filled circles, Reference - empty circles) and time points (44 days - left, and 72 days - right). The same PCA is used for both panels, but time points were separated for ease of visualisation, with the loading of each pigment indicated by vectors. The accessory pigments are fucoxanthin (Fuc), prasinoxanthin (Pra), 19’- hexanoloxyfucoxanthin (Hex), diadinoxanthin (Dia), alloxanthin (All), zeaxanthin (Zea) and chlorophyll b (Chl b).
226
Table 1. PCA loadings of the different pigments (across both sites and time points), and their percentage weights (mean ± se (n)) for each site and time point.
Percentage Weight PCA
loading 44 days after 72 days after Pigment PC1 PC2 Reference High CO2 Reference High CO2
Alloxanthin 0.36 0.21 1.8 ± 0.5 (16)
0.2 ± 0.2 (18)
1.2 ± 0.2 (12)
2.1 ± 0.1 (5)
Chlorophyll b 0.70 0.14 7.1 ± 2 (16)
0 ± 0 (18)
7.8 ± 1.1 (12)
2.9 ± 1.2 (5)
Diadinoxanthin 0.02 -0.53 12.4 ± 0.3 (16)
14.9 ± 0.3 (18)
11.7 ± 0.4 (12)
12.4 ± 0.6 (5)
Fucoxanthin -0.55 0.06 72.8 ± 2.4
(16) 84 ± 0.4
(18) 72.9 ± 1
(12) 79.3 ± 1.4 (5) 19’-
Hexanoloxyfucoxanthin 0.02 -0.31 0.8 ± 0.6 (16)
0 ± 0 (18)
5 ± 0.6 (12)
3.1 ± 0.3 (5)
Prasinoxanthin 0.12 -0.70 0.9 ± 0.5 (16)
0.9 ± 0.4 (18)
0.3 ± 0.3 (12)
0 ± 0 (5)
Zeaxanthin 0.24 -0.23 4.2 ± 0.7 (16)
0 ± 0 (18)
1.1 ± 0.3 (12)
0.2 ± 0.2 (5)
227
The pHNBS values of the seawater collected from the high CO2 and reference sites
228
(at 20°C) were 7.92 ± 0.003 and 8.20 ± 0.006 on day 44, and 7.70 ± 0.009 and 8.16 ±
229
0.007 (mean ± SD) on day 72, respectively. The changes in pHNBS (ΔpHNBS) under light
230
incubation for the sample from high CO2 and reference sites were 0.068 ± 0.007 and 0.043
231
± 0.008 on day 44, and 0.046 ± 0.020 and 0.052 ± 0.006 (mean ± SD) on day 72,
232
respectively, reflecting CO2 consumption by photosynthesis. Since the changes in the
233
pHNBS during the incubations were within narrow ranges (from 0.023 to 0.081),
234
differences in pHNBS between the seawater collected from the high CO2 and reference
235
sites were maintained throughout the experiment. The concentrations of DO at the start
236
of light incubations were 8.73 - 9.48 mg l-1, and changes in the incubation period were
237
0.18 - 0.93 mg l-1.
238
Net photosynthesis rates (NParea) of the panels from the high CO2 site were 16.5 ±
239
1.3 (mean ± SE, n = 6) and 31.7 ± 1.8 (mean ± SE, n = 4) μg O2 cm-2 hour -1 on day 44
240
and 72, and from the reference site were 6.94 ± 0.71, (mean ± SE, n = 6) and 21.8 ± 2.6,
241
(mean ± SE, n = 6) μg O2 cm-2 hour-1 on day 44 and 72, respectively (Fig. 4). Overall,
242
this meant that NParea of the settlement panels was significantly greater on Day 72
243
compared to Day 44 (LMM: ‘Day’, F1,5 = 34.29, p < 0.01), and also higher at the high
244
CO2 site relative to the reference site (LMM: ‘Site’, F1,5 = 10.41, p < 0.05) (Fig. 5, Table
245
S3).
246
Figure 5. Net photosynthic rates during laboratory incubation of panels from Reference (white bars) and High CO2 (grey bars) sites and time points (44 and 72 days) in seawater sampled at the same site. Error bars show standard error (n = 6, 6, 6, 4, respectively). The statistical significance (linear mixed model) of the main effects (Day and Site) and their interaction is shown.
247
5. Discussion
248
Studies of carbon dioxide seeps worldwide have shown that increasing levels of
249
ocean acidification cause major shifts in coastal algal community composition (Hall-
250
Spencer and Harvey, 2019). Here we show that algal settlement is affected by increasing
251
levels of CO2. Macroalgal recruits dominated settlement panels at a reference site, being
252
well attached by holdfasts, whereas less firmly attached diatoms dominated on panels at
253
a high CO2 site (Fig. 2). The differences in algal communities were confirmed through
254
photosynthetic pigment analysis. The amount of fucoxanthins was higher in the algal
255
communities at high CO2, these pigments are common in heterokont algae such as
256
diatoms and brown algae (Dring, 1998; Kuczynska et al., 2015).
257
Microscopy showed that diatoms, rather than brown algae, dominated the early
258
stages of settlement at high CO2, and this was confirmed by our pigment analyses after
259
44 and 72 days of settlement on panels. The pigment composition of brown algae and
260
benthic diatom mats reported in previous studies show that the ratio of Fuc/Chl a in most
261
brown algae (mean values among 30 species: 0.372; Colombo‐Pallotta et al., 2006;
262
Desmond et al., 2019; Marambio et al., 2017; Seely et al., 1972; Verma et al., 2017) were
263
lower than those of natural diatom mats (mean values among 4 reports: 1.168; Sundback
264
et al. 1996; Wulff et al. 2005; 2008; Stief et al. 2013) (Table S4). Considering the higher
265
ratio of Fuc/Chl a on the panels from the high CO2 site, this confirms that benthic diatoms
266
were dominant at the high CO2 site. In contrast, there was significantly more Chl b in the
267
algal community that settled onto the Reference site panels (Table 1), and this is the main
268
accessory pigment of Chlorophyta (Dring, 1998). Studies worldwide show that benthic
269
diatoms seem to be capable of benefitting from ocean acidification/high CO2 conditions
270
(Johnson et al., 2013; Marques da Silva et al., 2017; Harvey et al., 2019). Deployment of
271
settlement panels at this site showed that diatom recruitment was more intense in the high
272
CO2 site than in reference conditions.
273
Our study sites off Shikine island were very exposed to wave action and are in the
274
path of a strong ocean current (Kuroshio current), so it is worth comparing our results
275
with those from experiments set up in more sheltered conditions. Recruitment of algae
276
using artificial substrata have been assessed at CO2 seeps off the islands of Vulcano and
277
Ischia in Italy which are both less exposed to strong water movement than Shikine Island.
278
Off Vulcano, Johnson et al. (2013) also found higher diatom abundance at high CO2 on
279
settlement substrata suspended in the water column, but did not report on export of the
280
biomass grown in these conditions. Off Ischia island CO2 seeps, volcanic stone tiles were
281
attached to the seafloor to monitor algal succession for 2-14 months (Kroeker et al. 2012;
282
Porzio et al. 2013). Contrary to the present study, only a minimal biomass of diatoms was
283
reported at high CO2. As the panels in the present study were suspended off the seafloor,
284
benthic herbivores, such as gastropods, did not have access to the floats to graze. Since
285
grazing pressure is an important driving force in the community composition of benthic
286
flora (Hillebrand et al. 2000), the deployment position of the artificial substrata
287
(suspended or attached) could lead to differences in successional processes. In addition
288
to the environmental condition and experimental set-up, the duration of the experimental
289
deployment represents another important factor determining algal community succession.
290
Our experiment examined the phase of early succession, so there is scope in future studies
291
to investigate the effects of ocean acidification on the long-term development of
292
biofouling communities as it takes many months for these communities to mature
293
(Kroeker et al., 2013b; Brown et al., 2018).
294
Net photosynthetic rates were significantly higher on the high CO2 panels than on
295
the Reference panels (Fig. 5, Table S3), showing an increase in carbon fixation under
296
ocean acidification. In the present day, CO2 concentrations in surface seawater are
297
generally less than 15 μmol kg-1 (Zeebe and Wolf-Gladrow, 2009) which can limit
298
photosynthetic rates, through substrate limitation (Badger et al., 1998). Previous
299
laboratory and aquarium-based studies have shown that increased CO2 can enhance
300
photosynthesis in some algae (Gao et al., 1991; Kubler et al., 1999; Liu et al., 2018).
301
However, a number of recent studies have found that increased CO2 can have no or even
302
negative effects on photosynthesis in several algal species (Peach et al. 2017; Porzio et al.
303
2020), highlighting that responses to ocean acidification are species-specific. These
304
interspecific differences lead to shifts in community composition under high CO2
305
conditions, which complicates the up-scaling of laboratory studies to ecosystem-level
306
change. In the present study, we demonstrate that in situ photosynthesis of an algal
307
community increased with ocean acidification, which is directly relevant for future
308
projections of primary production and carbon storage.
309
Although algal community productivity was enhanced in high-CO2 conditions, the
310
Chl a content on these settlement panels was similar to those in reference site conditions
311
(Fig. 3) showing that algal biomass did not increase despite enhanced photosynthesis.
312
This mismatch between photosynthesis and biomass suggests that a large part of the fixed
313
carbon was subsequently being lost in the high-CO2 conditions due to the detachment of
314
algae and export of carbon from the substratum. In the reference site, macroalgae were
315
held in place by holdfasts which strongly attached the thalli to hard surfaces and helped
316
them resist drag forces due to waves and currents. Diatoms, which were dominant on the
317
panels in the high CO2 site, have no holdfast and are only attached by sticky mucus
318
materials exuded extracellularly (Hoagland et al., 1993). At our seep site, benthic diatoms
319
were so abundant that they formed turf-like mats in areas with high CO2 (Fig. S2a and
320
Agostini et al., 2018; Harvey et al., 2019). Detached aggregations of these turf diatoms at
321
the high CO2 site occur during the spring-summer season, where they can be seen drifting
322
in clumps across the seabed (Fig. S2b,c). The drifting algal aggregates are typically a
323
mixture of diatom and drift macroalgae, with the diatom species identified on the panels
324
(Triceratium sp. and Biddulphia sp.) found in large numbers within the aggregates (Fig.
325
S2d,e).
326
Our findings support other research showing that ocean acidification changes coastal
327
algal communities, and we provide novel data showing its effects on coastal carbon
328
fixation and export. Although algae will continue to provide a huge amount of energy for
329
coastal ecosystems through high rates of photosynthesis (Mann, 1973; Graham et al.,
330
2016), our data show a shift from resilient, long-lived, diverse algal stands that store large
331
amounts of carbon, to less resilient, short-lived and less diverse stands that have increased
332
rates of carbon fixation but greater rates of carbon export. Such changes in algal
333
communities reduce habitat complexity and algal biomass in rocky shore habitats.
334
Unless humanity is able to minimize and address the impacts of ocean acidification we
335
can expect that it will cause major disruption to coastal ecosystems with knock-on effects
336
on nearshore food webs, fisheries and carbon cycle.
337 338
6. Acknowledgements
339
We thank the technical staff of Shimoda Marine Research Center and Mr Yasutaka
340
Tsuchiya, for help with field sampling. We are also grateful to Dr T. Hama for his kind
341
advice. The species identification of diatoms was supported by Drs K. Ishida and T.
342
Nakayama. Dr J. Hama helped with HPLC analysis. The field survey was permitted by
343
Nii-jima Fishery Cooperatives Shikine-jima Branch. This study was supported by the
344
Environment Research and Technology Development Fund (4RF-1701), the Ministry of
345
Education, Science, Sports and Culture, Grant-in-Aid for Scientific Research (B)
346
(19H04234) and Graind-in-Aid for Young Scientists (B) (17K17622), and the
347
International Educational and Research Laboratory Program of the University of Tsukuba.
348
7. References
Agostini, S., Harvey, B.P., Wada, S., Kon, K., Milazzo, M., Inaba, K., Hall-Spencer, J.M., 2018. Ocean acidification drives community shifts towards simplified non- calcified habitats in a subtropical−temperate transition zone. Scientific Reports 8.
https://doi.org/10.1038/s41598-018-29251-7
Agostini, S., Wada, S., Kon, K., Omori, A., Kohtsuka, H., Fujimura, H., Tsuchiya, Y., Sato, T., Shinagawa, H., Yamada, Y., Inaba, K., 2015. Geochemistry of two shallow CO2
seeps in Shikine Island (Japan) and their potential for ocean acidification research.
Regional Studies in Marine Science 2, 45–53.
https://doi.org/10.1016/j.rsma.2015.07.004
Azevedo, L.B., De Schryver, A.M., Hendriks, A.J., Huijbregts, M.A.J., 2015. Calcifying Species Sensitivity Distributions for Ocean Acidification. Environmental Science
& Technology 49, 1495–1500. https://doi.org/10.1021/es505485m
Badger, M.R., Andrews, T.J., Whitney, S.M., Ludwig, M., Yellowlees, D.C., Leggat, W., Price, G.D., 1998. The diversity and coevolution of Rubisco, plastids, pyrenoids, and chloroplast-based CO2 -concentrating mechanisms in algae. Canadian Journal of Botany 76, 1052–1071. https://doi.org/10.1139/b98-074
Bengtsson, H., Neuvial, P., Speed, T.P., 2010. TumorBoost: Normalization of allele- specific tumor copy numbers from a single pair of tumor-normal genotyping microarrays. BMC Bioinformatics 11, 245. https://doi.org/10.1186/1471-2105- 11-245
Brown, N.E.M., Milazzo, M., Rastrick, S.P.S., Hall-Spencer, J.M., Therriault, T.W., Harley, C.D.G., 2018. Natural acidification changes the timing and rate of succession, alters community structure, and increases homogeneity in marine biofouling communities. Global Change Biology 24, e112–e127.
https://doi.org/10.1111/gcb.13856
Celis-Plá, P.S.M., Hall-Spencer, J.M., Horta, P.A., Milazzo, M., Korbee, N., Cornwall, C.E., Figueroa, F.L., 2015. Macroalgal responses to ocean acidification depend on nutrient and light levels. Frontiers in Marine Science 2.
https://doi.org/10.3389/fmars.2015.00026
Charpy-Roubaud, C., Sournia, A., 1990. The comparative estimation of phytoplanktonic, microphytobenthic and macrophytobenthic primary production in the oceans’.
Marine Microbial Food Webs 4, 31–57.
Colombo‐Pallotta, M.F., García‐Mendoza, E., Ladah, L.B., 2006. Photosynthetic performance, light absorption, and pgiment composition of Macrocystis pyrifera (Laminariales, Phaeophyceae) blades from different depths. Journal of Phycology 42, 1225–1234. https://doi.org/10.1111/j.1529-8817.2006.00287.x
Connell, S.D., Doubleday, Z.A., Foster, N.R., Hamlyn, S.B., Harley, C.D.G., Helmuth, B., Kelaher, B.P., Nagelkerken, I., Rodgers, K.L., Sarà, G., Russell, B.D., 2018.
The duality of ocean acidification as a resource and a stressor. Ecology 99, 1005–
1010. https://doi.org/10.1002/ecy.2209
Cornwall, C.E., Revill, A.T., Hall-Spencer, J.M., Milazzo, M., Raven, J.A., Hurd, C.L., 2017. Inorganic carbon physiology underpins macroalgal responses to elevated CO2. Scientific Reports 7. https://doi.org/10.1038/srep46297
Costanza, R., de Groot, R., Sutton, P., van der Ploeg, S., Anderson, S.J., Kubiszewski, I., Farber, S., Turner, R.K., 2014. Changes in the global value of ecosystem services.
Global Environmental Change 26, 152–158.
https://doi.org/10.1016/j.gloenvcha.2014.04.002
Desmond, M.J., Pajusalu, L., Pritchard, D.W., Stephens, T.A., Hepburn, C.D., 2019.
Whole community estimates of macroalgal pigment concentration within two southern New Zealand kelp forests. Journal of Phycology 55, 936–947.
https://doi.org/10.1111/jpy.12884
Doney, S.C., Busch, D.S., Cooley, S.R., Kroeker, K.J., 2020. The Impacts of Ocean Acidification on Marine Ecosystems and Reliant Human Communities. Annual Review of Environment and Resources 45, 83–112.
https://doi.org/10.1146/annurev-environ-012320-083019
Dring, M.J., 1998. The Biology of Marine Plants. Univ. Press, Cambridge.
Gao, K., Aruga, Y., Asada, K., Ishihara, T., Akano, T., Kiyohara, M., 1991. Enhanced growth of the red alga Porphyra yezoensis Ueda in high CO2 concentrations.
Journal of Applied Phycology 3, 355–362.
Graham, M., Fox, M., Hamilton, S., 2016. Macrophyte Productivity and the Provisioning of Energy and Habitat to Nearshore Systems, in: Ólafsson, E. (Ed.), Marine Macrophytes as Foundation Species. CRC Press, Taylor & Francis Group, 6000 Broken Sound Parkway NW, Suite 300, Boca Raton, FL 33487-2742, pp. 133–
152. https://doi.org/10.4324/9781315370781-7
Hall-Spencer, J.M., Harvey, B.P., 2019. Ocean acidification impacts on coastal ecosystem services due to habitat degradation. Emerging Topics in Life Sciences 3, 197–206.
https://doi.org/10.1042/ETLS20180117
Hall-Spencer, J.M., Rodolfo-Metalpa, R., Martin, S., Ransome, E., Fine, M., Turner, S.M., Rowley, S.J., Tedesco, D., Buia, M.-C., 2008. Volcanic carbon dioxide vents show ecosystem effects of ocean acidification. Nature 454, 96–99.
https://doi.org/10.1038/nature07051
Hama, T., Inoue, T., Suzuki, R., Kashiwazaki, H., Wada, S., Sasano, D., Kosugi, N., Ishii, M., 2016. Response of a phytoplankton community to nutrient addition under different CO2 and pH conditions. Journal of Oceanography 72, 207–223.
https://doi.org/10.1007/s10872-015-0322-4
Harvey, B.P., Agostini, S., Kon, K., Wada, S., Hall-Spencer, J.M., 2019. Diatoms Dominate and Alter Marine Food-Webs When CO2 Rises. Diversity 11, 242.
https://doi.org/10.3390/d11120242
Harvey, B.P., Agostini, S., Wada, S., Inaba, K., Hall-Spencer, J.M., 2018. Dissolution:
The Achilles’ Heel of the Triton Shell in an Acidifying Ocean. Frontiers in Marine Science 5. https://doi.org/10.3389/fmars.2018.00371
Hendriks, I.E., Duarte, C.M., Álvarez, M., 2010. Vulnerability of marine biodiversity to ocean acidification: A meta-analysis. Estuarine, Coastal and Shelf Science 86, 157–164. https://doi.org/10.1016/j.ecss.2009.11.022
Hoagland, K.D., Rosowski, J.R., Gretz, M.R., Roemer, S.C., 1993. Diatom extracellular polymeric substances: function, fine structure, chemistry, and physiology. Journal of Phycology 29, 537–566. https://doi.org/10.1111/j.0022-3646.1993.00537.x Hofmann, L.C., Fink, A., Bischof, K., de Beer, D., 2015. Microsensor studies on Padina
from a natural CO2 seep: implications of morphology on acclimation to low pH.
Journal of Phycology 51, 1106–1115. https://doi.org/10.1111/jpy.12347
IPCC, 2013. Climate change 2013: The Physical Science Basis. Contribution of Working Group I to the Fifth Assessment Report of the Intergovernmental Panel on Climate Change. URL https://www.ipcc.ch/report/ar5/wg1/ (accessed 1.10.19).
Johnson, V.R., Brownlee, C., Rickaby, R.E.M., Graziano, M., Milazzo, M., Hall-Spencer, J.M., 2013. Responses of marine benthic microalgae to elevated CO2. Marine Biology 160, 1813–1824. https://doi.org/10.1007/s00227-011-1840-2
Kassambara, A., 2020. ggpubr: “ggplot2” Based Publication Ready Plots.
Kroeker, K.J., Kordas, R.L., Crim, R., Hendriks, I.E., Ramajo, L., Singh, G.S., Duarte, C.M., Gattuso, J.-P., 2013a. Impacts of ocean acidification on marine organisms:
quantifying sensitivities and interaction with warming. Global Change Biology 19, 1884–1896. https://doi.org/10.1111/gcb.12179
Kroeker, K.J., Micheli, F., Gambi, M.C., 2013b. Ocean acidification causes ecosystem shifts via altered competitive interactions. Nature Climate Change 3, 156–159.
https://doi.org/10.1038/nclimate1680
Kubler, J.E., Johnston, A.M., Raven, J.A., 1999. The effects of reduced and elevated CO2
and O2 on the seaweed Lomentaria articulata. Plant, Cell and Environment 22, 1303–1310. https://doi.org/10.1046/j.1365-3040.1999.00492.x
Kuczynska, P., Jemiola-Rzeminska, M., Strzalka, K., 2015. Photosynthetic Pigments in Diatoms. Marine Drugs 13, 5847–5881. https://doi.org/10.3390/md13095847 Lidbury, I., Johnson, V., Hall-Spencer, J.M., Munn, C.B., Cunliffe, M., 2012.
Community-level response of coastal microbial biofilms to ocean acidification in a natural carbon dioxide vent ecosystem. Marine Pollution Bulletin 64, 1063–
1066. https://doi.org/10.1016/j.marpolbul.2012.02.011
Liu, L., Zou, D., Jiang, H., Chen, B., Zeng, X., 2018. Effects of increased CO2 and temperature on the growth and photosynthesis in the marine macroalga Gracilaria lemaneiformis from the coastal waters of South China. Journal of Applied Phycology 30, 1271–1280. https://doi.org/10.1007/s10811-017-1316-y
Mann, K.H., 1973. Seaweeds: Their Productivity and Strategy for Growth: The role of large marine algae in coastal productivity is far more important than has been suspected. Science 182, 975–981. https://doi.org/10.1126/science.182.4116.975 Marambio, J., Rodriguez, J.P., Mendez, F., Ocaranza, P., Rosenfeld, S., Ojeda, J.,
Rautenberger, R., Bischof, K., Terrados, J., Mansilla, A., 2017. Photosynthetic performance and pigment composition of Macrocystis pyrifera (Laminariales, Phaeophyceae) along a gradient of depth and seasonality in the ecoregion of Magellan, Chile. Journal of Applied Phycology 29, 2575–2585.
https://doi.org/10.1007/s10811-017-1136-0
Marques da Silva, J., Cruz, S., Cartaxana, P., 2017. Inorganic carbon availability in benthic diatom communities: photosynthesis and migration. Philosophical Transactions of the Royal Society B: Biological Sciences 372, 20160398.
https://doi.org/10.1098/rstb.2016.0398
Méndez, F., Marambio, J., Ojeda, J., Rosenfeld, S., Rodríguez, J.P., Tala, F., Mansilla, A., 2019. Variation of the photosynthetic activity and pigment composition in two morphotypes of Durvillaea antarctica (Phaeophyceae) in the sub-Antarctic ecoregion of Magallanes, Chile. J Appl Phycol 31, 905–913.
https://doi.org/10.1007/s10811-018-1675-z
Oksanen, J., Blanchet, F.G., Friendly, M., Kindt, R., Legendre, P., McGlinn, D., Minchin, P.R., O’Hara, R.B., Simpson, G.L., Solymos, P., Stevens, M.H.H., Szoecs, E., Wagner, H., 2019. vegan: Community Ecology Package.
Olischläger, M., Wiencke, C., 2013. Ocean acidification alleviates low-temperature effects on growth and photosynthesis of the red alga Neosiphonia harveyi
(Rhodophyta). Journal of Experimental Botany 64, 5587–5597.
https://doi.org/10.1093/jxb/ert329
Perkol-Finkel, S., Zilman, G., Sella, I., Miloh, T., Benayahu, Y., 2006. Floating and fixed artificial habitats: effects of substratum motion on benthic communities in a coral reef environment. Marine Ecology Progress Series 317, 9–20.
https://doi.org/10.3354/meps317009
Pinheiro, J., Bates, D., DebRoy, S., Sarkar, D., EISPACK, E., Heisterkamp, S., Willigen, B.V., R-core, 2020. nlme: Linear and Nonlinear Mixed Effects Models.
Porzio, L., Arena, C., Lorenti, M., De Maio, A., Buia, M.C., 2020. Long-term response of Dictyota dichotoma var. intricata (C. Agardh) Greville (Phaeophyceae) to ocean acidification: Insights from high pCO2 vents. Science of The Total Environment 731, 138896. https://doi.org/10.1016/j.scitotenv.2020.138896
Porzio, L., Buia, M.C., Ferretti, V., Lorenti, M., Rossi, M., Trifuoggi, M., Vergara, A., Arena, C., 2018. Photosynthesis and mineralogy of Jania rubens at low pH/high pCO2: A future perspective. Science of The Total Environment 628–629, 375–
383. https://doi.org/10.1016/j.scitotenv.2018.02.065
Porzio, L., Buia, M.C., Hall-Spencer, J.M., 2011. Effects of ocean acidification on macroalgal communities. Journal of Experimental Marine Biology and Ecology 400, 278–287. https://doi.org/10.1016/j.jembe.2011.02.011
R Core Team, 2018. R: A Language and Environment for Statistical Computing. R Foundation for Statistical Computing, Vienna, Austria.
Roth, F., Wild, C., Carvalho, S., Rädecker, N., Voolstra, C.R., Kürten, B., Anlauf, H., El‐
Khaled, Y.C., Carolan, R., Jones, B.H., 2019. An in situ approach for measuring biogeochemical fluxes in structurally complex benthic communities. Methods in Ecology and Evolution 10, 712–725. https://doi.org/10.1111/2041-210X.13151 Seely, G.R., Duncan, M.J., Vidaver, W.E., 1972. Preparative and analytical extraction of
pigments from brown algae with dimethyl sulfoxide. Marine Biology 12, 184–
188. https://doi.org/10.1007/BF00350754
Smale, D.A., Burrows, M.T., Moore, P., O’Connor, N., Hawkins, S.J., 2013. Threats and knowledge gaps for ecosystem services provided by kelp forests: a northeast Atlantic perspective. Ecology and Evolution 3, 4016–4038.
https://doi.org/10.1002/ece3.774
Sokołowski, A., Ziółkowska, M., Balazy, P., Kukliński, P., Plichta, I., 2017. Seasonal and multi-annual patterns of colonisation and growth of sessile benthic fauna on artificial substrates in the brackish low-diversity system of the Baltic Sea.
Hydrobiologia 790, 183–200. https://doi.org/10.1007/s10750-016-3043-9
Verma, P., Kumar, M., Mishra, G., Sahoo, D., 2017. Multivariate analysis of fatty acid and biochemical constitutes of seaweeds to characterize their potential as bioresource for biofuel and fine chemicals. Bioresource Technology 226, 132–
144. https://doi.org/10.1016/j.biortech.2016.11.044
Vogel, N., Fabricius, K.E., Strahl, J., Noonan, S.H.C., Wild, C., Uthicke, S., 2015.
Calcareous green alga Halimeda tolerates ocean acidification conditions at tropical carbon dioxide seeps: Halimeda growing at CO2 seeps. Limnology and Oceanography 60, 263–275. https://doi.org/10.1002/lno.10021
Waldbusser, G.G., Hales, B., Langdon, C.J., Haley, B.A., Schrader, P., Brunner, E.L., Gray, M.W., Miller, C.A., Gimenez, I., 2015. Saturation-state sensitivity of marine bivalve larvae to ocean acidification. Nature Climate Change 5, 273–280.
https://doi.org/10.1038/nclimate2479
Wickham, H., 2016. ggplot2: Elegant Graphics for Data Analysis. Springer-Verlag New York.
Zeebe, R.E., Wolf-Gladrow, D., 2009. CO2 in Seawater: Equilibrium, Kinetics, Isotopes.
Elsevier Oceanography Series 65.
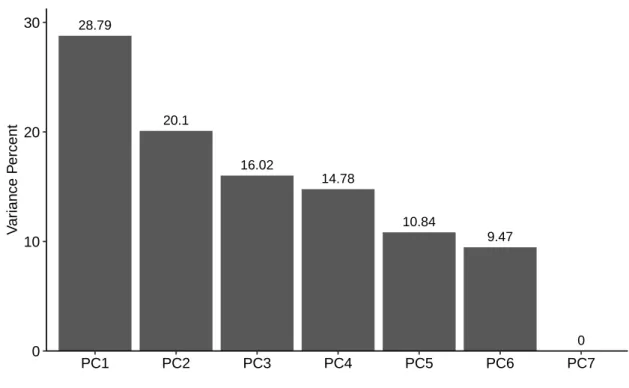
Supporting Information
Figure S1. Scree plot for the weighted principal component analysis. Loadings of each component were shown in descending order. The ordinate and abscissa are percent value of variance and number of dimensions, respectively.
28.79
20.1
16.02
14.78
10.84
9.47
0 0 10 20 30
PC1 PC2 PC3 PC4 PC5 PC6 PC7
Variance Percent
Figure S2. Photo’s of a diatom mat found on rocks in a high CO2 site (a), algae drifting near the high CO2 site (b and c: zoomed out and in, respectively), and diatoms identified in the clumps (d and e: mainly Biddulphia sp. and Triceratium sp., respectively).
20 cm
80 cm
40 cm
(a)
(b)
(c)
(d)
250 cm
60 cm
(e)
Table S1. ANOVA results of the linear mixed model for log transformed
chlorophyll a. Degrees of freedom (df), F-values (F) and significance probability (Pr) were shown for main effects (‘Site’ and ‘Days’) and interaction.
df F Pr(>F)
(Intercept) 1, 44 16.74 0.0002
Site 1, 5 4.68 0.0829
Days 1, 5 93.49 0.0002
Site:Days 1, 5 0.00 0.9997
Table S2. PERMANOVA table of the pigment composition (Bray Curtis distance).
(999 permutations). Degrees of freedom (df), sum of squares (SumOfSqs), mean sum of squares (MeanSqs), F-statistic (F.Model), coefficients of determination (R2) and significance probabilities (Pr) were shown.
df SumOfSqs MeanSqs F.Model R2 Pr(>F)
Days 1 0.076 0.076 13.217 0.148 0.001
Site 1 0.158 0.158 27.438 0.306 0.001
Days:Site 1 0.011 0.011 1.920 0.021 0.165
Residuals 47 0.270 0.006 NA 0.525 NA
Total 50 0.515 NA NA 1.000 NA
Table S3. ANOVA results of a linear mixed model for the net photosynthesis.
Degrees of freedom (df), F-values (F) and significance probability (Pr) were shown for main effects (‘Site’ and ‘Days’) and interaction.
df F Pr(>F)
(Intercept) 1, 13 225.17 0.0000
Site 1, 5 10.41 0.0233
Days 1, 5 34.29 0.0021
Site:Days 1, 5 0.00 0.9482
Table S4. Fucoxanthin to Chlorophyll a ratios. In case that the several values for each specimen were provided in each study cited (Ref), the minimum, maximum and mean values (Min, Max and Mean) are shown. If single value was reported, the data was provided in the column of Mean.
Specimen Min Max Mean Ref
Himanthalia elongata 0.044 Seely (1972)
Undaria pinnatifida 0.077 Seely (1972)
Laminaria ochroleuca 0.099 Seely (1972)
Laminaria saccharina 0.452 Seely (1972)
Sargassum muticum 0.464 Seely (1972)
Fucus distichus 0.407 Seely (1972)
Macrocystis pyrifera 0.520 0.770 0.645 Colombo-Pallotta et al (2006) Macrocystis pyrifera 0.221 0.671 0.483 Marambio et al
(2017)
Dictyopteris australis 0.064 Verna et al (2017)
Dictyota dicotoma 0.070 Verna et al (2017)
Labophora variegata 0.103 Verna et al (2017)
Padina tetrastromatica 0.121 Verna et al (2017)
Padina gymnospora 0.126 Verna et al (2017)
Spatoglossum asperum 0.141 Verna et al (2017)
Stoechospermum
marginatum 0.070 Verna et al (2017)
Iyengaria stellata 0.158 Verna et al (2017)
Sargassum linearifolium 0.156 Verna et al (2017)
Carpomitra costata 0.010 Desmond et al
(2019) Carpophyllum flexuosum 0.010 0.480 0.245 Desmond et al
(2019)
Cystophora platylobium 0.710 Desmond et al
(2019) Desmarestia ligulata 0.010 0.120 0.065 Desmond et al
(2019)
Dictyota kunthii 0.350 0.510 0.420 Desmond et al
(2019)
Ecklonia radiata 0.120 0.570 0.345 Desmond et al
(2019)
Halopteris sp. 0.010 Desmond et al
(2019) Landsburgia quercifolia 0.640 0.890 0.777 Desmond et al
(2019) Macrocystis pyrifera 0.010 0.380 0.255 Desmond et al
(2019) Marginariella boryana 0.440 0.660 0.523 Desmond et al
(2019) Marginariella urvilliana 0.010 0.940 0.480 Desmond et al
(2019)
Sargassum sinclairii 0.560 Desmond et al
(2019) Spatoglossum chapmanii 0.520 0.560 0.540 Desmond et al
(2019)
Xiphophora gladiata 0.460 0.500 0.480 Desmond et al (2019) Durvillaea antarctica 1.465 5.233 2.817 Mendez et al
(2019)
Mean of Brown algae 0.372
Diatom mat 0.567 0.956 0.657 Wulff et al
(2008)
Diatom mat 1.655 Stief et al (2013
Diatom mat 0.509 1.768 1.000 Wulff et al (2005)
Diatom mat 0.950 1.770 1.360 Sundback et al
(1996)
Mean of Diatom mat 1.168