The Risk Assessment and Uncertainty Understanding (REUU) topic leader is Ian Meadowcroft from the Environment Agency. The need for improved risk assessment methodologies to support better flood risk management was therefore the main driver behind the RASP project. The usefulness of the RASP approach has been demonstrated through a case study and theoretical reasoning.
RASP PROJECT OVERVIEW
Introduction
Project aims
- Links between RASP and other R&D and software projects
National Flood Risk Assessment – RASP HLM has already been used to support the National Flood Risk Assessment (NaFRA and HR Wallingford 2002 and HR Wallingford, 2003) and is currently being further developed to support NaFRA 2004. RASP HLM has also been used to supporting the National Assessment of Defense Needs and Costs – NADNAC (Halcrow and HR Wallingford, 2004). Together, these projects and the RASP HLM (and its successors) provide increasingly useful tools for consistently applied national assessment of risk to support more local decision-making.
RASP’s contribution to achieving Defra’s High Level Targets
FloodSite – Floodsite is a major European funded project coordinated by HR Wallingford and planned to run over the next five years. Floodsite provides an excellent opportunity to develop risk-based management concepts and share approaches and concepts in detail at a European level (see floodsite.net).
UNDERPINNING CONCEPTS
Introduction
Conceptual framework and the notation of a hierarchical assessment
- Overview of the RASP hierarchy and decision-support
- Definition of a flooding system
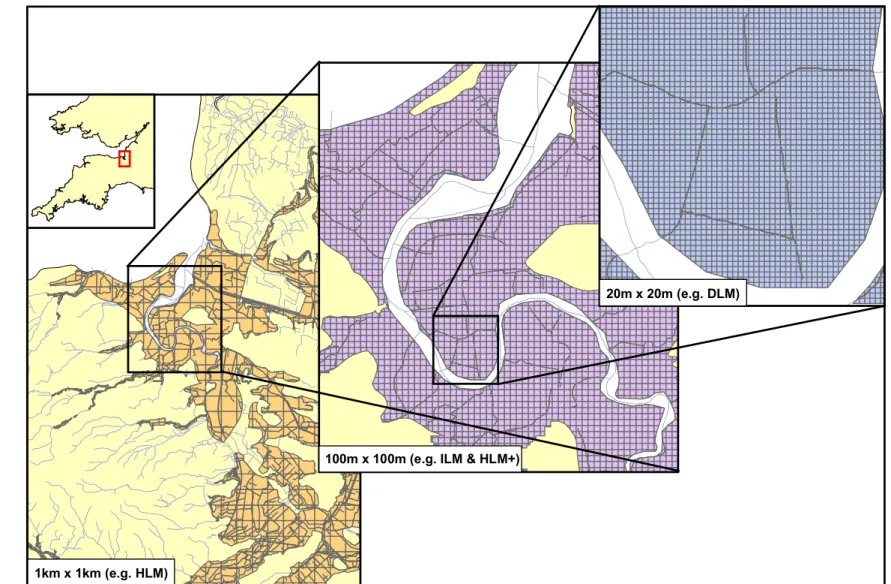
National-scale flood risk assessment can provide consistent information to support flood management policies, resource allocation and monitoring the performance of flood risk mitigation activities. The development of the RASP High Level Methodology was completed in early 2002 and applied through the National Flood Risk Assessment 2002 (HR Wallingford, 2002). An example of the grid approach to impact zone definition is shown in Figure 7.
Definition of the defence system and use of NFCDD .1 Creating a continuous line of defence information
- Defining a defence system
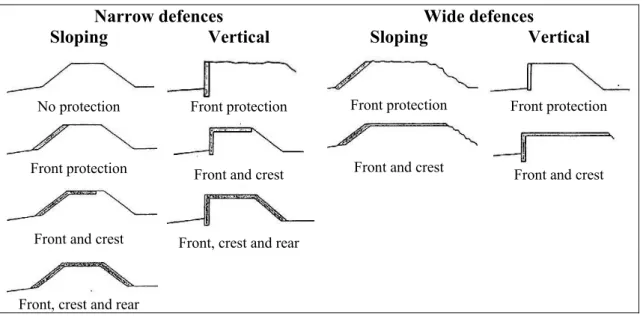
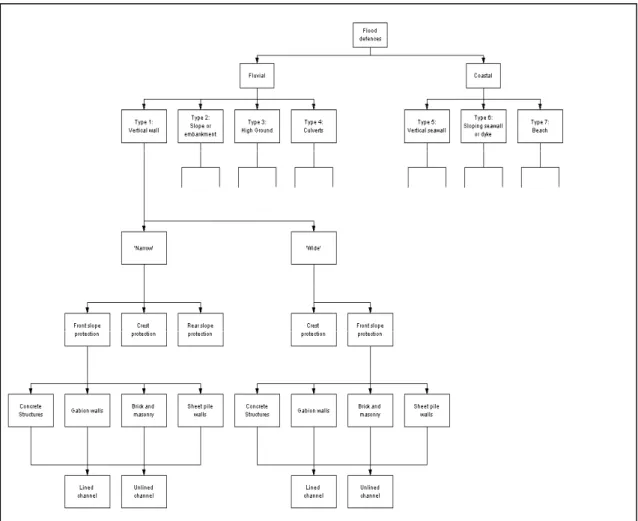
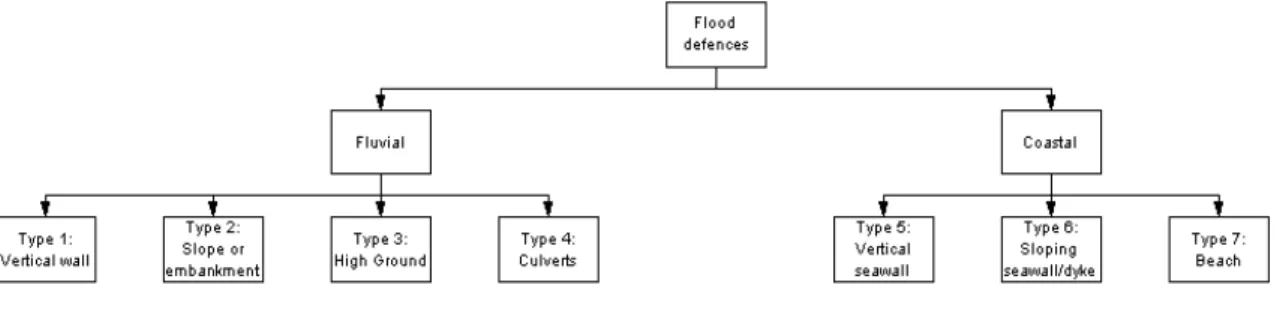
The NFCDD classifies each raised flood defense based on the individual defense components (for example, inward slope, ridge, and outward slope) and their composition (for example, grass or concrete). A simple (but complete in terms of linear defense) classification was developed for the purpose of RASP HLM. Identify which of the seven main classes of RASP defenses (see Figure 4). Note - NFCDD does not currently include a simple descriptor of the type of defense).
Consider the nature of the river channel - is it lined or unlined - which can affect transport and load on the structure. Consider the nature of the coastal defense load – mainly a combination of tidal/river or tidal/wave load. Consider the width of the defense and thus the rear's exposure to potential damage.
Consider the level of protection provided at the front, crest, and rear in the form of surface cover (rock, asphalt, grass, etc.). Consider the presence and influence of any structures within a barrier (e.g. drainage structures) that may affect the performance of the barrier under load. The next levels within the hierarchy look at the level of protection the defense offers.
A wider guard is believed to provide more protection than a narrower guard, as is a guard that is protected on its front slope, crest and rear compared to one without protection.
Vertical river walls
Defence performance and the concept of fragility
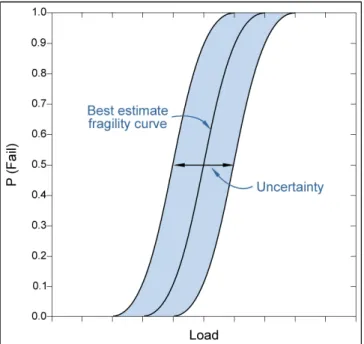
If the failure of a structure is described by a limit state function Z such that Z ≤ 0 represents system failure and Z > 0 represents the non-failure state, then the fragility function is FR(L) = P(Z ≤ 0 | L) where the symbol " |" stands for "given". In the reliability analysis such a conditional probability distribution - in this case the conditional probability of failure of the structure under varying loads - is called. The probability of a defense breaking through in a storm of a certain severity is affected by the type of defense and its condition.
On a national scale, the only information on defense condition is a visual assessment that grades each defense and its components from grade 1 ("very good") to grade 5 ("very poor"). The Environment Agency's Condition Assessment Manual provides benchmark photographs of the main types of defenses in all five conditions. However, the photographs in the Condition Assessment Manual indicate that some of these defenses will provide some resistance to breaching, at least in less severe loading conditions.
Here, the overflow of floodwater into the floodplain is controlled by the severity of the incident and the condition of the dam. Given the lack of field knowledge of defense breaches in loads of known severity for defenses in known pre-storm condition and the simplified condition classification system currently used in the agency, the development of a reliable description of defense fragility is currently very difficult. Improving the approach to condition assessment and inspection will be a prerequisite for improving risk assessment.
This will be an important component of the research undertaken under the PAMS programme, and will necessarily need to be continually updated to reflect the latest research (including both national and international research, eg HR Wallingford, 2004 and Environment Agency, 2004d).
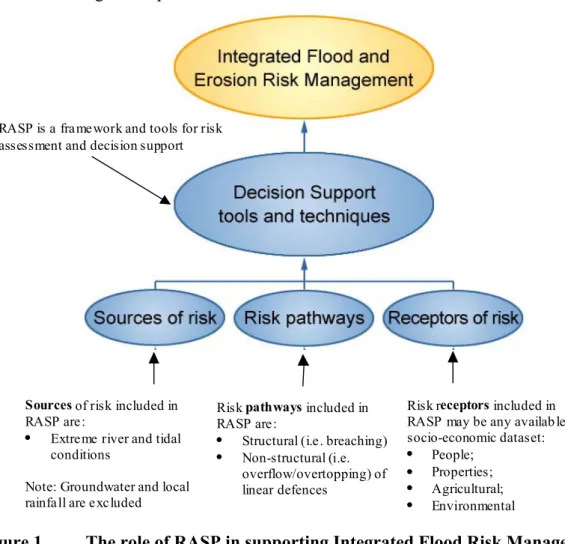
A risk-based analysis framework
Each defense section di is assigned, based on knowledge of its type and condition, a conditional probability of failure (D) for a given load x, P(Di|x), for a range of values of x – the so-called defense fragility as described above in section 2.4 .4. Estimating the probability of occurrence of a scenario where a given number of defenses in a system breach requires information about the dependencies between the variables that describe system behavior, including load and response. Of course, flooding is not just a function of a defense breach; a defense might simply be overpowered.
Therefore, for each protection there are three states that are of interest: not violated but overcome, not violated and not overcome, violated and overcome. To explore all possible combinations for a large system, analyzing such a large number of scenarios would require an excessive amount of computer processing time. However, high-order scenarios (ie scenarios in which a large number of protections in a system all breach) make a small contribution to the total failure probability and can therefore be neglected.
Suppose that in a system with n protection sections, the probabilities of all scenarios with zero to five violations are calculated. If a given point in the flood zone is predicted to flood in t different scenarios, each of which results in a flood depth yk, k = 1,…, t, with the corresponding probability Pk. The probability distribution of inundation depth (Equation (5)) is calculated at the center of each Impact Area and is assumed to apply to the entire Impact Area.
The total expected annual damage for a given area of interest is then obtained by summing the expected annual damage for each area of influence within that area.
Introduction
Common framework of analysis
- Source terms – Predicting incident loading conditions
- Pathway terms – Infrastructure performance
- Pathway terms – Estimating flood spreading inundation
- Integrating sources and pathways – establishing flood inundation probability
- Receptor terms – Estimating flood damage and flood risk
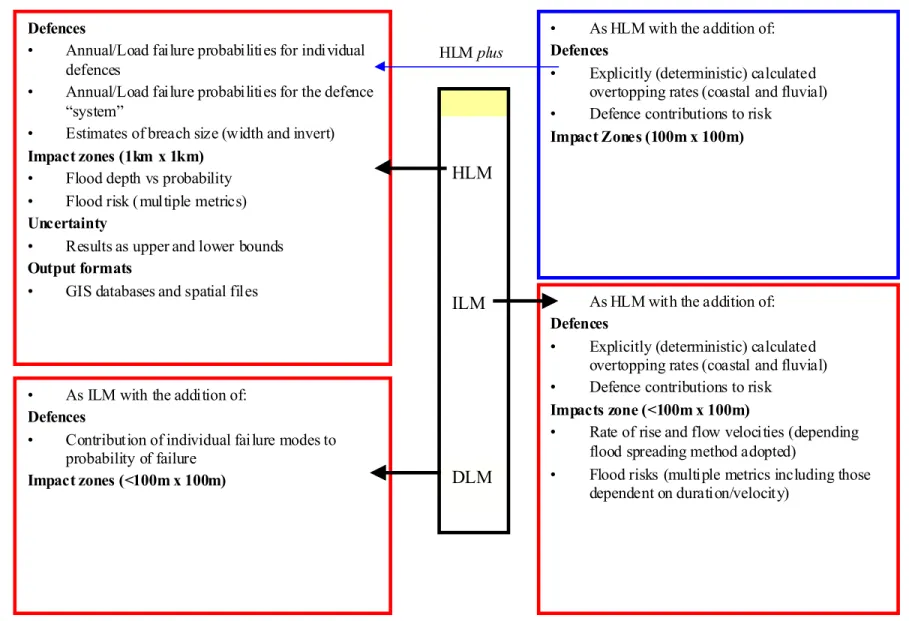
Note: RASP methods are independent of the risk metric used and can be adapted to any descriptor where the relationship between depth (or at more granular levels speed/duration) and damage is known. Perhaps the most important feature of RASP analysis is its ability to incorporate defense performance into flood risk analysis. Figure 15 summarizes the differences in approaches to determining defense fragility at each level.
Examples of defense fragility calculated from each level of analysis are shown in Figure 17a, b and c. Overall comparison of HLM and HLM+ suggests that expert judgments often (but not uniformly) overestimate the probability of failure of a defense for low return period events and underestimates the increase in failure probability with increasing load (therefore underestimating the probability of failure at higher loads). This simply reflects the description of the loading conditions in terms of a common population of wave and water level conditions available at the more detailed levels.
Note: The x-axis shows load in terms of the Defense SoP multiplier.). Resorting to a detailed DEM and focusing on a region or reach allows a gradual change in the complexity of the flood propagation model to accommodate the ILM. Note: Example from the RASP HLM analysis for the Parret catchment conducted in support of NaFRA 2002.
At more detailed levels, the grid resolution of the impact zones improves significantly, but the format remains the same). The main differences between the results of increasingly detailed analyzes are the level of resolution and the reliability of the results. However, the flood spreading model selected by the user will determine the reliability of the flood parameters.

HLM HLM
ILMILM
DLMDLM
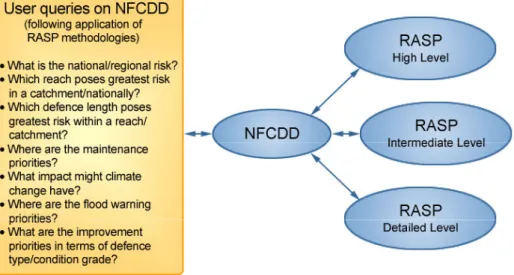
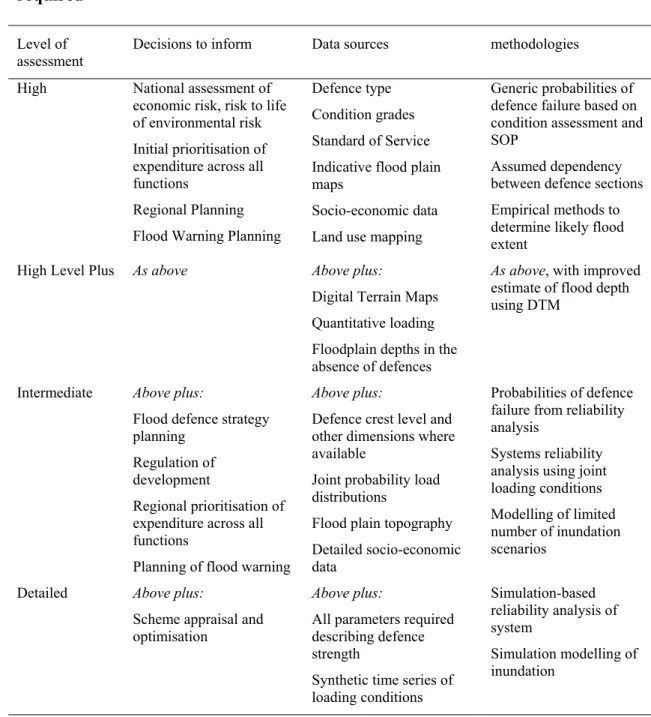
As seen in Table 1, the decisions supported by RASP span the current flood management functions of the Environment Agency. An indication of the contribution to flood risk or risk reduction made by each defense within the defense system. It is also envisaged that future updates of the Catchment Flood Management Planning Guidance, Shoreline Management Guidance and supporting modeling decision support tools will use the RASP methodologies.
The figure above depicts the structure of the proposed performance-based assessment management system - RASP methodologies will be used to provide the "system analysis" element of PAMS. Providing support for Catchment and Coastal Management/Coastal Defense Planning Large scale models are already applied to flood risk assessment as part of the Catchment Flood Management Plan (CFMP)/Coastal Management Plan (SMP) and the Coastal Strategy study process and supported by the Decision Support Framework Modeling (MDSF - Environment Agency, 2003). The level of detail will, of course, depend on the nature of the development sites.
It is envisaged that a key element of this work will be to extend the RASP methods to account for impacts occurring beyond natural floodplains. SFRAs provide flood risk assessments associated with a statutory development plan so that appropriate restrictions on developments can be incorporated into planning authorities. 4 This depends on the purpose of the assessment, which is defined during Process 1 From.
The need for improved risk assessment methodologies to support better flood risk management was the main driver behind the RASP project. All levels of RASP risk assessment methodologies reflect the availability of data and the limitations of the temporal and spatial scales that apply to the analysis. The inundation of a floodplain (and the spread of water over the floodplain) following an overflow or spillover event.