Food waste accounts for around 18% of municipal solid waste in Austria, but is a relatively new topic for waste prevention initiatives. The literature review discusses all types of food waste and their relation to households in an international context. Patterns of food consumption and factors influencing the amount will provide basic information about the social context of food waste.
The research section of this thesis focuses on Austria and two specific types of food waste that account for 6-12% of municipal solid waste: unopened food in original packaging and open, partially used food. The qualitative interviews were supported by a quantitative analysis of expired products found in the household and a questionnaire on the socio-demographic background of the participants. UK (WRAP, 2008) and this study..54 Table 6: Example of expired products found in households.
INTRODUCTION
LITERATURE REVIEW
Food consumption
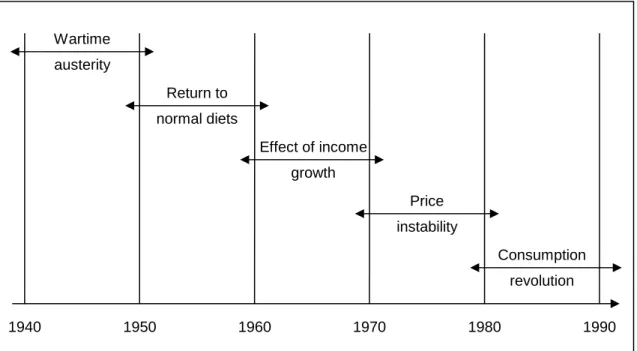
- Changes in food supply and prices
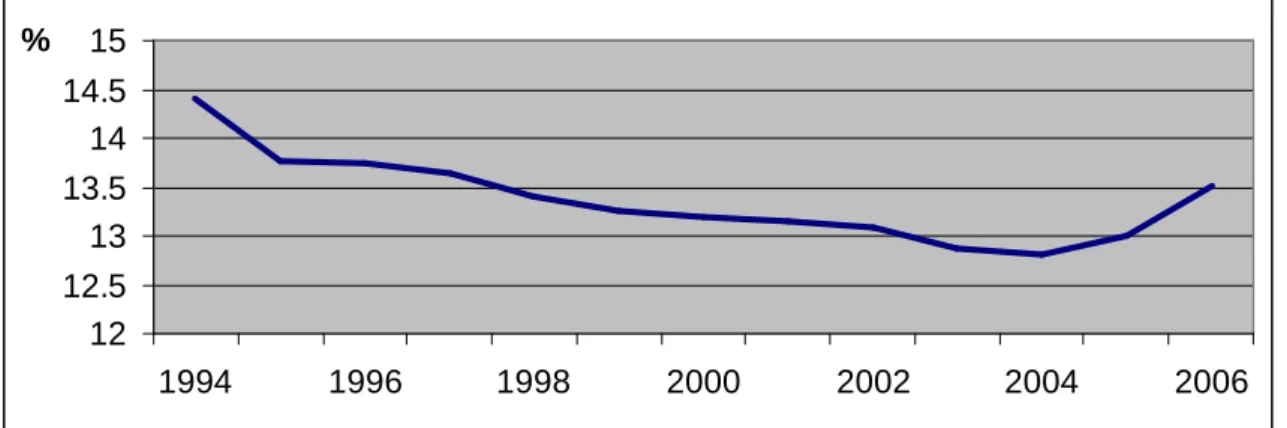
- Household expenditure on food
- Food psychology
- Food shopping
- Food patterns and cooking habits of households
- Quality and durability of food
Everything is available for consumption at any time until the last minute of opening hours and therefore the consumer loses the link with the producers of his food. Time is one of the most important factors, not only during shopping, but also during food preparation. Although it is still common to eat at least one hot dish per day, which half of the population (47%) eats for lunch (Brunner et al., 2007).
Families with children tend to have more regular mealtimes and child-specific food, which depends on the age of the children and their taste preferences. Expiration day and month if the product's shelf life is less than 3 months. In the UK, additional statutory information about any special storage conditions (eg "keep refrigerated"), the manufacturing process and instructions for the use of the food must be printed on the packaging under the "Food Labeling Regulations" 1996 (Food Standards Agency, 2008b).
Food waste
- Food losses
- Types and amounts of food waste from households
- Public awareness of food waste
- Factors influencing the amount of food waste generated in households
- Demographics
- Consumption behaviour and food patterns
- Other factors
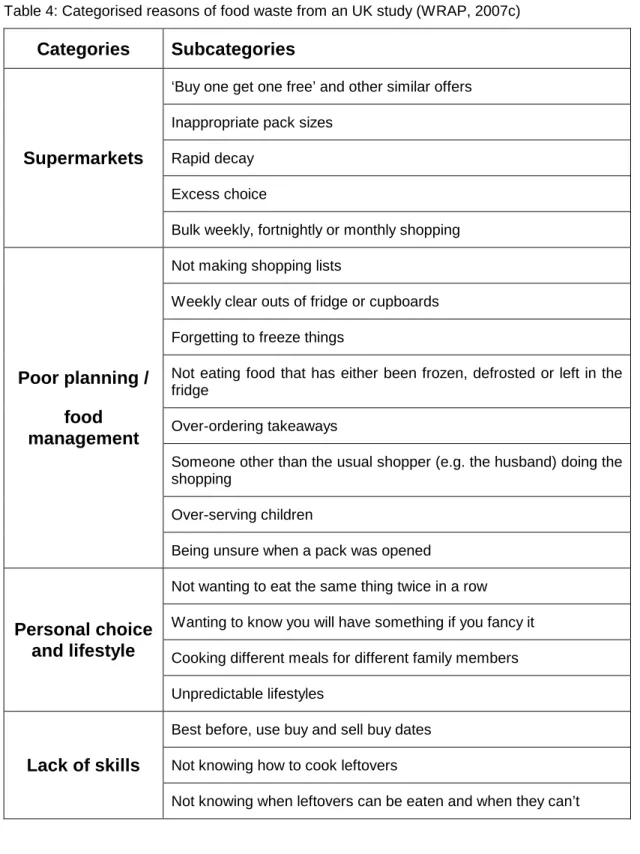
- Reasons for household food waste
- Measures for preventing food waste from households
- Methods for investigating food waste in households
- Households involved in the study
- Households not involved in the study
- Case study: Household food waste in the UK
- Methods used
- Results
The impact of income on the amount of food waste is evaluated differently in the literature. Households in rural areas produce less food waste than in urban areas (Salhofer et al., 2007). Composition analyzes are the main method to provide information about the amount of food waste generated, but no information is collected on the reasons.
It shows the extent of the food waste problem arising from UK households. The types, amounts, costs, causes and disposal practices of household food waste should be investigated with this research. The amount of food waste was significantly related to household size (88%), age (85%) and household composition (67%).
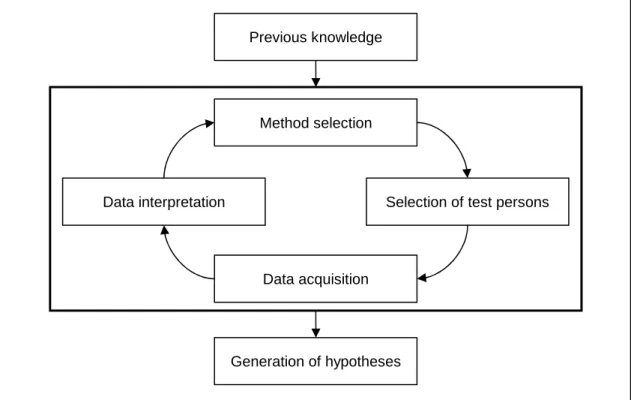
Methodology
- Method selection
- Qualitative research in general
- Selection of test households
- Sequence of interviews and data acquisition
- Qualitative, problem-oriented interviews
- Data interpretation
- Qualitative research problems
This concept should increase the diversity of participants according to their socio-demographic characteristics (compare Appendix C). Most of the potential participants were informed in advance by the person who conducted the interview beforehand. After the guided part of the interview, a search for potentially wasted food was conducted together with and with the consent of the participants.
Refrigerators, cupboards and other parts of the storage space (excluding freezers) were searched for products that have expired or are no longer eaten. At the very end of the interview session, a short questionnaire was used to obtain socio-demographic information about the test subject and to ask several other questions related to eating habits, consumption and disposal patterns or food storage (compare Appendix E). In terms of the narrative continuity and flow of the discussion, it was important to ask the right questions at the right time.
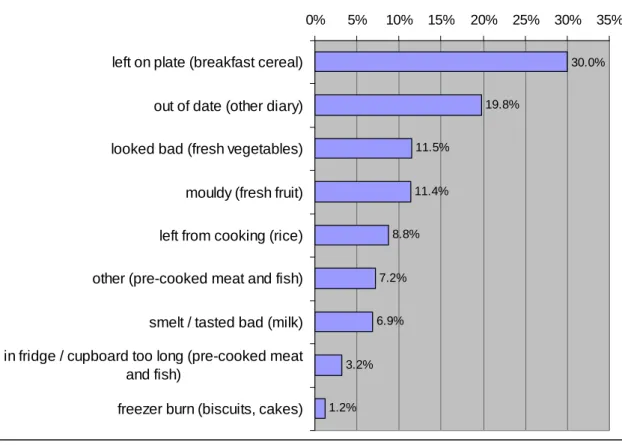
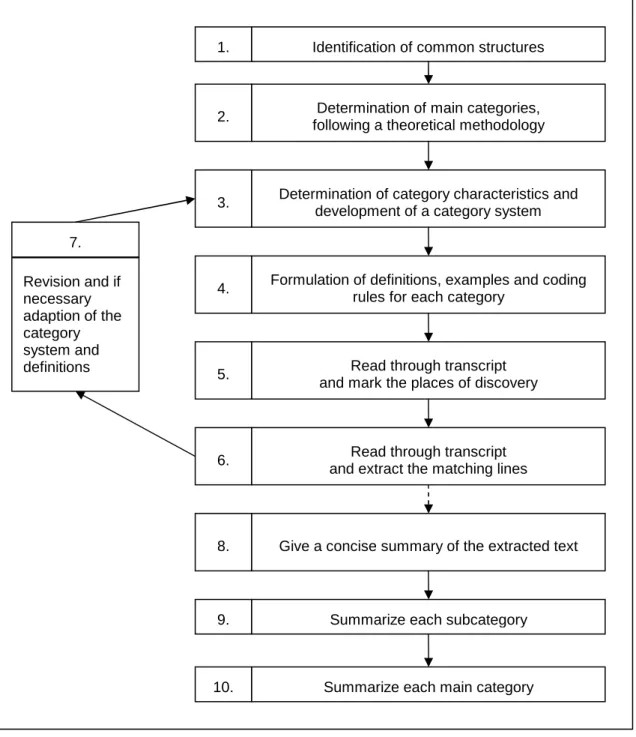
At the end of the interview, a free and open style of questioning was changed to a more direct one if necessary. Therefore the rules must be clearly defined, reliable and derived from the transcript (compare Appendix G). The counts have been added to give a ranking of the importance of the reasons investigated (compare Appendix G).
An attempt was made to ensure that the interview situation took place in a relaxed atmosphere (the participants' living room or kitchen) and anonymity was guaranteed. The common stimuli-response model did not apply because everything asked during the interview is evaluated and thus the answers are not always causal outcomes of the questions. It is more realistic to use a stimulus – person – response model that emphasizes that the answers are influenced by the emotions and perception of the interviewee who might think: “What does the interviewer expect from me and what impressions am I giving him?” (Atteslander, 2008) In practical terms, the digital voice recorder was a psychological stressor.
Since it is not only what is said that is important, but also how, the demeanor and appearance of the interviewer can influence the answers.
PAPER FOR PUBLICATION
- Introduction
- Methodology and aim
- Results
- Content analysis
- Quantitative analysis
- Socio-demographic background
- Discussion
- Conclusion
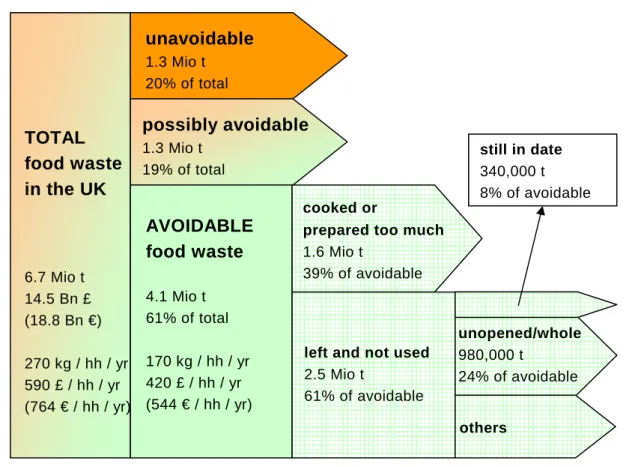
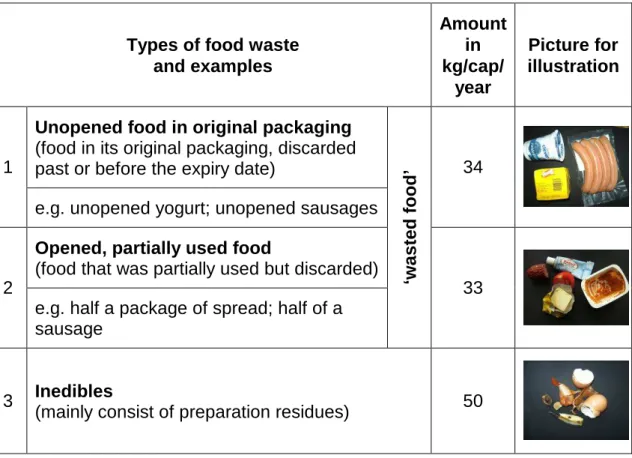
The paper focuses on unopened foods in their original packaging and opened, partially used foods with the aim of providing a range of possible reasons why these two types of food waste are discarded in households. Food waste causes several problems throughout the waste management chain, including odor, contamination of containers and vehicles, pests or liquid and gaseous emissions. Composition analyzes showed that food waste accounts for approximately 17.6% of municipal solid waste in Austria (see Figure 9) (Schneider and Obersteiner, 2007).
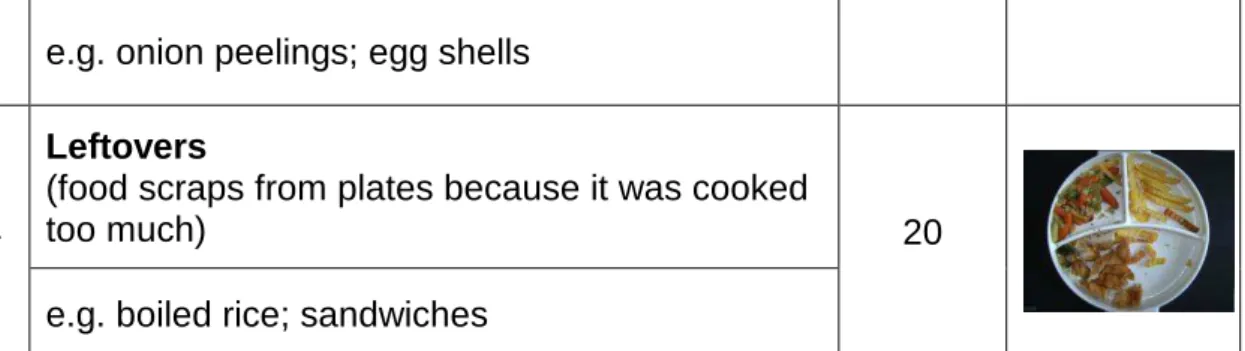
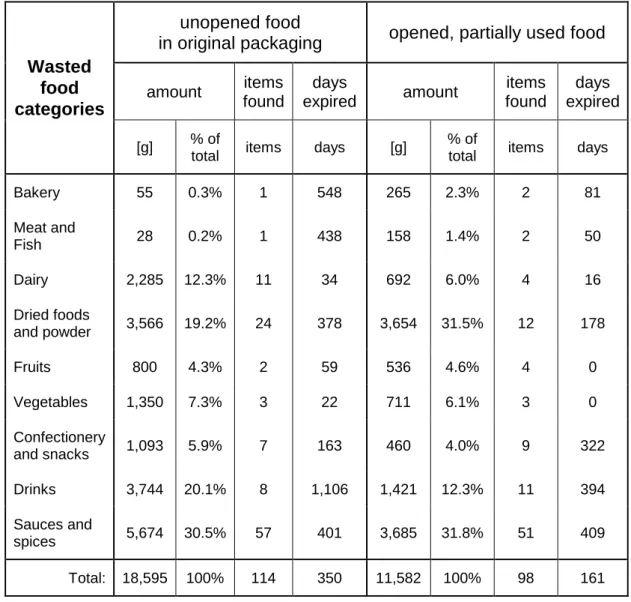
Leftovers: Food waste due to excessive cooking quantities (e.g. 1 kg of cooked rice for two people). Registration of expired products found in storage (except freezers) on the day of the visit. One household indicates that perishable products in the refrigerator subsequently spoil due to a power outage.
Special offers in supermarkets were partly responsible for food waste because they entice consumers to buy bulk discounts. Overlooking food items in the storage area is another reason for food waste (for example, if the refrigerator was restocked from the front and older products were moved to the back). With some of the items found in the storage area (except freezers) it was difficult to distinguish between these two types of food waste.
Less food waste occurs as household members spend more time at home (Lebersorger 2004). A study in Great Britain (WRAP, 2007b) shows that supermarkets mainly increase the amount of food waste by selling low-quality pre-packed products, having inappropriate pack sizes or an irrational discount policy. Quantitative analysis of expired products showed that more originally packaged than partially used foods were found in storage.
Further research is needed into which measures will reduce food waste in the first place and how they can be implemented or monitored.
Mithilfe zeitgenössischer Archäologie und angewandter Anthropologie den Lebensmittelverlust im amerikanischen Lebensmittelsystem verstehen. www.communitycompost.org/info/usafood.pdf. Entwicklung des Lebensmittelsektors von 1995 bis 2002“ („Zweiter Österreichischer Lebensmittelbericht. www.nachhaltigkeit.at/monthly/2004-12/pdf/Lebensmittelbericht_2.pdf. Abfallwirtschaft – Denken in natürlichen Systemen bei Lechner P. ed), Kommunale Abfallwirtschaft, Facultas Universitätsverlag, Wien, S. „Motivationsmodelle nachhaltiger Ernährung“.
Trends in online shopping – a global Nielsen consumer report”. www.acnielsen.at/site/documents/GlobalOnlineShoppingReport Feb08.pdf. Food choice and the demand for food", in Marshall D. ed), Food choice and the consumer, The University Press, Cambridge, pp. Food waste in household residual waste - regional and socio-economic differences". ed), Eleventh International Waste Management and Landfill Symposium, 1.-5. October 2007, St. Margharita di Pula, Cagliari, Sardinia, Italy.
APPENDICES
Expired foods found in households were redirected into nine main categories and various sub-categories, each representing a product group. There are seasons for certain products which are not used the rest of the year. However, manuscripts that only consider laboratory experiments, without a discussion of the practical, environmental and economic implications of the research presented, are excluded from publication in the journal.
Upon acceptance of a manuscript for publication, it is expected that the authors will also act as reviewers of future manuscripts in the same research area as the manuscript submitted to the journal. In general, manuscripts should be organized in the following order: Title (must be clear, descriptive, and concise), Name(s) of author(s), Full mailing address(es) of affiliations, Full telephone and fax number of corresponding author (plus current address(es) of author(s) if applicable), Full correspondence address, Abstract, Keywords (index terms), Introduction, Material Studied, Area Descriptions, Methods, Techniques, Results, Discussion, Conclusion, Acknowledgments, References, Tables and figures. The title of the article should be short and listed on a separate page, together with the names and addresses of the authors, so that the publisher can prepare this text in the correct font and formats.
All publications referenced in the text should be presented in a list of references following the text of the manuscript. If there are three or more authors, use the first author followed by 'et al.' in the text. The manuscript should be carefully checked to ensure that the spelling of the authors' names and dates in the text is exactly the same as in the bibliography.
Formation and disappearance of biplenyl derivatives in the photocatalytic transformation of 1,2,4-trichlorobenzene to titanium oxide. In the case of publications in a language other than English, the original title must be preserved. References to unpublished data and "personal communications" need not be cited in the reference list, but may be cited in the text.
Photographs, graphs, and diagrams are all called "figures" and must be numbered consecutively in the order in which they are referenced. Color images in the print edition can only be accepted if the authors bear the full costs. However, if you submit usable color figures with your accepted article, Elsevier will ensure that these figures appear in color on the Internet (e.g. ScienceDirect and other sites) at no additional charge, regardless of whether these illustrations are reproduced. in color in the printed version.