LINCOLN
U ^f I V E R S 1 T Y ^^
Tf IT *> m f f ir J N • I « O A » T * kt
Institute of Sustainable Economic Development, BOKU University, Austria Agribusiness and Economics Research Unit, Lincoln University, New Zealand
Single Farm Payment in the European Union and its Implications on New Zealand Dairy and Beef Trade
A master thesis submitted in partial fulfilment of the requirements for the degree of
Master of Natural Resource Management and Ecological Engineering
by Klaus Kogler
Supervised by
o. Univ. Prof Dr. Markus F. Hofreither Prof Caroline Saunders, BSc(Hons), PhD
Dr. Bill Kaye-Blake
Vienna, January 2007
Abstract
Dairy products and beef are New Zealand's main export commodities, accounting for 22% of total merchandise exports (Statistics New Zealand, 2005). The European Union (EU) is commonly known for distorting international trade in these products through subsidised production and exports. This leads to lower world market prices and hence lower export revenues for New Zealand. On the other hand. New Zealand benefits from high domestic EU prices through preferential access to the butter, cheese and sheepmeat markets.
The Common Agricultural Policy (CAP) of the EU has already undergone several reforms in recent years. The 2003 CAP reform replaced most of the coupled direct support schemes by a Single Farm Payment (SFP), which will be mainly delivered to farmers irrespective of what they produce (hence 'decoupled' from production). The level of decoupling differs among the EU Member States. This master thesis looks at the implementation of the SFP across Member States and how far it has been decoupled. The expected changes in the European Union's and New Zealand's trade in dairy products and beef resulting from the 2003 reform of the CAP are simulated, using a partial equilibrium trade model (Lincoln Trade and Environment Model; LTEM).
The hypothesis is that a higher degree of decoupling of direct payments leads to a lower production and less EU exports. Hence, opportunities for NZ exports of dairy products and beef could increase. The results from the dairy sector are the opposite of the hypothesis: EU exports in dairy products are predicted to increase following the reform and this implies New Zealand exports to fall by 1.5% to 2.0%. This is due to a rise of the internal milk production quota in the course of the reform which outweighs the impact of the decoupling of the dairy premium. In the beef sector, EU outputs will be reduced as a result of the 2003 CAP reform.
The market changes in the EU, however, are only partly transmitted to New Zealand because other beef producers also benefit. The returns to New Zealand beef producers increase by more if fill! dccou^^lin*^ in ?J! EU Member States is 2""!ied then in case of onh' "srtia!
decoupling.
Key words: Single Farm Payment, European Union, New Zealand, Common Agricultural Policy, direct payments
Kurzfassung
Einheitliche Betriebsprämie in der Europäischen Union und ihre Auswirkungen auf Neuseelands Handel mit Milchprodukten und Rindfleisch
Milchprodukte und Rindfleisch sind Neuseelands Hauptexportgüter. Zusammen machen sie 22% der Güterexporte aus (Statistics New Zealand, 2005). Die Europäische Union (EU) ist in Neuseeland allgemein bekannt, den internationalen Handel mit diesen Produkten durch Produktions- und Exportsubventionen zu verzerren. Dies führt zu niedrigeren Weltmarkt- preisen und daher zu niedrigeren Exporterlösen für Neuseeland. Andererseits profitiert Neuseeland durch hohe Preise in der EU wegen eines bevorzugten Marktzutritts für Butter, Käse und Schaffleisch.
Die Gemeinsame Agrarpolitik (GAP) der EU wurde im Laufe ihrer Geschichte bereits mehrmals reformiert. Die GAP-Reform 2003 ersetzte einen Großteil der gekoppelten Direkt- zahlungen durch eine Einheitliche Betriebsprämie (EBP), welche den Landwirten unabhängig von ihrer Produktionsmenge ausbezahh wird (daher 'entkoppelt' von der Produktion). Die Umsetzung dieser Reform erfolgte in den einzelnen Mitgliedstaaten der EU verschieden - vor allem hinsichtlich des Grades der Entkoppelung gibt es Differenzen. Diese Diplomarbeit berücksichtigt die Einführung der EBP in den Mitgliedsstaaten und inwieweit sie entkoppelt ist. Die erwarteten Veränderungen im Handel mit Milchprodukten und Rindfleisch für die EU und Neuseeland werden mit Hilfe eines partiellen Handelsmodells (Lincoln Trade and Environment Model; LTEM) simuliert.
Die Hypothese ist, dass ein höherer Grad der Entkoppelung von Direktzahlungen zu einer geringeren Produktion und geringeren Exporten aus der EU führt. Daher könnten Neuseelands Exporte in Milchprodukten und Rindfleisch ansteigen. Die Modellergebnisse im Milchsektor sind gegensätzlich zu der Hypothese: EU Milchexporte werden als Folge der Reform sogar ansteigen und das bewirkt einen Rückgang der Exporte neuseeländischer Milchprodukte von 1,5 bis 2%. Der Grund dafür ist der Anstieg der internen Milchproduktionsquote im Zuge der Reform, welcher die Effekte der Entkoppelung der Milchprämie übertrifft. Im Rindfleisch- sektor wird als Folge der 2003 Reform die Produktion in der EU zurückgehen. Jedoch werden sich die Marktveränderungen in der EU nur teilweise auf Neuseeland auswirken, weil andere Länder ebenfalls profitieren. Die Erlöse für Neuseelands Rindfleischproduzenten steigen mehr, wenn die Rinderprämien in allen EU Mitgliedstaaten vollständig entkoppelt werden, als im Falle einer partiellen Entkoppelung.
Acknowledgements
This master thesis reflects the contributions and support of many people.
First, I would like to express my gratitude to Professor Caroline Saunders and Dr Bill Kaye- Blake from the Agribusiness and Economics Research Unit (AERU), Lincoln University, who enabled me to do this work, for their guidance, and encouragement throughout my research period.
My sincere thanks also go to Professor Markus Hofreither from BOKU University who gave me the opportunity for this research; for his flexibility and for his invaluable help in organising my studies.
I am very grateful to the organisers of the NaRMEE-Program for providing the unique chance to do this joint Master degree at two Universities on the opposite sides of the world and for providing the scholarship.
Special thanks to my research colleagues and office mates Ellen, Diogo, Yawen and Antoine for the encouraging discussions about the research and for the fun we had together which created a unique research life.
I am thankful to all my international friends in New Zealand for the great times which were important to build up the necessary energy for the studies.
I also want to express my thanks to my sister Eva and my friends at home in Austria for the mental support from the other side of the globe in difficult times.
My special word of thanks is to my parents for their financial and emotional support of my studies.
Finally I want to thank God that he gave me the opportunity to do all this and for guiding my life.
Table of Contents
1. Introduction 1 1.1 Hypothesis 2 1.2 Research Objectives 2 1.3 Organisationof the Master Thesis 3 1.4 Literature Review 3
2. Agricultural Policy in the European Union and New Zealand 8 2.1 The Common Agricultural Policy of the EU: History and Objectives 8 2.2 Direct Support Schemes under the CAP 13 2.3 Implementation of the 2003 CAP Reform 16 2.4 The Agricultural Policy in New Zealand: History and Objectives 19 2.5 CAP and New Zealand-some Conclusions 23
3. Dairy and Beef Sectors in the EU and NZ 25 3.1 Main Characteristics of the Dairy Sector in the EU and NZ 25 3.2 International Trade in Dairy Products 27 3.3 Main Characteristics of the Beef Sector in the EU and NZ 32 3.4 International Trade in Beef 32
4. Methodology and Scenario Descriptions 36 4.1 The Lincoln Trade and Environment Model (LTEM) 36 4.2 Treatment of the Decoupled SFP in the Model 38 4.3 Data Sources 41 4.4 Scenario Description 42
5. Results and Discussion 44 5.7 English Implementation Scenario 44 5.2 Austrian Implementation Scenario 46 5.3 French Implementation Scenario 46 5.4 Complete Liberalisation Scenario 47
6. Summary and Conclusions 48 6.1 Limitations 49 6.2 Contribution to the Literature 50 6.3 Suggestions for Further Research 50 6.4 Policy Implications 50
7. References 52 8. Appendix 59
List of Tables
Table I: European milestones 8 Table 2: National implementation of the 2003 CAP reform in selected countries 17
Table 3: Typical herd size, average milk production per cow, milk production costs
and producer support for milk in the European Union and New Zealand 26 Table 4: Scenario assumptions about different degrees of decoupling in EU Member
States 43 Table 5: Change in producer returns from the market (%) in the different scenarios,
compared to the reference scenario 44
List of Figures
Figure 1: The path of CAP expenditure from 1980 to 2003 13
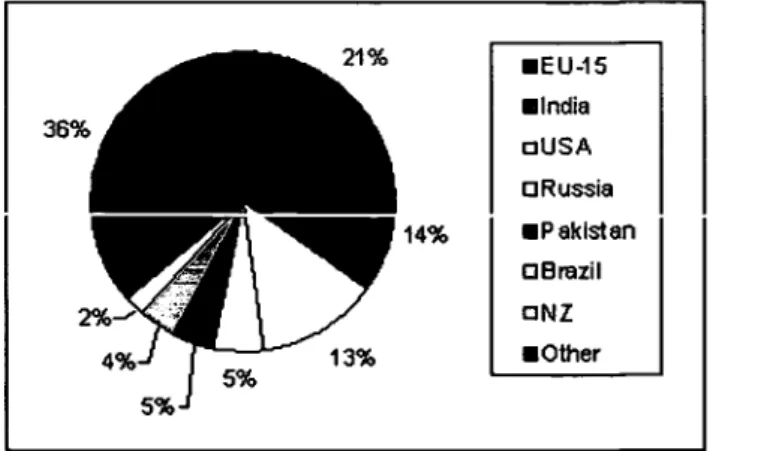
Figure 2: Shares of the top 6 dairy producers (+ New Zealand) on world production
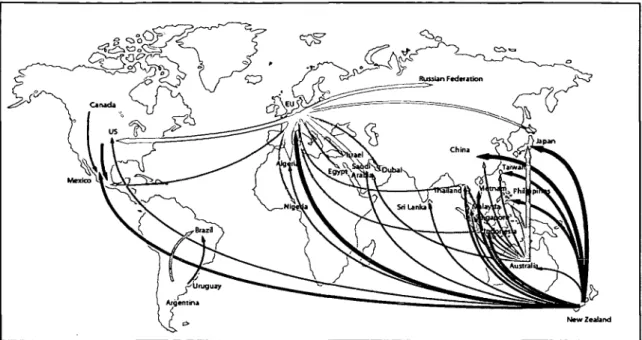
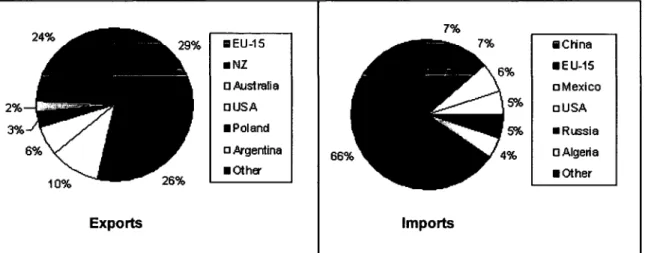
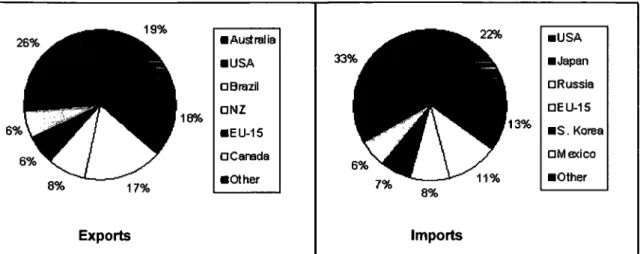
in 2004 27 Figure 3: Major dairy trade flows (>= 250,000 milk equivalents) 29 Figure 4: Shares of the top 6 dairy exporters and importers on world trade in 2003 29
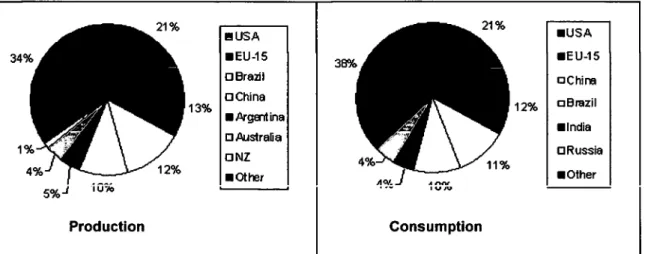
Figure 5: Shares of the top 6 beef producers (+ New Zealand) and consumers on
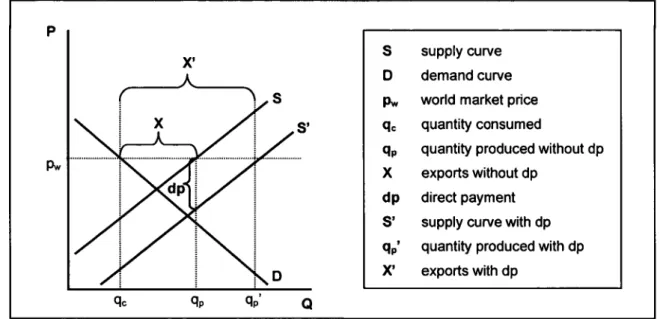
world production and consumption in 2003 33 Figure 6: Major beef trade flows 34 Figure 7: Shares of the top 6 beef exporters and importers in 2003 35 Figure 8: Effects of a coupled direct payment on an exporting nation 40
TTj n. A .1 :__ i 1 i_i •I : 4.1 cc•4. f • •••i 1 ^:^••<. ••.,.»,•^4.
in the importing nation (EU) on the exporting nation (NZ) 40 Figure 10: The path of calculating the direct payments (DPs) used in the different
scenarios 42
1. Introduction
Dairy products and beef are New Zealand's main export commodities, accounting for 22% of total merchandise exports (Statistics New Zealand, 2005). The European Union (EU) is commonly known for distorting international trade in these products through subsidised production and exports. This leads to lower world market prices and hence lower export revenues for New Zealand (NZ). On the other hand, NZ benefits from high domestic EU prices through preferential access to the butter, cheese and sheepmeat markets.
Both the EU and NZ are major players in the international dairy and beef markets. It can be expected that a significant change in production and trade in one nation will affect world trade and hence the other nation. Dairy and beef exports from the EU result from supported production and are mainly subsidised, whereas the NZ agricultural sector is liberalised. The agricultural sector in the EU is regulated by the Common Agricultural Policy (CAP).
The CAP has already undergone several reforms in recent years. It is moving from a mainly market price supporting policy towards a more comprehensive agricultural environment policy. Besides internal reasons, another main driving force of the CAP reform process is international pressure placed on the EU in the Doha Round negotiations of the World Trade Organisation (WTO). The argument is that EU agricultural subsidies distort production and trade of agricultural commodities (Binfield et al, 2004). The redirection of agricultural support from market price support to direct aids has started in the McSharry reforms of 1992.
A fiiture objective is the complete shift over to non-production-related farm assistance across all CAP-covered products (CTA, 2006). An important step towards this objective was the 2003 CAP reform (also referred as the 'Luxembourg Agreement' or 'Fischler reforms').
The 2003 CAP reform replaced the coupled direct support schemes by a Single Farm Payment (SFP) and cut - at least partially - the link between support and production. The SFP is delivered to farmers independent of what and how much they produce (hence 'decoupled' from production) and it is based on historical entitlements. Economic theory suggests that if coupled subsidies are replaced with payments that are totally decoupled from production, then production should fall to a level that would exist without any subsidies (Andersson, 2004).
However, the SFP is implemented in different ways across the Member States of the EU.
Member States could choose individually to maintain a limited link between direct payment and production.
This master thesis assesses the implementation of the SFP across Member States and how far it has been decoupled. The expected changes in the European Union's and New Zealand's production and trade in dairy products and beef resulting from the 2003 reform of the CAP are simulated, using a partial equilibrium trade model (Lincoln Trade and Environment Model; LTEM).
1.1 Hypothesis
A higher degree of decoupling of direct payments leads to a lower production and less EU exports. Hence, opportunities for NZ exports of dairy products and beef could increase.
1.2 Research Objectives
The main objective of this master thesis is to look at the implementation of the SFP across Member States and assess the implications of the CAP reform on EU and NZ dairy and beef sectors. The specific objectives include:
Objective I: Comparison of the Agricultural Policy System in the EU and NZ
NZ's free-market reforms in the 1980s brought a great change from a protected agricultural sector to an almost completely liberalised one. Although there have been several reforms of the CAP in recent years, European agriculture is still being subsidised. A literature review about the history of the European Union's Common Agricultural Policy and New Zealand's agricultural policy is carried out to compare both systems.
Objective II: Dairy and Beef Market Analysis
The main characteristics of the international dairy and beef markets are analysed, with the focus on the EU and NZ.
Objective HI: Development of Scenarios
Scenarios are developed for different implementation schemes of the 2003 CAP reform, based on the actual implementation of three Member States. There should be one Member State which maximises decoupling, one which minimises decoupling and one in between.
Objective IV: Trade Modelling
This involves the simulation of the scenarios with the Lincoln Trade and Environment Model (LTEM) and calculation of the changes in producer returns in the EU and NZ dairy and beef sectors.
1.3 Organisation of the Master Thesis
First, Chapter 1.4 gives an overview about the present literature analysing the implications of EU agricultural policy on NZ and the effects of the 2003 CAP reform, particularly on the dairy and beef sectors. Chapter 2 summarises the agricultural policy in the EU and NZ, with a focus on the historical development and the objectives. Further details of the 2003 CAP reform are also explained in this chapter. This is followed by a description of the dairy and beef sectors in the EU and NZ and the international trade in dairy and beef In Chapter 4 follows a description of the methodology used to answer the research question. A partial equilibrium trade model (Lincoln Trade and Environment Model) is applied to simulate the effects of the CAP reform on NZ agriculture. The scenarios used for the trade modelling are also described in this chapter. Chapter 5 shows the results of the trade modelling and discusses them with other studies. Finally, in Chapter 6, the conclusion summarises the results and suggests possible policy implications.
1.4 Literature Review
The Common Agricultural Policy of the European Union and its reforms are widely discussed in the literature. There are a number of relatively recent studies analysing the impact of the CAP reforms on the agricultural sectors of countries and regions around the world, but not many publications address New Zealand in particular.
Saunders & Mayrhofer (2003) investigated the implications of change in EU agricultural policy for NZ trade; in particular the development of agri-environmental policy, using the Lincoln Trade and Environment Model (LTEM). This study was conducted before the introduction of the SFP scheme, but includes a very similar scenario as the 2003 CAP reform was at a proposal stage at that time (called Mid-Term Review of the Agenda 2000 reforms).
Saunders & Mayrhofer found that dairy production in the EU will increase with the CAP reform and this has a negative impact on NZ for two reasons. Firstly, the lower internal prices in the EU cause the returns to NZ from its preferential access to fall. Secondly, higher
production in the EU has a negative impact on world prices causing returns to NZ from other markets to fall as well.
Similar results are presented by Saunders (2005). In this study, the impacts of Agenda 2000, the Mid-Term Review and the EU agri-environmental programmes on the EU and NZ were assessed. The Lincoln Trade and Environment Model was used to simulate the impact on the dairy sectors of the EU and NZ of four different policy scenarios. The results state that EU milk prices will fall by 8% over the period 1998 to 2010 as a result of the Agenda 2000 reform. The internal production quota for milk in the EU still binds even though it increases by 2.5% over the period. The Mid-Term Review will decrease EU milk producer prices even more. However, as before, the level of production in the EU actually rises due to the increase in the internal production quota, which even at the lower prices still binds. This has again the two negative effects on NZ, mentioned in the previous study. The introduction of agri- environmental policies, conversely, causes internal EU prices to rise as the level of production this time is constrained by production practice. NZ prices for raw milk rise by 5-13% with increases in NZ production of 5-13%.
Saunders et al. (2006) analysed global agricultural trade policy reforms and their impact on the EU, China and NZ, using the Lincoln Trade and Environment Model. Their results show that a reduction of export subsidies and tariffs by 50% all over the world results in an universal decrease in producer prices and production in the EU for livestock products. Price reductions are particularly significant for beef (38.2%). In this scenario, the EU switches from being a net exporter of beef, cheese and skim milk powder to being a net importer. The impact of the reduction of export subsidies and tariffs across all countries leads to benefits for the NZ livestock sector. NZ gains most if all countries completely liberalise (complete removal of all countries' export subsidies and tariffs in 2005). Another scenario simulated an increase in the milk production quota. In this case, prices for dairy products in the EU decrease, but production in the EU increases as a result of the increase in production quota. NZ reduces dairy production and NZ exports decrease.
The milk production in the United Kingdom (UK) following the 2003 CAP reform was modelled by Colman & Harvey (2004). They emphasise the difference between the producer 'incentive' price for milk and the 'market' producer price for milk. To the extent that any producers use the SFP to support their dairy business, the incentive price driving their decisions will exceed the actual milk price they receive. In this case, the UK milk production
will remain at full national quota level until 2015. If producers treat the payment as decoupled, then a lower incentive price will apply, more producers will leave the industry and a short-term deficit in output is likely; that is, it would fall significantly below the UK national quota in 2010 and falling slightly below in 2015. Considering that the UK is one of the lowest cost milk producers in the EU-15 (Colman, 2002), this result suggests that milk production in other EU countries will fall below quota levels if the SFP is treated as completely decoupled. However, Colman and Harvey expect that most producers will effectively treat the SFP as coupled and as an aid to enable them to continue dairy farming.
The British Milk Development Council (Farmers Guardian, 2004) interviewed over 1,200 dairy farmers in the United Kingdom about their future plans after the introduction of the Single Farm Payment Scheme. In a survey in April 2004, 75% of farmers stated they would use the SFP to support them in dairy farming. Six months later, in another survey, this has fallen to 62%, suggesting that more farmers were planning to change enterprises if dairying is not profitable in its own right. However, still a large percentage of dairy farmers will treat the SFP as if it were coupled and hence will use it to subsidise milk production.
A survey conducted by Trantner et al. (2004) came to a similar result. They asked 4,500 farmers in each of three EU countries (the UK, Germany and Portugal) about their response to a proposed bond scheme, corresponding, more or less, to the Single Farm Payment Scheme.
The survey was carried out in 2001/02, before the latest CAP reform. Around 67-69% of the respondents said they would not alter their mix of farm activities after the proposed policy change was introduced. It is interesting to see how close this proportion was for each of the three countries (Germany and Portugal 67%, UK 69%).
Breen et al. (2005) assessed the impact of decoupling on farming in Ireland. Their result is that, despite the significant changes in profitability that decoupling could engender, the majority of farmers intend to continue as before and are unlikely to change their production consider the decoupled payment linked to production. Among other farmers, 499 dairy and 395 beef cattle farmers were surveyed about their intentions to remain in dairy/cattle farming.
The survey indicates that 11% of dairy farmers and 14% of cattle farmers intend to cease their activities within the first four years of the Luxembourg Agreement. However, analysis of the profitability of Irish dairy farming suggests that up to 32% of farmers are likely to exit dairy production over the ten year period from 2002.
An analysis about the 2003 CAP reform from the Organisation for Economic Cooperation and Development (OECD, 2004a) concludes that although milk production remains bound by the quota, further cuts in the intervention price for butter, compared to Agenda 2000, resulting in lower domestic prices for milk and most dairy products will lead to lower production of skimmed and whole milk powder. Significant decreases in EU dairy product exports cause world prices to increase. The OECD modelled two scenarios: a 'maximum decoupling' and a 'minimum decoupling' scenario, in which it is assumed that all Member States will either select the option that maximises or minimises the degree of decoupling. The impact of different direct payment decoupling assumptions on the dairy sector is negligible. In both scenarios, the production quota remains binding and the marginal effect of direct payments on milk production is zero. EU beef production decreases in both scenarios, but does not initially change export levels. However, imports will increase by 1.7% from 2004 to 2008 in case of full decoupling. Beef production is estimated to be reduced by less if the maximum possible share of beef payments is kept linked to beef production. Under these assumptions, beef production is reduced by less than 0.1% by 2008 compared to 0.6% with maximum decoupling.
Similar to the OECD, the Food and Agricultural Policy Research Institute (FAPRI, 2003) analysed the impact of the Luxembourg CAP reform agreement on EU agriculture. They also modelled a maximum and a minimum decoupling scenario, according to the Member State's decisions on the degree of decoupling. The baseline is represented by the policies agreed under Agenda 2000. The results for the dairy sector under each of the scenarios were very similar. Due to the reduction of the intervention price of butter the price of all dairy commodities will fall. Nevertheless, the production quota still remained binding and determined the milk supply. On the demand side, lower EU product prices meant higher consumption and lead to reduced volumes of EU dairy products available for export.
Decoupling of beef direct payments had a significant impact on the sector. Compared to the baseline, EU beef production decreased by 2.6% in the full decoupling scenario and by 0.2%
in case of minimum decoupling (in the average from 2007 to 2012). Net imports increased by 241.3% and 22.2%, respectively.
The European Commission (2005) modelled the impact of alternative implementation scenarios of the SFP on the EU-25 agricultural sector in 2012. The projected situation under the status quo policy implementation (as notified by Member States) was compared with two
provisions of the current legislation. The status quo policy implementation scenario predicts an increase in set aside and fallow land until 2012 through the introduction of the Single Farm Payment. Regarding livestock production, the projections indicate that the EU-25 cattle herd would slightly decrease until 2012. This would be the consequence of the quota-driven structural decline in dairy cow herd size, but also abandonment of beef production mainly in the Member States with fully decoupled cattle premiums. In comparison to the reference scenario, full decoupling of direct payments in 2012 would lead to a decrease of 1.8% in total EU-25 cattle herd. In contrast, the full coupling scenario assumes that Member States couple their direct payments to the maximum extent in line with the effective CAP provisions.
Compared to the reference situation, overall EU-25 cattle herd would increase by 0.5%.
Huettel & Kleinhanss (2004) reviewed a number of studies about CAP reform impacts in the dairy sector in different EU countries. They focussed on milk supply effects of decoupled direct payments and on changes of producer prices. Their result is that the type of decoupling (SFP based on Historic Model or Regional Model) will not have significantly different supply effects in the short and medium term. With regard to the national implementation schemes, only the date of decoupling the milk premium was predicted to affect milk supply. Most of the models show an almost stable milk supply, even in the case of total decoupling. The milk quota is still binding and therefore will be fully used.
According to the current literature, it can be concluded that milk production in the EU will continue to be at quota level. Maybe higher internal consumption due to lower domestic prices will decrease EU exports and increase NZ exports. EU beef production is expected to decrease in all the relevant studies, depending on the degree of decoupling.
2. Agricultural Policy in the European Union and New Zealand
The EU has changed significantly the way how it supports its farmers during the last 15 years.
However, the absolute amount of government support to the agricultural sector has still increased in this period. NZ on the other hand presents a case study of a country moving from a highly regulated economy to one of the most deregulated in the Western World. In this chapter, the historical development of agricultural policy in the EU and NZ is summarised and the different objectives are discussed.
2.1 The Common Agricultural Policy of the EU: History and Objectives
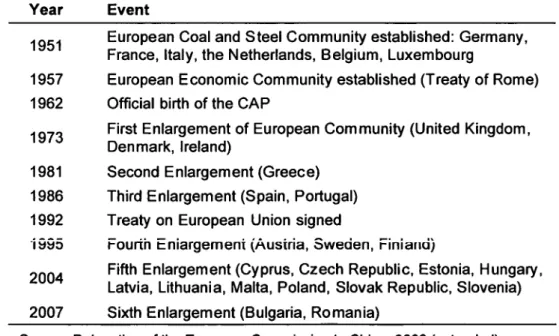
The European Union (EU) is a supranational union of 25 Member States. It was established under that name in 1992 by the Treaty on European Union. However, many aspects of the Union existed before that date, dating back to 1951. Some milestones of European integration are shown in Table I. It started with six countries and now after five waves of accessions the EU comprises 25 Member States. The sixth enlargement has already been decided and will take place in 2007: the accession of Bulgaria and Romania will create the EU-27.
Table 1: European milestones Year Event
.QCH European Coal and Steel Community established: Germany, France, Italy, the Netherlands, Belgium, Luxembourg
1957 European Economic Community established (Treaty of Rome) 1962 Official birth of the CAP
._^_ First Enlargement of European Community (United Kingdom, Denmark, Ireland)
1981 Second Enlargement (Greece) 1986 Third Enlargement (Spain, Portugal) 1992 Treaty on European Union signed
1995 Fourtii Enlargement (Austria, Sweden, Finland)
?nn4 ^'^^ Enlargement (Cyprus, Czech Republic, Estonia, Hungary, Latvia, Lithuania, Malta, Poland, Slovak Republic, Slovenia) 2007 Sixth Enlargement (Bulgaria, Romania)
Source: Delegation of the European Commission to China, 2006 (extended)
The CAP was the first common policy of the EU and hence played a crucial role in the European integration right from its beginning. Besides the CAP, the Union currently has a
common single market consisting of a customs union, a single currency (so far adopted by 12 of the 25 Member States), a Common Fisheries Policy, a Common Commercial Policy and a Common Foreign and Security Policy. This chapter reviews the development of the CAP from the beginnings until its current stage and mentions the internal and external difficulties arising from this policy.
After World War II, Europe needed food!
After the Second World War, many parts of the European infrastructure were damaged or destroyed and consequently agricultural production was limited. Food production could not keep up with food consumption. Europe was dependant on food imports and starvation was a serious problem in some regions. Since maintenance of adequate food supplies is essential to human wellbeing and therefore to political stability, almost all European governments at this time were seeking food market policies. These policies kept farmers producing and ensured stable food prices (Gardner, 1996:5). In addition to the provision of food, the farm sector was politically significant through its social importance: around 20% of the population was working in agriculture in the 1950s.
There was also a common desire among some western European countries to establish a political and economic union. The first step towards this union was the setting up of the European Coal and Steel Community (ECSC) in 1951 by six countries (Germany, France, Italy, the Netherlands, Belgium and Luxembourg). The success of the ECSC gave rise to the establishment of the European Economic Community (EEC) in 1957 by the same six countries through the Treaty of Rome. This treaty included a chapter devoted to agriculture which made clear that "the establishment of a common market in Europe which did not include agriculture was inconceivable". (Feame, 1997: 14). The objectives of the CAP, as set out in the Treaty of Rome, are to increase agricultural productivity, to ensure a fair standard of living for the agricultural community, to stabilise markets, to assure the availability of supplies and to ensure that supplies reach consumers at reasonable prices. Though unstated in the Treaty, Gardner (1996: 17) states that "the objective was the achievement of self- sufficiency in food".
The early success of the CAP soon brought undesirable side-effects
From the beginnings of the CAP in 1962 until a major reform in 1992, the principle used was to support farmers through the market rather than by direct subsidies. The so called 'Common Market Organisations' (CMOs) regulated the markets of all important agricultural products. A
unified market was created within the EEC and domestic agricultural products were given preference and a price advantage over imported products. An 'intervention price system' guaranteed high prices within the Community and imports of any food at less than the minimum import price were banned effectively.
The CAP succeeded quickly in reaching its initial goals: it encouraged both production and productivity, stabilised the markets, secured supplies and protected farmers from fluctuations in world markets. The problem began, however, when EU farmers began to respond to high - too high - domestic prices and to produce more than the domestic market could absorb. The consequence was a permanent accumulation of surplus production in the EU stockpiles which resulted in the famous 'butter mountains' or 'milk lakes'. In the late 1970s, the European Union switched from a net importer to a net exporter for the main commodities. Exports were only possible with the aid of export subsidies, since world market prices were much lower than the internal prices in the Community. This was very costly to the EU budget and on the other hand contributed to an undesired saturation of world markets in the surplus products.
In the early 1980s EU spending in agriculture increased exponentially. As a result, the CAP has undergone several attempts to reforms. The introduction of a milk production quota in 1984 limited the excess supply of milk and hence the export subsidies for dairy products. In 1988, the European Council agreed on a package of reform measures. Among them was the 'agricultural expenditure guideline' which limited the percentage of CAP expenditure in the overall budget. The modifications of the CAP introduced during the 1980s put some limitation on the intervention buying activities of the EU farm support authorities, but they did not really change the basic problem of overproduction. In addition to the internal difficulties, the CAP has become the main source of dispute with the EU's international trading partners since the late 1970s (Howarth, 2000). During the Uruguay Round of the
GATT' (1986-1994) the EU got particularly under pressure by the 'Caims Group', an interest group of 18 agricultural exporting countries (among them New Zealand). The reason was because the EU has been depressing world prices by subsidising its exports and as a consequence the prices and incomes received by farmers in these countries fall indirectly.
Gardner (1996: 29) describes the situation by the following:
The CAP was, until the reforms of 1992, still none the less largely the policy designed by the EEC-6 in the 1960s. A few 1980s 'add-ons', such as quotas,
budgetary 'stabilisers' and limits on intervention stockholding, gave an outward appearance of reform, but by the early 1990s the beast was still the basic money-squandering, surplus-creating and trade-distorting monster which emerged from the Franco-German alliance in the 1960s.
(Gardner, 1996, p. 29)
The McSharry reforms initiate the shift from market support to direct payments
A more fimdamental reform became inevitable and it was the 1992 MacSharry reform which redirected the emphasis of farm support from markets to direct subsidies. The aim of this reform was to reduce the internal price of EU agricultural products, without undermining farm incomes. This was achieved by a cut in the domestic prices for cereals and beef and the introduction of direct aid payments to farmers to compensate for the impact of price cuts on farm incomes. The direct payments introduced in 1992 have been coupled to production, which means that farmers had to produce a certain crop/livestock product in order to get subsides. In the beef sector, direct payments were based on the livestock numbers, so the more cattle farmers had, the more subsidies they received. The MacSharry reform made no change to the support of the dairy sector.
The MacSharry reform also introduced agri-environmental measures as part of 'accompanying measures' to the reform. Hence, the objectives of the CAP have been extended, away from a sole farm supporting policy to a more comprehensive agricultural environment policy. According to the European Commission (2005a), the reform of 1992 was generally regarded as successfiil, with positive effects on European agriculture.
The reform of 1992 was a step in a new direction of the CAP, but it did not solve all the problems. Domestic prices of the main agricultural products were still high above world market prices and hence the problem of overproduction was not solved yet. In addition, a reform was needed in view of the expected enlargement of the EU-15 to the EU-25. An extension of the CAP ofthat time to the 10 new Member States would have been impossibly
<-/-»ctUj tn fVio RTT'c UfArrot '.n/^ 'in^r^mr^rttlM^ ../UU tUa CTT'r. /^ A TT^Al/T/"» ^UK .^r.«^!»«^
(Swinbank, 1997). The Agenda 2000 reform built on the process begun in 1992: prices were cut further and direct payments were increased in order to compensate for farmers' income losses. This reform brought for the first time a price reduction in the dairy sector - the intervention prices for butter and skim milk powder were cut by 15%. Coupled direct payments were introduced in the milk sector and increased in the beef and cereal sectors, respectively. Agenda 2000 was the set of reforms which not only dealt with CAP reform but
also the future financing of the CAP, the structure funds, EU enlargement; and most radically it replaced the original objectives of the CAP with a set of objectives for a rural policy. Rural development has officially become the 'second pillar' of the CAP. This approach covers farming, forestry, the environment, the countryside, diversification of the rural economy, the rural quality of life, innovation in farming, new uses for agricultural products, environmental protection in rural areas, and job creation (European Commission 2005a).
Decoupling of direct payments exposes farmers more to market forces
The mid-term review of Agenda 2000 resulted in a new fundamental reform. The 2003 reform (also referred as the 'Luxembourg Agreement' or 'Fischler reforms') of the CAP introduced a new system of single farm payments and cut - at least partially - the link between support and production. A single farm payment (SFP) will replace most of the existing direct payments.
The SFP is delivered to farmers irrespective of what and how much they produce (hence 'decoupled' from production) and it is based on historical entitlements. The main purposes of the new SFP scheme are to support farm incomes and - at the same time - to allow farmers to become more market oriented, giving them the incentives to produce for consumers' demand rather than for CAP subsidies. However, Member States could choose individually to maintain a limited link between subsidy and production within clear limits. This is a new development of the CAP towards re-nationalisation of agricultural policy in the EU.
The recent reforms of the CAP also take other concerns into account, such as food safety, animal welfare and the environment. In order to receive the SFP, farmers must maintain their land in good agricultural condition and comply with standards on public health, animal and plant health, the environment and animal welfare (cross-compliance). Further details of the implementation of the 2003 CAP reform are explained in the following chapters 2.2 and 2.3.
The principle of the SFP has been used for other reforms of Common Market Organisations in products which have not been affected by the 2003 reform. The '2nd wave of CAP reform' in 2004 introduced the SFP in the tobacco, hops, olive oil and cotton sectors, in the sugar sector, a reform was adopted in February 2006 and compensatory aids for sugar beet growers will be integrated in the SFP. Currently, the reform of the common market organisations in wine and fruit and vegetables is under discussion. Several reform options are to be assessed till the end of 2006, but they will be in line with the principles of the 2003 CAP reform (European Commission, 2006a).
2.2 Direct Support Schemes under the CAP
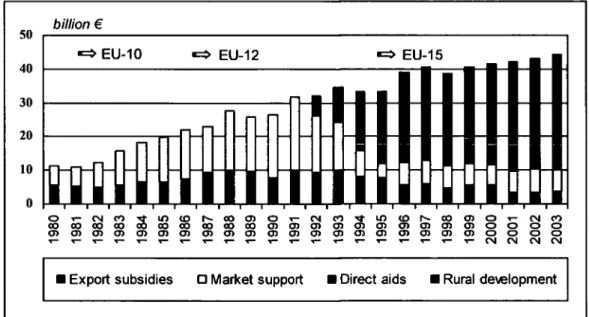
The breakdown of CAP expenditure from 1980 to 2003 is shown in Figure I. It can be seen that since the mid-1990s direct payments account for the greatest part of CAP expenditure.
Direct payments now contribute to 63% of the total agricultural budget. In 2006, •34.8 billion are spent on direct payments (European Commission, 2006b). A major proportion of the direct payments to EU farmers is since 2005 the Single Farm Payment. In 2006, •14.6 billion will go into the Single Payment Scheme in the EU-15, which is 42% of all direct payments.
The European Commission (2005) estimated that in 2012 approximately 90% of the budgetary transfers in the form of direct payments for the arable crops, milk, beef and sheep sectors will be part of the single farm payment for the EU-25 as a whole. The premiums relevant for the dairy and beef sectors are described in more detail below.
50 40 30 20 10
billion •
EU-10 •=> EU-12 EU-15
^MVmniti
Or-CMC0'«tm<Dh-000)O'«-fV|C0Tl-lOtDh-000)OT-f\|C0 IIIIIIr^oooocooocooooococoooa>a)a)o>a>o)(ncno>o>oooo 0> Gy 0> 0> 0>0)0> Oi G> Oi O) 0> O) O) o> Gi o>o>o o>oo oo 1-'.-T-T-T-T-T-T--.--C--^.e-T-T-T-T-'.-ir--t-T-CN<MCN<M
I Export subsidies O IVIarket support I Direct aids I Rural dewlopment
Figure 1: The path of CAP expenditure from 1980 to 2003 Source: European Commission, 2005c
Dairy premium
The dairy premium was introduced in the Agenda 2000 reforms in order to compensate for the reductions in the intervention prices for butter and skim milk powder and the increase in the milk production quota. It was introduced as a coupled direct payment, granted per calendar year, per holding and per tonne of milk. Milk producers qualify for a dairy premium from 2004 to 2007. From 2007 on (in some Member States from 2005 on), the dairy premium will be decoupled and included in the SFP. The amount of the dairy premium is calculated by
multiplying the reference quantity for milk available on the holding on 31 March of the calendar year concerned by:
o •8.15/t for the calendar year 2004, o •16.31/t for the calendar year 2005,
o •24.49/t for the calendar year 2006 and for the following calendar years (European Commission, 2003).
Additional payments for milk producers
Member States can make additional payments to their producers on a yearly basis. The total amounts for each country are fixed by the European Commission and account for •1,294 million for the whole EU-15 in 2006 and 2007. Additional payments are granted as a supplementary amount per dairy premium amount as set out above.
Suckler-cow premiums
The suckler cow premium is an annual premium of •200 per eligible animal per calendar year. The condition to the premium is that the farmer does not supply milk or milk products from his farm as it was introduced to promote the conversion from dairy farming to beef cattle farming. National and individual ceilings in the number of eligible animals apply. The number of animals qualifying for the suckler-cow premium also depends on the application of a stocking density. The maximum stocking density is 1.8 livestock units (LU) per farm, hectare and calendar year. Several Member States (Austria, Belgium, France, Portugal, Spain) are keeping the suckler cow premium coupled even after the 2003 reform, whereas the other Member States include it in the SFP.
Additional suckler-cow premium
Member States may grant an additional national suckler cow premium, up to a maximum of
•50 per animal. Under certain circumstances, this additional premium is financed partly or com"lctcl^ b^ the Guarantee Section of the Euro"C3n Guidance ?.nd Guarantee Fund (EAGGF).
Beef slaughter premium • Calves
The slaughter premium is granted on slaughter of eligible animals or their export to a third country. It amounts to •50 for calves of more than one and less than eight months age and a
carcass weight up to 185 kg. Some Member States (Austria, France, Belgium, Netherlands) made use of the option to keep the slaughter premium for calves coupled.
Beef slaughter premium •Adults
Like the slaughter premium for calves, the slaughter premium for adults is paid at slaughter or export to a third country. It amounts to •80 and is granted for bulls, steers, cows and heifers from the age of eight months. The European Commission allowed Member States to keep 40% of the slaughter premium for adults (•32) coupled, the rest is included in the SFP.
Austria, France, Portugal and Spain made use of this option, whereas the Netherlands keep the adult slaughter premium 100% coupled.
Beef special premium
A farmer holding male bovine animals may qualify for a special premium, granted per calendar year and per holding, set at •210 per eligible bull and •150 per eligible steer and age bracket. The beef special premium will still remain for 75% coupled in Denmark, Finland and Sweden and is included in the SFP in the other Member States.
Deseasonalisation premiums
Where the number of steers slaughtered in a Member State in a given year exceeds 60% of the total number of male bovine animals slaughtered that year and where the number of steers slaughtered from 1 September to 30 November of a given year exceeds 35% of the total number of steers slaughtered that year, producers may qualify for the deseasonalisation premium. The premium lies between •18.11 and •72.45, depending on the time of the year.
Beef extensification premium
Farmers receiving the beef special premium and/or the suckler cow premium may qualify for an extensification payment. It is •100 per special premium and suckler cow premium granted, provided that in respect of the calendar year concerned the stocking density on the holding concerned is less than or equal to 1.4 livestock units (LU) per hectare.
Additional payments to beef producers
Member States are allowed to make additional payments to farmers, according to objective criteria including the relevant production structures and conditions, in order to ensure equal treatment between farmers and to avoid market and competition distortions. Additional
payments may be made in the form of headage payments (per male bovine animal, suckler cow, dairy cow or heifer, respectively) and/or area payments (per hectare of permanent pasture) and are subject to national ceilings.
In addition to the direct payments in the dairy and beef sectors, support schemes for sheep and goats, arable crops, rice, starch potatoes, grain legumes, protein crops, seeds, olive oil, nuts and energy crops have been affected by the 2003 reform of the CAP.
2.3 Implementation of the 2003 CAP Reform
The Fischler reforms affected both the milk and the beef sector. The milk production quota was increased step by step from 118,392,387 to 120,504,975 tons from 2007. The intervention price for butter was reduced by 25% (additional 10% to the Agenda 2000 decisions) and the intervention price for skim milk powder was cut by 15%. The intervention price for butter will be •2,464 per ton from July 2007 and for skim milk powder •1,747 from July 2006. The dairy premium has been increased from •17.24 per ton to •24.49 per ton from 2006 (European Commission, 2003b). Changes in the beef sector resuh from the decoupling of most direct payments which were previously explained.
As a new element the 2003 CAP reform has provided a large space for national initiatives (Halmai & Elekes, 2005). The following elements of the reform fell within national jurisdiction:
• possibility of partial decoupling
• selection of the SFP calculation model
• date of introduction (between 2005 and 2007)
• re-allocation of subsidies (modulation)
• application of cross-compliance
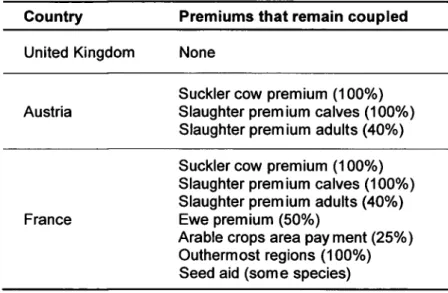
The pcsSibi'itj' Ci partiui uccoupiing was proviuGu in orucr to ävöiu aoariuoiiiiicrit Oi production. Member States could choose to maintain a limited link between subsidy and production under well defined conditions and within clear limits. Germany, Ireland, Italy, Luxembourg and the United Kingdom chose to maximise, while France chose to minimise the degree of decoupling. The options chosen by three Member States (United Kingdom, Austria, France) are shown in Table2. The United Kingdom was selected as an example for the highest
degree of decoupling - contrarily to France which opted for the lowest degree of decoupling.
Austria lies somewhere in between with only premiums in the beef sector remaining coupled.
Table 2: National implementation of the 2003 CAP reform in selected countries
Country Premiums that remain coupled United Kingdom None
Austria
Sucklercow premium (100%) Slaughter premium calves (100%) Slaughter premium adults (40%) Sucklercow premium (100%) Slaughter premium calves (100%) Slaughter premium adults (40%) France Ewe premium (50%)
Arable crops area payment (25%) Outhermost regions (100%) Seed aid (some species) Source: European Commission, 2006c
The European Commission proposed different models to calculate the SFP, including a model based on historic data, a regional model and a hybrid system. The majority of Member States will base the SFP on farm level historical entitlements, with Denmark, Finland, Germany, Luxembourg, Sweden and the United Kingdom using a mix of both farm level historical and regionalised payments. In case of the United Kingdom, the individual countries (England, Scotland, Wales and Northern Ireland) have each chosen a slightly different option.
Entitlements for single farm payments are calculated on the basis of direct payments received in the reference period 2000-2002.
The majority of EU-15 countries started to implement the single payment scheme in 2005, with the rest (Finland, France, Greece, the Netherlands and Spain) commencing in 2006. The new Member States (except Slovenia and Malta) implemented single area payment schemes in 2004. nrovidin*' 6. fl?it r8.tc ?'vcr<if in^ EIJR. 48 r>cr hcct^TC for ?.ll Htricultiir?.! i^ind '^•uro"c?Ji Commission, 2006c).
Member States also had to decide on the introduction of a national modulation. Modulation is the reduction of direct payments and re-allocation of subsidies to rural development measures.
The obligatory modulation is 3% in 2005, 4% in 2006 and then 5% annually until 2012. This regulation shows the efforts to redirect the CAP from only farm support towards a more comprehensive rural development policy.
Furthermore, Member States play the leading role in ensuring cross-compliance is applied.
Cross-compliance must be respected by farmers in two ways:
• Statutory management requirements (SMRs): These are standards set-up in accordance with 18 EU Directives and Regulations^ relating to the protection of environment;
public, animal and plant health; animal welfare.
• Good agricultural and environmental condition (GAEC): These are standards to be established by the Member States and are intended to avoid the abandonment of agricultural land and its environmental consequences. This is an obligatory minimum requirement for all farmers to attain. It should not be confused with the higher standards involved in voluntary agri-environment schemes (within rural development measures), where farmers may receive a payment for providing environmental services which go beyond basic mandatory legal standards.
Failure by farmers to fulfil these conditions can result in deductions from, or complete cancellation of, direct payments. After a review of the cross-compliance regulations in England (Defra, 2006), Austria (AMA, 2006) and France (Menet & Saunders, 2006) it can be concluded that the regulations are basically very similar across the Member States and most of them have already been part of existing law in all Member States. Hence, farmers do not have to do anything different in order to comply and it can be assumed that cross-compliance does not really have an effect on production. Therefore the introduction of cross-compliance is not included here in the modelling of the impacts of the 2003 CAP reform.
2.4 The Agricultural Policy in New Zealand: History and Objectives
New Zealand presents a case study of a country moving from a highly regulated economy to one of the most deregulated in the Western World. The New Zealand experience shows that liberalisation of agricultural trade is feasible and brings economic benefits. Johnson (2000) argues that a New Zealand style liberalisation of agriculture would be beneficial in Europe as well. This chapter summarises the developments in agricultural policy in New Zealand after the Second World War until today and stresses its objectives, which differ from those of the European Union.
Post World War II: Agricultural exports make New Zealand rich
New Zealand emerged from the Second World War with a highly regulated economy "to an extent that was unusual amongst the relatively wealthy countries" (Rayner, 1990: 15). At this time it was thought that the low level of unemployment and economic growth was directly attributable to the policy of protectionism. In the early 1950s, New Zealand was one of the richest countries in the world. Its Gross Domestic Product (GDP) per capita was exceeded only by Switzerland (Bell & Elliott, 2006). In a world facing major shortages of agricultural goods. New Zealand's wealth was mainly based on the sale of agricultural commodities to Great Britain. The British market absorbed all the produce New Zealand could send, with guaranteed access at good prices (Bell & Elliott, 2006). Under these safe market conditions, farming flourished and New Zealand built a high standard of living without the need to face up to international market prices or competition.
In the 1960s, the high standard of living enjoyed in the 1950s suffered as the global situation became less favourable for New Zealand and its exports. At this time, the new Common Agricultural Policy in the European Economic Community showed its first effects. In general, advancing agricultural technology, combined with increasing agricultural subsidies to producers in developed economies and reduced market access, led to falling world prices, particularly for the food products that New Zealand exported. Agricultural protectionism overseas meant that the terms of trade facing New Zealand exporters were steadily worsening.
Britain's EU accession leads to a crises in New Zealand
In 1973 the United Kingdom joined the European Economic Community (EEC). This marked a major turning point for the New Zealand economy as New Zealand lost its unrestricted
United Kingdom adopted the Common Agricultural Policy (CAP) and hence the principle of 'community preference'. Supplies from within the Community had to be given preference in the market over those from outside the EEC and external trade barriers were applied to New Zealand like to any other non-member country. However, New Zealand received transitional entry preference for butter, cheese and sheepmeat under Protocol 18 of the United Kingdom Treaty of Accession. This preferred market access has been progressively reduced: in the butter market, for example, in 1965, 93% of the exported New Zealand butter was shipped to the UK, while by 1988 this was reduced to 51% (Lattimore & Rae, 1990). As a consequence.
New Zealand exporters were forced to look for ahernative markets, but these markets did not provide the same returns as the British market. The result of the decreasing export earnings in combination with increasing import expenditure (among others due to the pefrol shocks at this time) was a serious deterioration of New Zealand's balance of payments. The policy response was to encourage farmers to increase production for exports.
In the 1970s, a number of new farm support programmes were created and already existing subsidies were increased. These production development programmes involved direct transfer payments to the farm sector. They were of three types: investment and development, income support and stabilisation, and input subsidies. Total assistance or transfers to the pastoral sector rose to 33% of the value of GDP generated in the 1980-84 period (Johnson, 2000: 21).
In 1983, the producer support equivalent (PSE) measure for New Zealand agriculture peaked at 35% (Rae & Blandford, 2006). For a comparison, the PSE in the European Union at the time is 34% (OECD, 2005). The programmes did increase production, but they were not sustainable. The increased output was in some cases worth less than the cost of production and processing (Bell & Elliott, 2006). In the early 1980s the fiscal costs of assistance to agriculture rose very sharply. This was the result of a widening gap between market prices for some agricultural commodities and the prices guaranteed by stabilisation programmes. The increase in subsidies to agriculture was so important that they reached close to 40% of the budget deficit in 1985 (Gouinetal., 1994: 15).
Crises in the whole economy triggers agricultural policy reform
To sustain the standard of living that New Zealanders had become used to during the 1950s and early 1960s, the government had begun a programme of borrowing on international markets until the situation became unsustainable. At the beginning of reforms in 1984, the overseas public debt reached 24% of GDP, and "promised to increase indefinitely" (Gouin et
economic and budgetary crises led to a total reform in government intervention in all economic activities. Due to its importance in the New Zealand economy, the farm sector was at the front line of the economic reform.
During the reforms starting in 1984, assistance to agriculture was rapidly withdrawn. Farmers had benefited most from the supplementary minimum prices (SMP) scheme, which operated similar to a direct payment or export subsidy, depending on the commodity. This scheme was eliminated. Most other programs were phased out by the early 1990s and the PSE fell below 5%. Now, the level of producer support is the lowest across OECD members - the PSE was 2% in 2002-04. Prices received by farmers have been aligned with those on the world market since 1988. Payments are only provided for pest control or relief against climate disasters, but there is no direct support to agriculture from the government (OECD, 2005). The major remaining area subject to marketing controls is the export monopolies of producer boards, but here "efforts to deregulate the producer and marketing boards continued" (OECD, 2005: 61).
Nevertheless, in the current Doha round of the WTO negotiations, the EU keeps pressure on New Zealand over its dairy export monopoly (Agra Europe, 2006).
Low support makes New Zealand agriculture very efficient and competitive
According to Johnson (2000: 16) "the most significant change (in the New Zealand agricultural economy) between 1960 and 1998 has been the complete re-alignment of market destinations". In 1960, the United Kingdom (UK) was buying 53% of all merchandise exports from New Zealand, whereas in 1999, the UK was only taking 6.2% of total merchandise exports. The adjustment was harsh and complicated for New Zealand. However, new markets were developed, new products were found and New Zealand fanners were "encouraged to stand on their own feet and face the world" (Johnson, 2000: 16). This made New Zealand more competitive in trade relationships with other countries and encouraged a set of economic reforms. New Zealand agriculture has become "a market driven export oriented sector"
(OECD, 2005: 61). Now, farmers in New Zealand are using fewer inputs, they increased the efficiency of the farming sector and hence made it extremely internationally competitive.
Farmers asked today would rather farm under the current situation than where they were previously at times of government support (Bell & Elliott, 2006).
New Zealand domestic agricultural policy efforts are addressing environmental and food safety issues. Parallel to the agricultural policy reform, environmental protection programmes have been introduced on a 'polluter pays' basis so that the chance of renewed subsidisation of
production is largely avoided and the costs of such programmes fall on those who created the externalities. Apart from special programmes to address severe land degradation in two regions of the country, and diminishing number of regional council grant programmes for soil conservation, there are no government subsidies to farmers to comply with environmental standards (MAF, 2006a).
Nowadays in New Zealand, agriculture contributes nearly 9% of GDP and 8% of employment (OECD, 2005). A large proportion of agricultural output is exported. Exports derived from farming used to contribute to 90% of total exports in the 1950s (Johnson, 2000). Agriculture still is New Zealand's main export sector, accounting for over 60% of merchandise exports, with dairy and meat exports comprising more than half of this (WTO, 2003). This level is high compared with that in most OECD countries. New Zealand still continues to live beyond its means: the internal balance of payment deficit continues at 3% of GDP, and the net public overseas deficit is about 50% of GDP (Bell & Elliott, 2006). The International Monetary Fund (2006) ranks New Zealand on the 27* position in its World Economic Outlook Database which lists counfries by GDP (at purchasing power parity) per capita. Rayner (1990: 20) agrues that "one of the root causes of the economic difficulty New Zealand faces is beyond its control and almost beyond its ability to influence". He thinks about the agricultural subsidies in many other countries and argues that "a liberalisation of world agricultural frade would be highly beneficial to New Zealand, however little can be done to advance this cause save through exerting what influence New Zealand has in organisations such as the GATT and OECD".
2.5 CAP and New Zealand - some Conclusions
The importance of the agricultural sector in the whole economy differs significantly between the EU and NZ. In the EU, the agricultural sector generates 2% of the gross domestic product (GDP) and contributes 3.8% of total employment (OECD, 2005). The share of agricultural products in the EU's total exports of goods is 6.2% (European Commission, 2006d). On the other hand, agriculture accounts for nearly 9% of GDP, 8% of employment and 43% of total exports in NZ (OECD, 2005). For NZ, agriculture is the most important export earner, whereas the EU generates most of its income from other sectors and hence can transfer money in form of subsidies to the agricultural sector.
The 'European model of agriculture' suggests that European farming provides multifunctional, non-market goods and services. The term 'multifunctionality' refers to any unpriced side-benefits additional to the production of food and fibre. Europeans emphasise the social functions of providing environmental and amenity goods (such as scenic landscapes, wildlife and biodiversity) and sustaining rural communities. (Latacz-Lohmann & Hodge, 2001). The rural environment in Europe is a 'lived-in' environment for the vast, non- agricultural, majority of the population that is a product of particular agricultural production systems. Landscapes and habitats have coevolved with agricultural systems and the communities that have depended on them. Maintaining the flow of amenity benefits will require payments to agriculture in order to maintain the particular processes that support the environmental quality (Latacz-Lohmann & Hodge, 2003).
On the other hand, in NZ agriculture is 'a market driven export-oriented sector' (OECD, 2005) and seen as a business like other industries. Farm support in NZ before the free-market reforms in the 1980s had the objective to increase export revenues. These reforms have been triggered by a crises in the whole economy and not mainly by a philosophy of not supporting the agricultural sector. New Zealanders may have a preference for a wilderness landscape and therefore the European view of a cultural landscape and a lived-in rural environment as an amenity of everyday life for the non-agricultural majority of the population may sound strange for them. According to the New Zealand Official Yearbook 2002, NZ is one of the most urbanised countries in the world, with 85.7% of its population living in urban areas. In contrast, the EU has a lower level of urbanisation of 75% (Statistics New Zealand, 2006).
Agriculture is the basis for maintaining the rural communities where one quarter of the EU population lives.
EU citizens have high expectations towards environmental quality, food safety and animal welfare. In a dense populated region like Europe it is much more difficult to maintain the same level of environmental quality than in a low populated island like New Zealand. Hence, environmental regulations play an important role in EU agriculture - more than in most other regions of the world. This, among other factors, rises the production costs in the EU. States lose a comparative advantage in trade by stringent environmental regulations (Managi &
Karemera, 2005). Agricultural support can be seen to neutralise the loss in comparative advantage for European farmers.
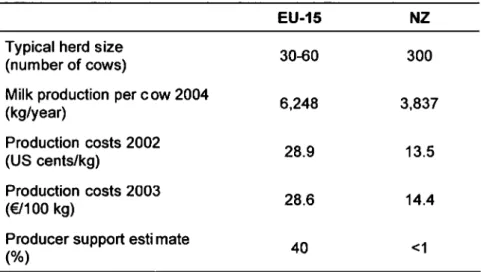
The NZ experience has shown that an important reduction of state support to the farm sector is possible without causing the rural economy to collapse. However, farm structures have changed dramatically towards much bigger farms than in the EU. For example, an average dairy farm holds 300 cows in NZ, but only 30-60 cows in the EU. Farm structure in NZ has always been larger than in the EU because of the different historical development.
The social impact of restructuring due to a liberalisation in the agricultural sector in the EU can be expected to be much higher than in NZ. There are 70,000 farms in NZ (Statistics New Zealand, 2003), compared to 5.5 million farms in the EU-15, plus around 4 million in the EU- 25 (European Economic and Social Committee, 2004). Additionally, it is politically much more feasible to liberalise a sector in a single country with 4 million inhabitants than in a union of 25 countries with a population of 450 million. Furthermore, regional differences within the EU are very large: in the United Kingdom, 1.4% of the working population is employed in agriculture, whereas in Poland agriculture represents the main activity of 17.4%
of workers (Eurostat, 2006). A liberalisation in the agricultural sector would have different impacts on different countries and is therefore so politically difficult.
3. Dairy and Beef Sectors in the EU and NZ
Milk production is the main farming activity in almost all countries of the EU individually and in the EU as a whole - where it accounts for 18.4% of the total value of agricultural production. The importance of the milk sector within EU agriculture is even more apparent when compared with the closely related sector of beef cattle farming which accounts for 11.9% of the total value of agricultural production and is the second largest contributor (European Commission, 2004). In NZ, like in the EU, milk production is the main contributor to the total value of agricultural output. Beef cattle farming is the third largest sector, overtopped only by milk production and horticulture (Statistics New Zealand, 1996).
Production of milk and beef in the EU is mainly aimed for the domestic market and 'surpluses' are exported with the help of export subsidies, whereas in NZ around 90% of dairy and beef products are produced for export. The structures of milk and beef production differ considerably between the EU and NZ. In the following these differences are explained further.
3.1 Main Characteristics of the Dairy Sector in the EU and NZ
In both the EU and NZ, the number of dairy farms has been falling during the past decades, but the average farm and herd size has increased. Nevertheless, there are considerable structural differences in the dairy sector. NZ always has already had larger farms than the EU and structural adjustment proceeds faster in NZ because in the EU it is slowed down by policy measures. In the EU, there are vast differences between the Member States. In Ireland, the United Kingdom, the Netherlands and Denmark the typical herd size is 30-60 cows, as compared to only 10-20 cows in Austria (Hofstetter, 2005). The average milk production per cow in the EU is 6,248 kg per year (FAPRI, 2005). The average NZ dairy farm in 2002 was 103 hectares, milking 271 cows which each produced 3,679 litres of milk (MAP, 2006b). A comparison of these figures is given in Table 3.
Milk production in the EU usually occurs all year round. There are different production systems, but generally cows are held in stables where they are fed with silage, hay, green fodder and concentrated feed. 'High input - high output' systems are prevalent in which milk is produced at costs of 28.9 US cents per kg in the average (Fonterra, 2005). Contrarily, the vast majority of New Zealand dairy herds (97%) supply milk seasonally for manufacturing (MAP, 2006b). Cows are milked in spring, summer and autumn, but dried off in winter when