Przewalski's horse (Equus ferus przewalskii Poljakov, 1881) is one of seven recent horse species in the world and the only true representative of wild horses (Wakefield et al., 2002). This has resulted in small populations of Przewalski's horses, of which 113 live in the Great Gobi B Special Protected Area (SPA) in SW Mongolia (Ganbaatar et al., 2015). The Gobi areas probably provide a marginal, rather than an optimal habitat for Przewalski's horses (Kaczensky et al., 2008; Van Dierendonck and Wallis de Vries, 1996).
A new analysis using the Time Local Convex Hull (T-LoCoH) toolkit has recently become available (Lyons et al., 2013).
Study Area
Study Species
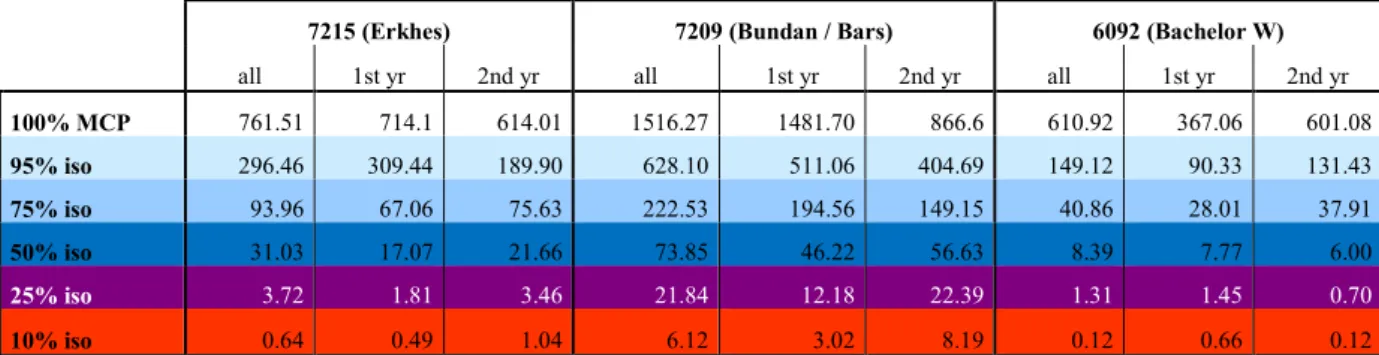
The Erkhes harem and the Bachelor West group consisted of animals recently transferred to B SPA, while the Bundan harem consisted mainly of animals born in the area (Table 1). The Erkhes harem consisted of five individuals including collared mare 7215 (Boroo), the Bundan harem consisted of 25 individuals including collared mare 7209 (Khatan) and the isolated Bachelor West group consisted of seven individuals including collared stallion 6092 (Oidov; Ganbaatar 2014). ).
Data Analysis
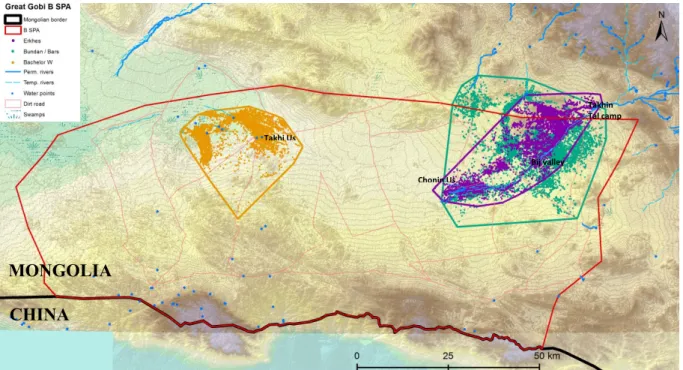
Overview of group distribution in SPA B (red box) in SW Mongolia bordering China (black box). The "a" and "k" values were determined by reducing the "dummy holes" in the UD (for each individual and their subsets), with the remaining holes primarily excluding unsuitable habitat features or larger areas apparently not used by the animals. Manually defined and color-coded regions of interest in hsp space could then be used to visualize parent body points of matching colors in space, as well as in date-time scatterplots (Lyons et al., 2013).
The main plant communities within the wild ungulate range were classified according to their estimated productivity using the methods described in Kaczensky et al.
Area size and distribution of high intensity use areas
The major areas were not continuous but identified several discrete clusters for all three groups (Fig. 2A–C). Most of the underlying locations are from October/November 2013 and March 2014, which is similar to the behavior of 7209 in a similar region nearby (Fig. 8). The oasis in Chonin Us clearly receives the highest intensity of use being the only area highlighted at iso level 0.1.
Water points and oases (i.e., Chonin Us and Takhi Us) generally receive the highest intensity of use, which can be well illustrated by the density isopleths (Fig. 2A-C). The western portion of reach 6092 (Bachelor West) experienced reduced intensity of use during monitoring (Figure 2C). Limited spatial use at high temporal contiguity within the enclosure legitimately resulted in high iso levels for both sympatric individuals (Fig. 2A, B).
In addition, coves in high mountain regions seem to exert a certain attraction on both groups in the east. These regions are characterized by high usage intensity, moderate to high duration but minimal revisits, and striking patterns for signposted routes (Fig. 8). 7209's (Bundan/Bars harem) density isoplets from years one and two overlap in a cove west of Takhi Tal camp.
These areas have no known resources that are highly selected (i.e., most productive vegetation communities or water points).

Time specific differences in range use
Areas used
Color-coded temporally contiguous locations of all three annual subgroups of individuals (see Table 1) with year one of monitoring on then left and year two on right. Placing this graph into subsets generates less complex overviews, but also potential range shifts or, as in the case of 7215, more conservative habitat use (Fig. 3A). Interestingly, this individual shows a more condensed use of space in its second year, avoiding a central part in its range and not traveling directly from the riverbed to Chonin Us in the SW compared to its first year (turquoise to orange).

Internal space use parameters
No individual shows this pattern more clearly than 7215, which seems to drastically stop traveling faster between December and March. June clearly marks the month in which the average speed peaks and also shows the greatest variation.
Directional movements
The most notable behavior that 7209 exhibits with respect to strain distribution is the directional movement that occurs around the central mountainous region. Thus, four main corridors can be identified for 7209: (1) horizontal movement east of Chonin Us, (2) the valley of the Bij River, (3) the southwestern outline of the mountain, and (4) a longitudinal movement of Chonin Us to northern pastures and water sources. Also horizontal motion at the latitude of Chonin Us and high stretch of hulls around the central high mountains is similar (and evident when hulls of both individuals overlap (Fig. 14B)).
However, 7215 shows a very directional movement back and forth in the Chonin Us, especially west of the oasis, which 7209 did not. In addition, a clear shift and concentrated use towards the northern traverse to get from Bij to Chonin Us is evident.
Directional routes
The bays in the highlands seem to be of some interest to both groups in the east. Density isopleths of 7209 (Bundan/Bars harem) of the first and second years overlap in the bay west of the Takhi Tal camp. Date and time charts of individual time spent showed that 7209 spent five consecutive days in the area in April 2015.
Overlap of 7209's (Bundan Bars harem) first and second year density isopleths (at iso-level 0.5 in green, k=40, s are overlaid with red lines showing restricted directional routes (a=30,000) within a high mountain cove west of Takhi highlighted. Tal camp. Locations (red points) of hand-selected regions of the hsp from the second year of monitoring (k=40, s illustrating moderate to high duration at minimal revisit rate during April 2015.

Habitat characteristics of high use intensity areas versus movement
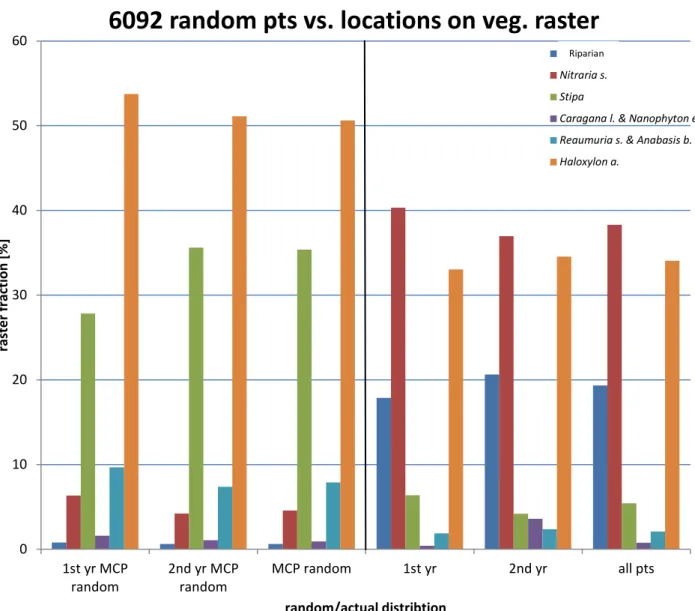
Random distribution of the number of locations per annual subset and the entire monitoring period in range 6092 (100% MCP) and its vegetation communities (left). The higher the intensity of use, the higher the proportion of the two most productive types of habitat Riparian and Nitraria. On the contrary, the composition of the travel corridors changes slightly with increasing intensity of use and consists mainly of Haloxylon communities.
Summary of 6092's availability of all vegetation communities within its range over the entire monitoring period (100% MCP, far left), followed by its utilization of respective communities with increasing intensity of use at k=40. Right: vegetation communities underlying isopleths of increasing eccentricity - isopleth level at a=30,000 (imperfect measure of directional movement). The most striking patterns that the Bachelor group exhibits with respect to the vegetation grid are decreasing fractions of the least productive vegetation community (Haloxylon a.), while the least accessible but most productive communities (beach vegetation and Nitraria s.) - associated with water points in this area - constitutes large fractions with increasing intensity of use.
Stipa grassland is hardly used at any intensity of use (95%-10% iso) and forms descending sections with increasing levels of elongation for this individual. Combined ranges (100% MCP) as well as combined utilization and extension distributions of the sympatric groups in the east show very similar patterns regarding the use of vegetation communities (Fig. 11). Overview of 7209s and 7215s availability of all seven vegetation communities (100% MCP, far left) in their combined extent, their utilization with increasing intensity of use at k=40, followed by vegetation communities underlying isopleths with increasing eccentricity isopleth level at a =30,000 (imperfect measure of direction of motion).
Stipa grasslands receive a decreasing trend in intensity of use in general, whereas riparian vegetation constitutes an important component of the highest iso-levels (for both extension and intensity of use). But only with increasing intensity of use (not with increasing directional movement) is Nitraria s.
Areas frequently revisited or visited for a long duration
Although no clear day-night pattern can be seen for any selected hsp region, the oasis at Chonin Us received the longest stays and the highest revisits from 7215 during the winter (Fig. 12). This behavior is best illustrated in the first-year subset of the Erkhes group (Fig. A2). The full 7215 dataset has been found to produce the most comprehensive scatter plot for the trunk, allowing for the most accurate definition of regions between all three individuals and their annual subsets.
Overlap in high intensity areas between years
Overlap in high intensity areas between the two harem groups
This was confirmed by transferring the respective regions to the date and hour chart (Fig. 12) and further examination in the attribute table of 7215 in ArcMap. They can also get a better view of the Bijvallei (for predator activity, for example) or look for sources of mineral origin. The identification of the enclosure via the application of multiple metrics (hsp, density isopletes and directional pathways) confirms the successful implementation of T-LoCoH as an exploratory tool that would reveal such a structure even if the observer was unaware of its existence of it.
Overlaps of sub-combined monitoring years, as well as overlaps of sympatric individual data sets, highlight the central role of oasis and designated corridors in use (and extension) distributions for all analyzed groups (Fig. 13 and Fig. 14). The fact that the use of the least productive community (Haloxylon a.) by 6092 decreases with intensity of use, but does not do so with increasing direction of movement is a clear indication of the different behavioral features illustrated by the density isopleths ( intensity of use, i.e. important resources) and from extension isopleths (direction of movement; i.e. corridors). This is confirmed by the proportional increase in the use of the most productive types of vegetation with increasing density-iso level.
However, it illustrates the importance of the most productive vegetation communities in Przewalski's horse habitat, as they account for 97.5% of the shared highest use isopleths (10% iso level, Fig. 10 and Fig. 13C) while they account for only 2.6% within their available range (100% MCP). This may be due to the additional use of the river bed and topographical features, as well as the extensive oasis at Chonin Us and the limited skewed exploitation within the enclosure (which both mares experienced); features that the 6092 lacks within its range. Long monitoring periods with high sampling frequency allow a large input of data into the estimation of UD, but at the same time increase the probability that the animal will change its "cognitive map" since the start of its monitoring (Powell and Mitchell, 2012).
Large multiyear data in combination with range shifts made the illustration provided by hsp rather complicated and the selection of meaningful regions almost impossible (Fig. A3). Spatio-temporal characterization of Przewalski's horses via the T-LoCoH toolbox approach leads to deeper and sufficient knowledge about the underlying drivers of space and time use (Lyons et al., 2013). Attraction of the familiar: the importance of spatial familiarity in habitat selection in the wapiti Cervus elaphus.
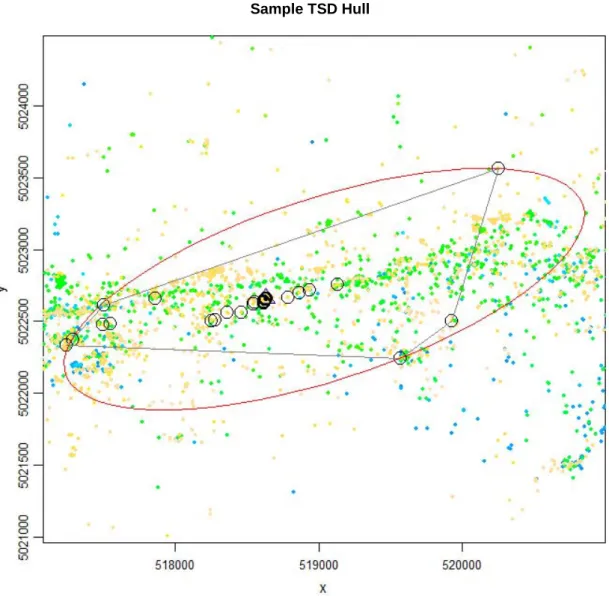
The ellipse outlined in red is the limiting ellipse whose eccentricity is one of the indicators of hull elongation.