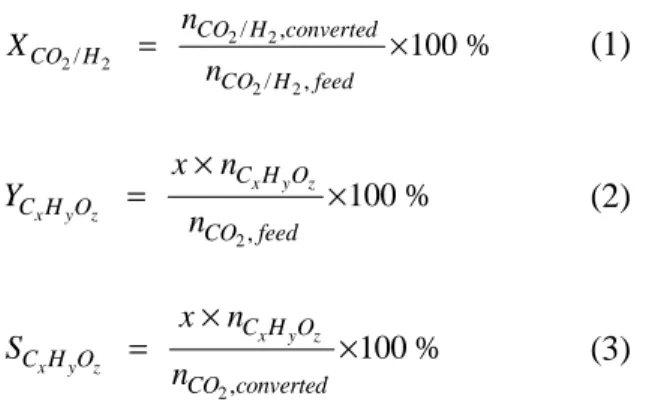
For different gas mixing ratios, the main underlying reaction pathways for the conversion of the inlet gases and the formation of CO, CH4, CH2O and CH3OH are indicated. Recently, interest in the development of new sustainable industrial processes for the direct hydrogenation of CO2 to CH3OH has been increasing due to the potential of CH3OH in a growing hydrogen economy. Moreover, the focus of this article is on the main underlying pathways that determine the conversion of CO2.
Detailed information on the construction of the chemistry set and the transport coefficients and wall interaction coefficients used in the model can be found in our earlier papers.87, 108. Finally, the dominant reaction pathways for the conversion of the inlet gases and the formation of CO, CH4 , CH2O and CH3OH will be pointed out for the different gas mixing ratios.
Densities of the Plasma Species
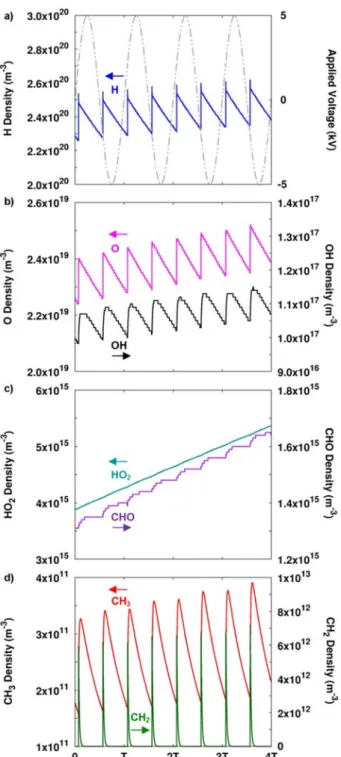
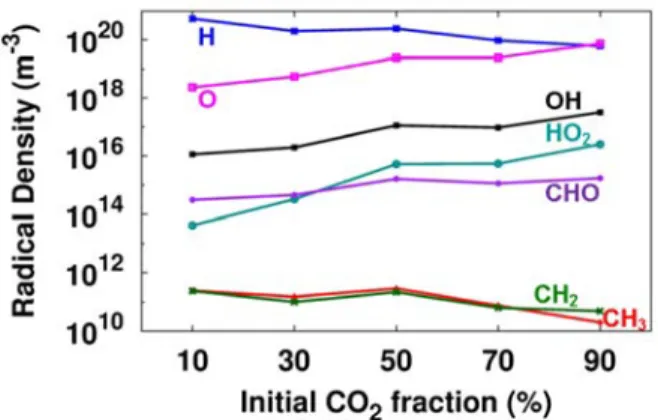
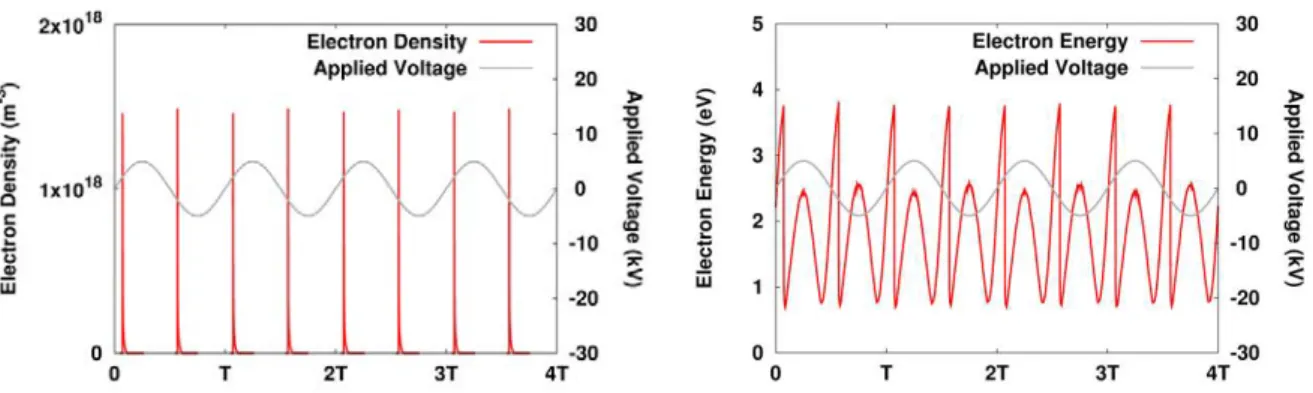
Only the CH3 and CH2 radicals vary over a wide range as a function of time within one period of the applied voltage, while the other radicals show only a slight (~10%) periodic variation (H, O, OH) , or show almost no periodic variation at all (HO2, CHO). The spatially and time-averaged densities of the most abundant radicals in CO2/H2 are plotted in Figure 3 as a function of the initial CO2 in the mixture. Spatially averaged radical densities as a function of time for a 50/50 CO2/H2 gas mixture, as well as the applied sinusoidal voltage (grey, right axis in (a)) for four periods of the applied voltage (i.e. between 0.0016 and 0.002 s).
Spatial and time-averaged (taken over 1 period, i.e. between 0.0019 and 0.002 s) radical densities as a function of the initial CO2 fraction in the CO2/H2 gas mixture. The other ion densities are 2 or even more orders of magnitude lower, and thus the ion densities are much lower than the spatially and time-averaged densities of the most abundant radicals, indicating that the ions play a minor role in the plasma chemistry (see also Sections 3.3 and 3.4 below). The densities of the stable molecules do not exhibit a periodic behavior like the electrons and radicals.
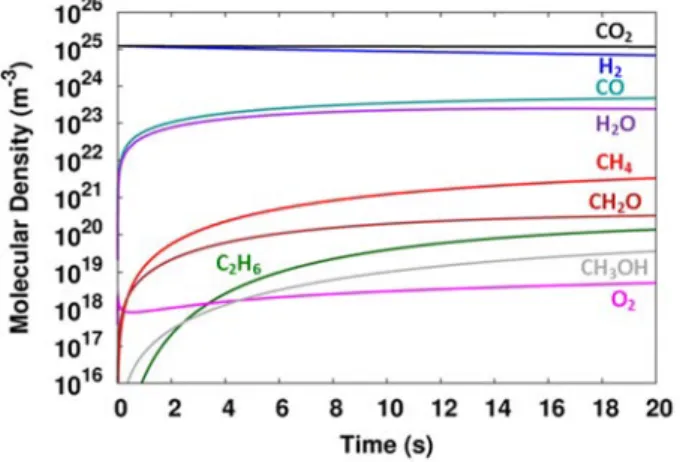
The density of the molecules formed during the hydrogenation of CO2, i.e. CO, hydrocarbons and higher order oxygenates, show an increasing trend as a function of time because their net production is higher than their net consumption. The conversion is more pronounced in the first seconds, and then the molecular density does not change significantly for a longer residence time, as is clear from Figure 4, for both CO2 and H2, as well as for the most abundant. This can be explained because H2O is formed by the collision of OH and H radicals.
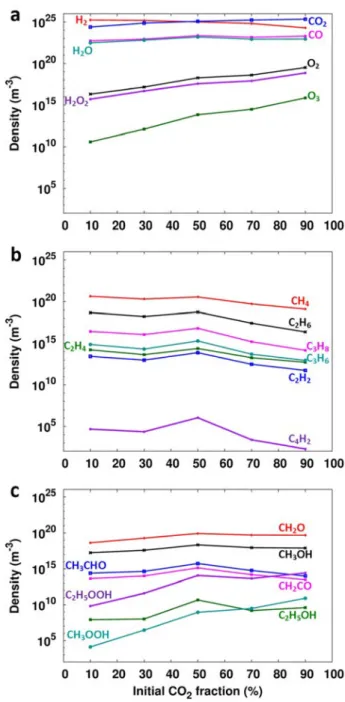
On the other hand, the densities of O2, H2O2 and O3 increase by several orders of magnitude with increasing initial fraction of CO2, which is logical since they are directly formed from the CO2 fission products (O and O2). Compared to our previous results on the formation of higher hydrocarbons and oxygenates in CH4/O2 and CH4/CO2 mixtures87, it is clear that, apart from CO and H2O, the densities of the main end products are now several orders of magnitude lower. Spatially averaged molecular densities as a function of the initial CO2 fraction in the CO2/H2 gas mixture after a residence time of 5 s.
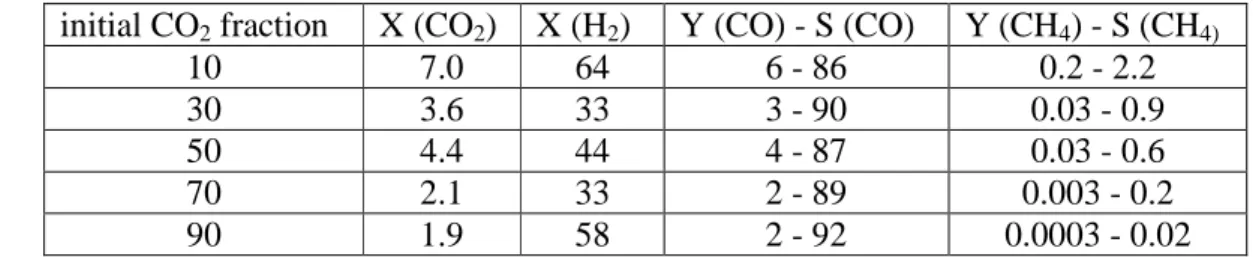
This can be explained because CH2, which is a direct dissociation product of CH4, is much more abundant in CO2/CH4 than in CO2/H2 and thus provides an additional and very important CO2 loss process in a CO2/CH4. Since CO is produced directly by electron impact dissociation of CO2 (see section 3.3 below), the yield of CO shows the same trend as the conversion of CO2, with values of only 2-6. In addition, CO is the only C-containing molecule produced directly from CO2, which is why the selectivity of CO is around 90% in all cases.
The yields of C2H6, CH2O and CH3OH are one or two orders of magnitude lower than those of CH4, while the yields of other higher hydrocarbons and oxygenates are even more negligible, which is of course a direct consequence of the rather low conversion of CO2 in all gas mixing ratios. Note that there is also sticking of C atoms and hydrocarbons to the walls, which explains why the sum of the selectivities is not equal to 100. An examination of the maximum conversions of the input gases, ie. CO2 and H2, and maximum CO and CH4 yields and corresponding selectivities for different CO2/H2 gas mixtures.
Dominant Reaction Pathways
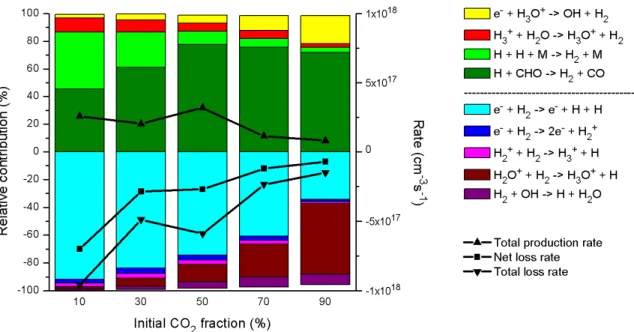
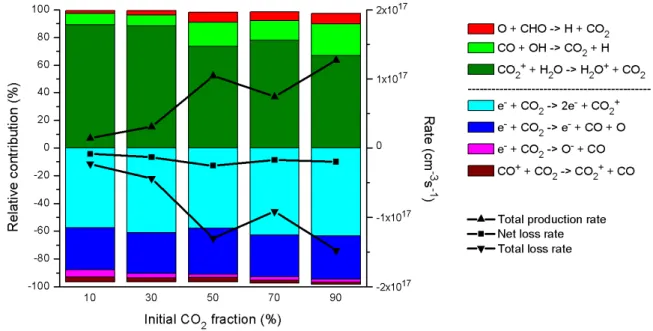
This result was also obtained in earlier simulations carried out in our group for pure CO2 fission.27 Furthermore, the relative importance of the different consumption and production processes is more or less independent of the gas mixing ratio, as is clear from Figure 6. Relative contributions of the different production and consumption processes of CO2. left axis), as well as the time-averaged total production rate, total loss rate and net loss rate (right axis), as a function of the initial CO2 fraction in the CO2/H2 gas mixture. At an initial CO2 inlet fraction of 10%, electron impact dissociation is the most important loss process for H2, but part of the H atoms will recombine again into H2, or react with CHO radicals into H2 and CO. Relative contributions of the production and consumption processes of H2 (left axis), as well as the time-averaged total production rate, total loss rate and net loss rate (right axis), as a function of the initial CO2 fraction in the CO2/H2 gas mixture .
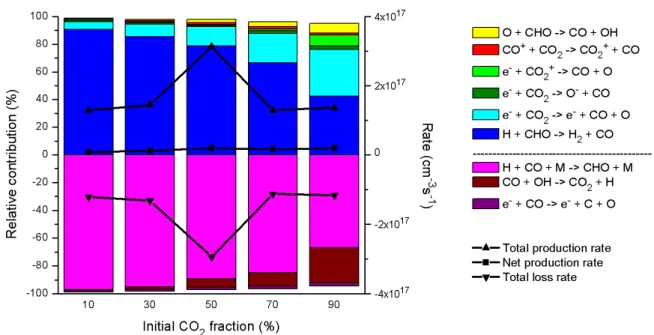
In Figure 8 the most important channels for the production (and loss) of CO are illustrated as a function of the initial fraction of CO2 in the gas mixture. The most important reactions for the production (and loss) of CH4 are shown in Figure 9 as a function of the initial fraction of CO2 in the gas mixture. A similar trend is observed for the net CH4 production rate as a function of initial CO2 fraction as for the net H2 loss rate (see Figure 7 above).
Relative contributions of CH4 production and consumption processes (left axis), as well as the time-averaged total production rate, total loss rate, and net production rate (right axis), as a function of the initial fraction of CO2 in CO2 / H2 gas mixture. Figures 10 and 11 show the dominant reactions for the production (and loss) of CH2O and CH3OH, respectively, as a function of the initial fraction of CO2 in the gas mixture. Relative contributions of CH2O production and consumption processes (left axis), as well as the time-averaged total production rate, total loss rate, and net production rate (right axis), as a function of the initial fraction of CO2 in CO2 /H2 gas mixture.
Relative contributions of the production and consumption processes of CH3OH (left axis) as well as the time-averaged total production rate, total loss rate and net production rate (right axis), as a function of the initial CO2 fraction in the CO2 /H2 gas mixture.
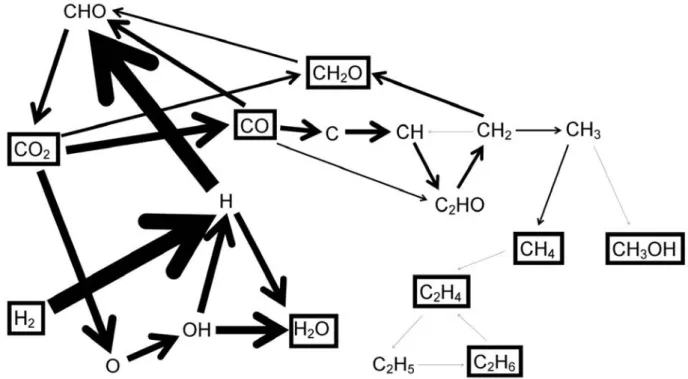
The thick arrow line from H to CHO in Figure 12 clearly shows that the formation of CHO from CO and H indeed takes place at a very high rate. In addition, electron impact dissociation of CO results in the formation of C radicals, which further react to CH, CH2, C2HO, and CH3 radicals in several sequential radical recombination reactions. The formed CH2 radicals react with CO2 to form CH2O, as can also be seen in Figure 10 above.
The CH3 radicals readily form CH4, which is much more favored (ie, the rate is 1 order of magnitude greater) than the formation of CH3OH from CH3. From the reaction scheme, it is clear that a lot of subsequent radical reactions are necessary for the formation of (higher) hydrocarbons and oxygenates, such as CH4, C2H6, CH2O and CH3OH, which explains the very low yields and selectivities of these ends. products (see section 3.2 above). Indeed, the lack of direct formation of CH2 and CH3 in CO2/H2, which is important in CO2/CH4 gas mixtures87, combined with the very low turnover of CO2, which in turn is due.
Furthermore, it was found that the addition of H2O to a CO2 plasma even produces a drop in the CO2 conversion, because the OH radicals formed from H2O partitioned in the plasma recombine with CO molecules back into CO2 . In addition to the CO2 conversion and CO yield, the energy efficiency of the CO2 conversion to CO is also a key performance indicator for this technology. Indeed, the dielectric packing produces enhanced electric fields in the plasma, due to polarization of the dielectric beads, which results.
The thickness of the arrow lines is proportional to the rates of the net reactions.
Conclusions
Improving the Conversion and Energy Efficiency of Carbon Dioxide Fission in a Zirconium-Packed Dielectric Barrier Reactor. Direct conversion of methane and carbon dioxide to higher hydrocarbons using catalytic dielectric barrier discharges with zeolites. Synthesis of organic compounds from mixtures of methane with carbon dioxide in dielectric barrier discharges at atmospheric pressure.
Conversion of methane to higher hydrocarbons in the presence of carbon dioxide using dielectric-barrier discharge plasma. Effect of electrical pulse shapes on CO2 reforming of methane using atmospheric dielectric barrier discharge. Dry Methane Reforming in a Dielectric Barrier Discharge Reactor with Ni/Al2O3 Catalyst: Catalyst and Plasma Interaction.
Carbon dioxide reforming of methane using a dielectric barrier discharge reactor: Effect of helium dilution and kinetic model. The influence of helium on the conversion of methane and carbon dioxide in a dielectric barrier discharge. Plasma-catalytic dry reforming of methane in an atmospheric dielectric barrier discharge: Understanding the synergistic effect at low temperature.
The dominant pathways for the conversion of methane to oxygen and syngas in a dielectric barrier discharge at atmospheric pressure. Fluid modeling of the conversion of methane to higher hydrocarbons in an atmospheric pressure dielectric barrier discharge. Plasma-assisted CO2 conversion in a dielectric barrier discharge reactor: Understanding the effect of packing materials.