No part of the publication may be reproduced in any form by print, photoprint, microfilm or any other means without written permission from the publisher.
List of Symbols
W/B mass ratio of water to mortar binder kg/kg w volume fraction of water in mortar m3/m3.
Acknowledgements
Abstract
Het experimentele gedeelte start met het meten en beschrijven van de reologie van mortels en van de slurry van bindmiddel en water in verschillende stromingsregimes. De onderzochte eigenschappen vormen samen de verwerkbaarheid van de mortel, een begrip dat de brug vormt tussen fysische eigenschappen en praktisch gebruik door de metselaar.
Introduction
Problem statement
In the case of installation and dry assembly mortars, the water content is determined by the mason or assistant immediately before application. The reasons for this can be found in the influence of sand, which is mostly a regional product, as well as different traditions in education, the use of tools, climatic differences, etc.
Aim of the research
A clear understanding of a mortar's workability as a function of the properties of its components paves the way for optimization of the composition. Due to the limited overlap with the main topic, this section is only briefly mentioned in the text.
Methodology
This is relevant for the statistical quantification of the variability in masonry due to workability related issues. The second step is the search for a suitable theoretical framework for each of the observed processes.
State of the art
- Concise literature review on workability
- Standards on fresh mortar properties
- Overview of European and other standards
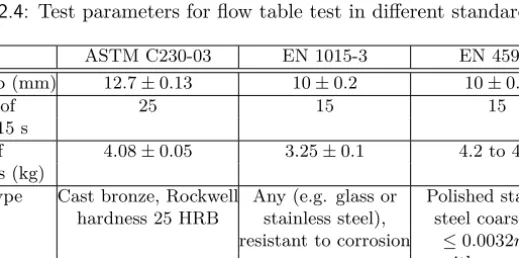
- The flow table test
- The Emley plasticity meter
- Non-standardised tests for fresh mortar
- Simple hand-operated tests
- Mixer type rheometers
- Moving object rheometers
- Concrete rheometers
- Dynamic impact setups
- Dewatering rheometry
- Tribometer
- Summary
The mason can best assess the workability by observing the reaction of the mortar to the trowel." And further: "The ability of a masonry mortar to maintain satisfactory workability under the influence of the suction and evaporation rate of masonry unit depends on the water retentiveness and setting properties of the mortar (ASTM, 2004a)." In the same philosophy, Kampff identifies six properties that control workability: consistency, water retention, time of setting, weight, adhesion and permeability (Kampff, 1961). The strength of the flow table is that it gives an indication of flow stress.
Theoretical aspects of rheology and hygric properties of
Introduction
A mortar is more complex because the solid skeleton changes due to water transport: it is supersaturated in the initial state and the grains come closer together as the water is desorbed. Contact between the dewatered slurry and the porous substrate is described in terms of desorptivity, sorptivity and transfer sorptivity.
Composition of mortar
- General terminology
- Mix ratio, composition and phase relationships
- Dry mix ratios for reference mortars
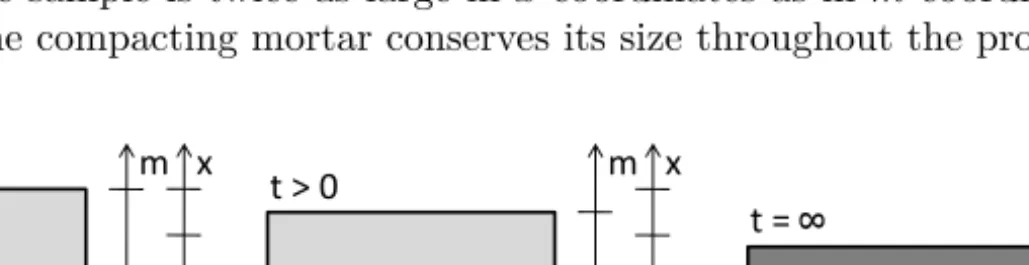
The bulk density of mortar ρM can be written as the total mass per unit volume, including the air present in that volume. It is significantly higher than the loose packing (measured after seeding) and lower than the bulk density of the compacted powder (Section 4.2).
Mortar rheology
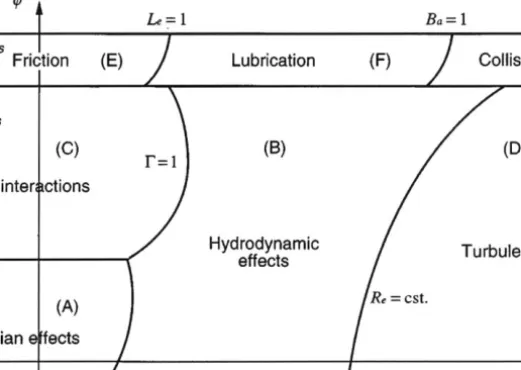
- Driving forces, continuum approach and flow regimes
- Suspension rheology, maximum packing and polydispersity
- Yield stress, thixotropy and the Bingham model
- Squeeze flow theory
- Semi-empirical mortar rheometry
Conversely, the presence of the particles leads to changes in the velocity field in the surrounding media. The boundary condition is no slip (rough plates, stuck flow) and constant velocity of one of the plates. The solution of the velocity field is based on variational analysis and the minimization of an energy dissipation function.
Geotechnical concepts applied to mortar
- Stress and deformation of soil
- Porosity of soils, compaction and consolidation
- Water transport in soil and application to mortar
- Slurry filtration
If drainage is possible, some of the pore water will drain until equilibrium is reached. We can assume that the reduction in the volume of the mortar layer is opposite to the volume of the discharged water. The change in mortar volume during application may or may not be taken into account when determining the water retention curve.
Water transport in mortar and brick
- Porosity and water content of mortar and brick
- Capillarity in brick
- Liquid potential in mortar
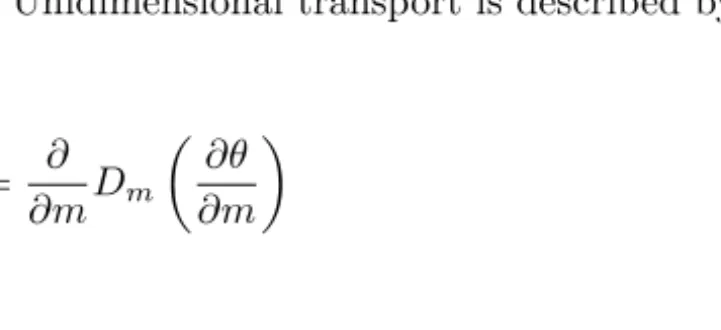
- Liquid transport laws, diffusivity and permeability
- Sorptivity, desorptivity and transfer sorptivity
- Measuring water content
It is assumed that during the dewatering of a mortar per brick, the volume of the other phases in the mortar remains constant, so that the void ratio can be recalculated from the amount of desorbed water. The expression of Kozeny and Carman can be used for both individual permeabilities of the components. During this stage, a portion of the rock reaches the capillary water content over a certain depth.
Summary
In shear, the grain effect is much stronger than the fluid effect, and this grain effect depends on the normal stress. In this approach, the yield stress can be written as a function of the normal internal stress carried by the grains, called the effective stress. Geotechnical theory also covers the compaction of granular materials during drainage and the transport of liquids through the soil.
Introduction
Materials and mixing procedures
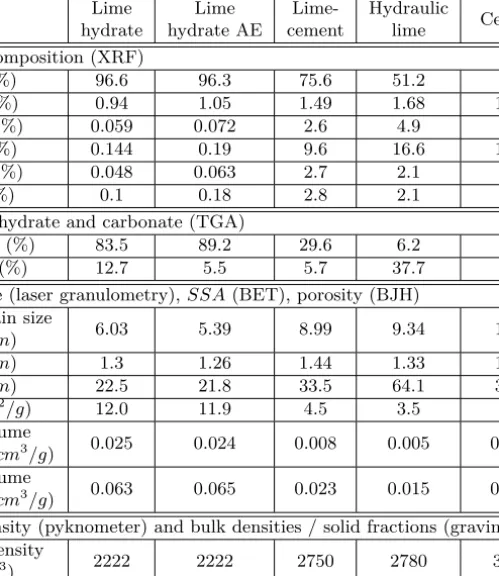
- Binders
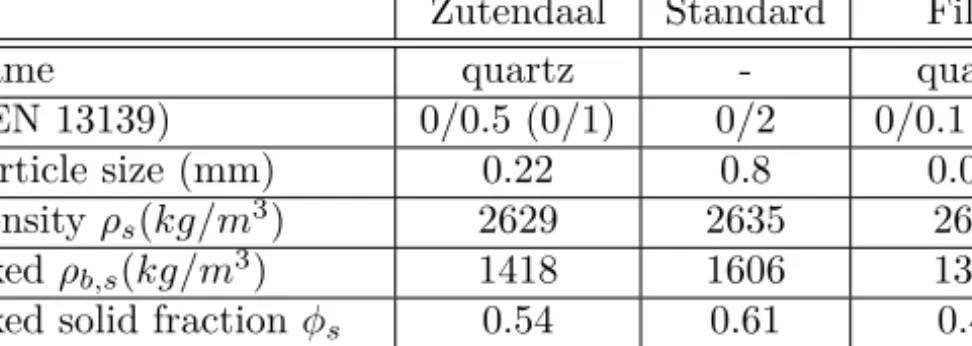
- Sand
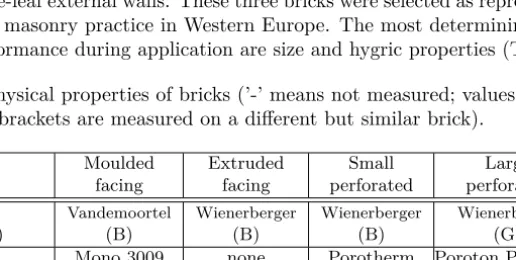
- Bricks
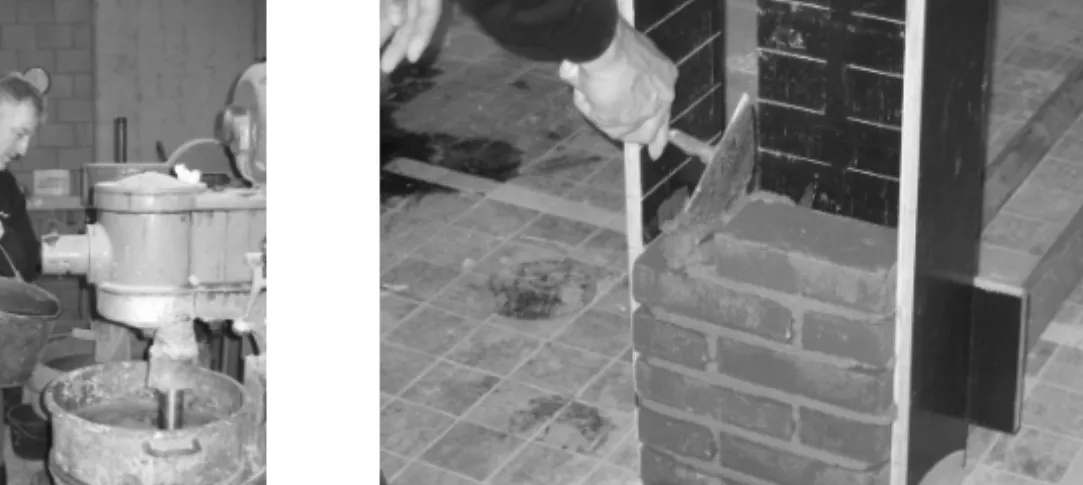
- Mixing procedures
From 1:30-2:00 take the bowl out of the mixer and beat the material sticking to the walls with a paddle to homogenize it as much as possible. From 0:30-1:00 take the bowl out of the mixer and grind the material sticking to the walls with the paddle to homogenize it as much as possible. From 2:00-3:00 take the bowl out of the mixer and with a whip scrape all the material sticking to the walls to homogenize it as much as possible.
Test setup and procedures
- General outline of the experiments
- Experimental setup and course of one test
Some preliminary experiments and experiments with the vane device and the direct shear device were done with the mixing procedure given in EN 196-1, but with double amounts. 1:30-3:00 stop the mixer; during the first 15 seconds, using a rubber scraper, remove all the mortar that sticks to the wall and bottom of the bowl and place it in the center of the bowl;
Quantitative results and composition of reference mortarsmortars
- Chosen water content for fixed dry mixes
- Relation between water content, working method and penetration valuepenetration value
- The composition of reference mortars
- Parenthesis: reproducibility and adaptation of reference mortarsmortars
The result of this analysis should be taken into account together with the observations on the way the masons work (Table 4.5) and the measured values of penetration (Figure 4.3). The reference mortars consist of the results of the 1st section of the practical tests: B/S is based on Table 3.1 and W/B is fixed to the average from the figure. The new reference value was chosen as the ordinate of the target value on the linear regression line (Figure 4.5).
Qualitative results and definition of workability
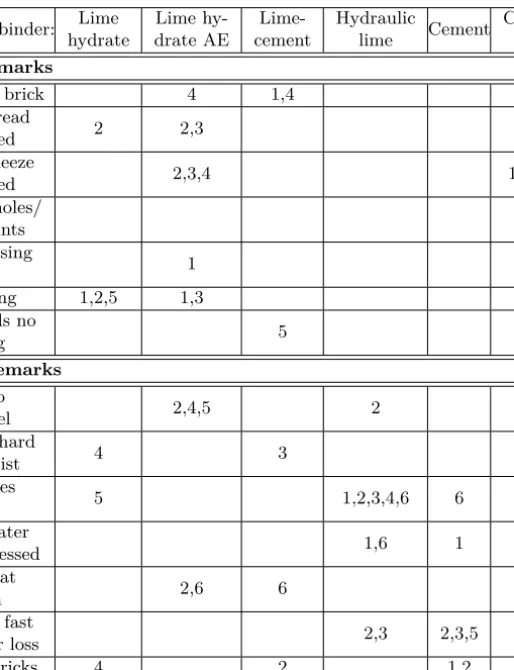
- Description of workability properties for all mortars
- Characterisation of the separate mortars
- Results of masons’ inquiry
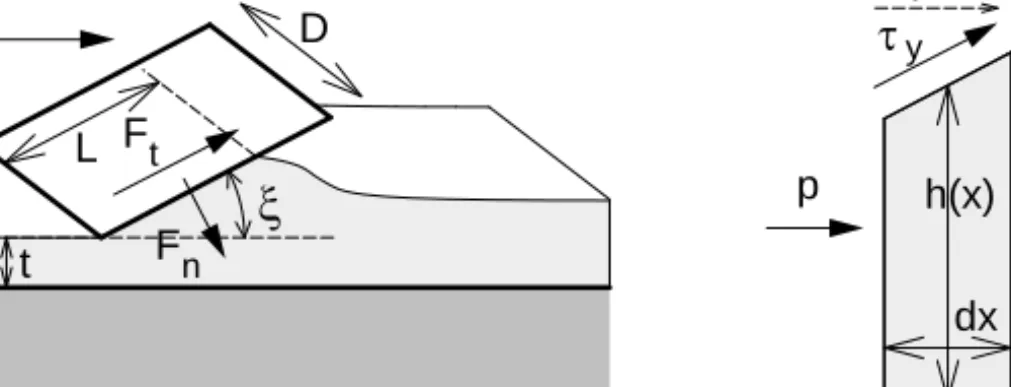
The shear strength of the mortar is also related to the applied normal force, with the ratio between the normal stress and the shear stress depending on the angle of the trowel. The effect is worsened when the water content of the mortar is higher and the mortar has low viscosity or yield stress. The second major problem was the floating of the bricks that occurred with the AE hydrate lime mortar.
Defining workability
Those who use them do not know these products, they are delivered in large flasks labeled mortar oil or mortar fat, without indicating the contents, unless official technical approval is taken into account. Dosing depends on user experience and there is some awareness of the risk of error. When asked if different mortar mixes were used for different types of bricks or different parts of the building, he answered in the negative with the exception of the Dutch mason.
Influence of workability on mechanical strength
- Objectives and test methods
- Masonry strength and strength of components
Nevertheless, these differences in mortar strength could not be correlated with the strength of the masonry. In general, the ratio of masonry strength between the various binders is much weaker than the corresponding ratio in mortar strength. The use of the model given in Eurocode 6 for prediction of masonry strength from the strength of the components was applied to the results, and proved to be conservative for expected value (CEN, 2002).
Summary
Despite this general agreement, systematic differences between single bricklayers could be detected with a significance of 80. A bricklayer who applies full filling of joints and squeezes mortar out of the joints chooses a higher W/B. A study of the parameters related to these three properties can be suggested as the best way to quantify the workability of a mortar.
Rheological experiments for the evaluation of workability
Introduction
- Relevant shear rates for bricklaying
- Test methods
The primary purpose is to find meaningful relationships between particle properties, mixing ratio, composition and rheological behavior of the mortar mixture.
Standardised rheology-related tests
- Preliminary tests on various mortars
- Tests on reference mortars
The obtained values are used to formulate possible improvements to the interpretation, based on the knowledge of the yield stress of the bucket. It can be concluded that the flow table test can give a good indication of a mortar's dimensionless yield stress. The results of the piston penetration test are also compared to the measured blade tension.
Rotational rheometry of binder slurries
- Viskomat measurements: technique and validation
- Coaxial cylinders rheometry
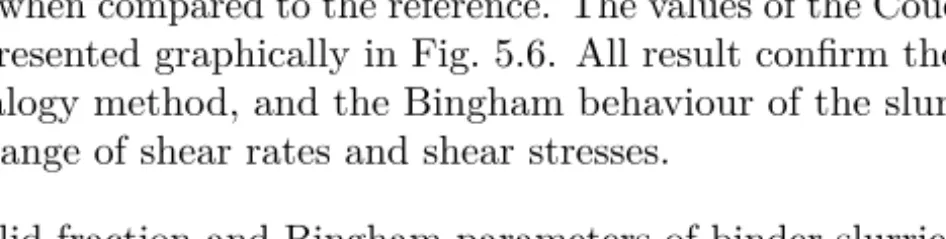
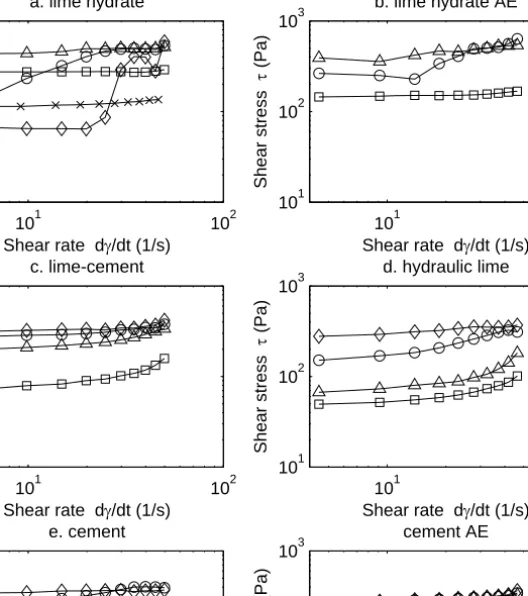
- Concentration effect of binder slurries
- Alternative approach to concentration effect of Bingham binder slurriesbinder slurries
Additional comparative data is provided by a limited series of parallel measurements of the same lime hydrate slurries and slaked lime putty masses on a Malvern Gemini. The above analysis of solids concentration relates the apparent viscosity η of binder slurries to the parameters of the Krieger-Dougherty law. The lime hydrate slurry is possibly more prone to agglomeration or flocculation and to the influence of the deformability of the flocs.
Rotational rheometry of mortars
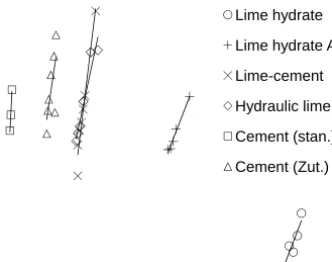
- Bingham behaviour of mortars
- Concentration and the effect of air entrapment
- Bimodal and trimodal mortars: Farris’ law
In the case of sand in our experiments, when we take the vibrated solid fraction for the first, and the adjusted φm for the second, we get The composition of the trimodal mortar is made in such a way that for each value ofφT: φb =φf =φs. The curve obtained for the bimodal mortar gives an underestimation of the experimental data by about 30% (Fig. 5.16).
Compactability and maximum packing
The same tests performed on relatively dry mortar mixtures give maximum total solid fractions φT between 0.69 and 0.71, for mortars without air agent (Fig. 5.18). For air-entrained mortars, reproducibility is problematic: only hydrated lime mortar AE could be measured and had a maximum solids fraction of 0.68 m3/m3. The compaction rate of a mortar can be defined as the actual solid content divided by the maximum solid content.
Vane measurements
- Laboratory vane apparatus for clayey soil
- Small-scale vane measurements
The development in time of the yield stress of binder paste was measured with the vane test for lime hydrate. The tests were carried out in a cylindrical pan with dimensions 3 times larger than those of the wing. The vane was lowered to the center of the pot and the test started 4 minutes after the end of mixing.
Direct shear apparatus
- Total stress behaviour of mortar and sand
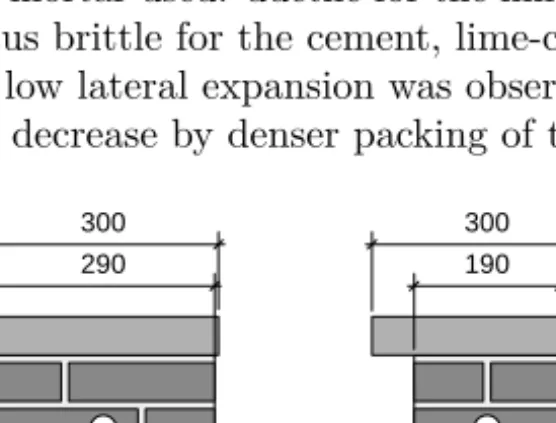
- Dilation of mortar and sand
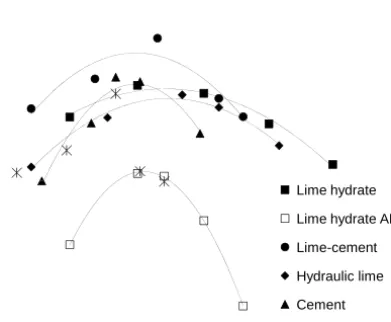
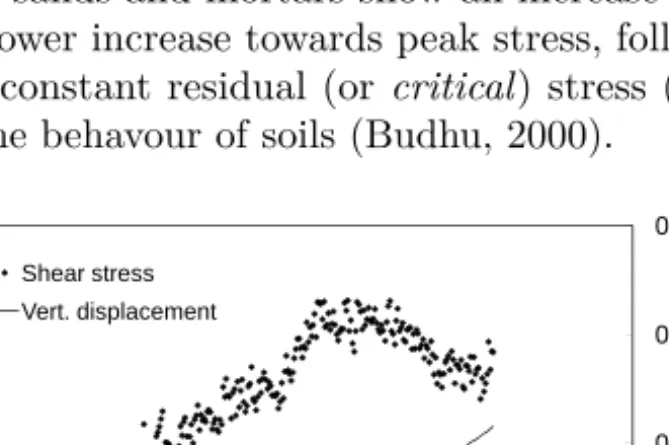
The scatter in low normal force tests is significant due to the limited precision of the force cell. Tables 5.9 and 5.10 give the calculated values of the peak expansion angle for three types of mortar and dry and moist sand. The differences in the sand at different normal stresses and moisture contents may be due to the initial state of compaction before the start of the test.
Squeeze tests
The first contact between the upper surface and the material and the start of the test was 4 minutes after the end of the mixing procedure. At very high solid fractions of the mortar, a slight change of the local water content. A theoretical basis for a numerical analysis of the influence of water velocity and transport is given in Sherwood.
Summary: feasibility of rheological tests for mortarmortar
Considerable improvements must be made to operate a direct shear in conditions more relevant to mortar applications. In addition, normal stress appears to be very important, and should also be adaptable and measurable. From the scientific point of view, adaptations of triaxial test setups are interesting to investigate for feasibility.
Water transport experiments and combined workability
Introduction
Standardised water retention tests
Desorption tests and permeability tests
- Suction tests
- Filter press tests
- Permeameter tests
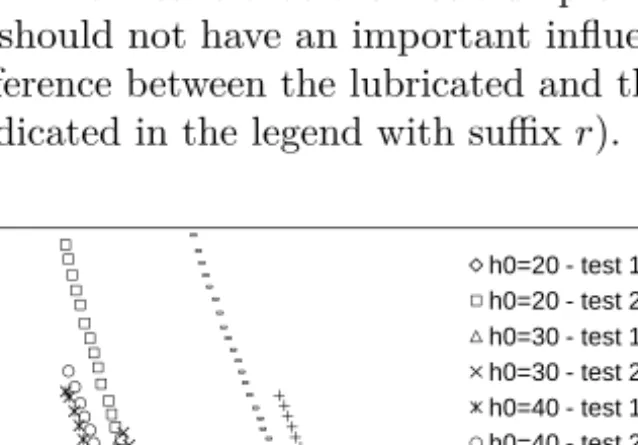
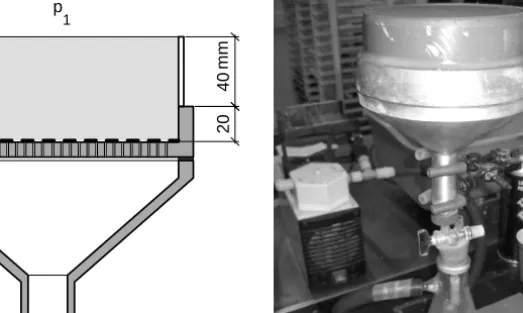
This asymptotic value corresponds to the equilibrium solids contentφ∞ in the mortar for the applied vacuum suction. The compressed air is connected to the upper chamber of the pressure cell with a valve, which makes it possible to regulate the pressure. Normally lime hydrate and lime cement fall at the higher end of the same geotechnical category with Ksat ≈ 2.5 and 2.8·10−7m/s.
Water transport measurements by microfocus X- ray radiographyray radiography
- Aim, method and validation
- Moisture profiles in brick and attenuation in mortar
- From mortar testing to model parameters
The moment the mortar is spread on top of the brick is taken as reference time = 0. Such a plot can therefore be used to check the validity of the measurement method (Fig. 6.9). The shape of the moisture front is slightly steeper for the mortars that release more water.
Modelling water transport
- Finite volume method
- Boundary conditions
- Determination of interface potential
- Discussion of modelling results
For the initial condition, the water ratio of the freshly mixed mortar is taken from Table 4.6 and the water ratio of the brick is zero. We can identify two causes for this difference: errors in the estimation of mortar and brick parameters (in both directions) and the influence of boundary resistance. A local change in transport properties can be related to the jamming of introduced binder particles just before the boundary in mortar, or to the jamming of pores with the smallest binder particles in brick.